
Rationale and Objectives
Molecular imaging modalities such as positron emission tomography (PET)/computed tomography (CT) have emerged as an essential diagnostic tool for monitoring treatment response in lymphoma patients. However, quantitative assessment of treatment outcomes from serial scans is often difficult, laborious, and time consuming. Automatic quantization of longitudinal PET/CT scans provides more efficient and comprehensive quantitative evaluation of cancer therapeutic responses. This study develops and validates a Longitudinal Image Navigation and Analysis (LINA) system for this quantitative imaging application.
Materials and Methods
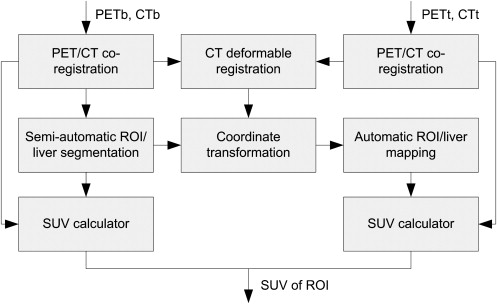
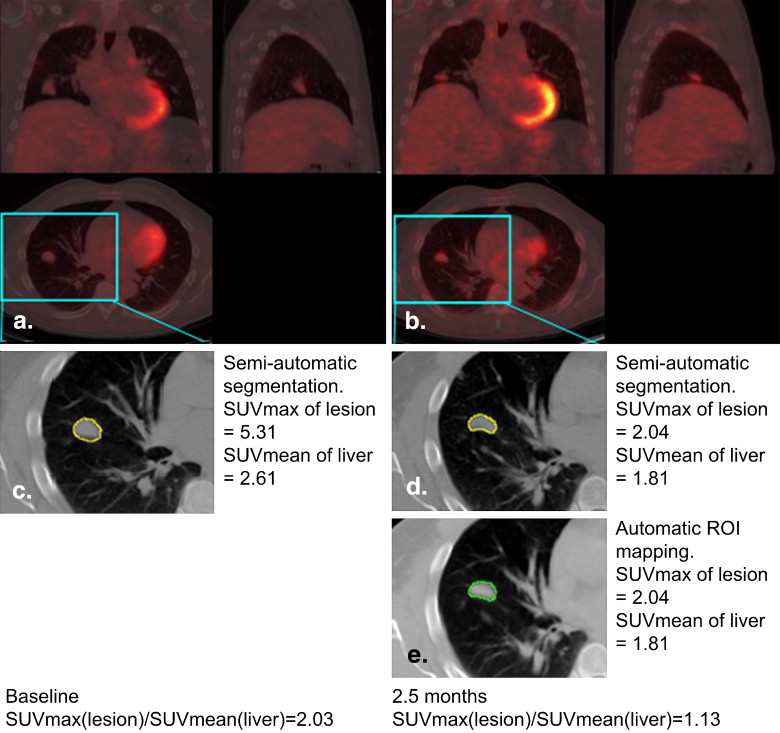
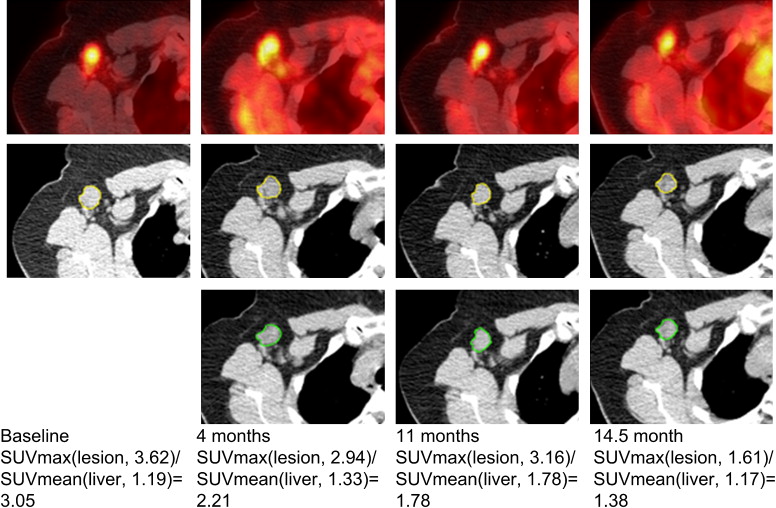
LINA is designed to automatically construct longitudinal correspondence along serial images of individual patients for changes in tumor volume and metabolic activity via regions of interest (ROI) segmented from a given time point image and propagated into the space of all follow-up PET/CT images. We applied LINA retrospectively to nine lymphoma patients enrolled in an immunotherapy clinical trial conducted at the Center for Cell and Gene Therapy, Baylor College of Medicine. This methodology was compared to the readout by a diagnostic radiologist, who manually measured the ROI metabolic activity as defined by the maximal standardized uptake value (SUVmax).
Results
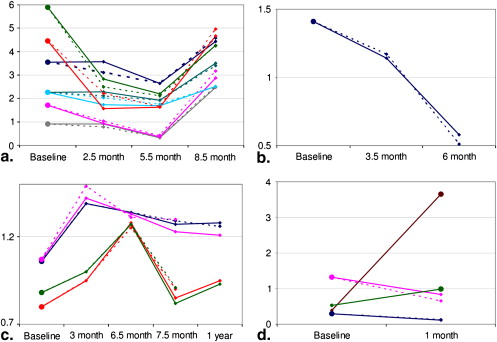
Quantitative results showed that the measured SUVs obtained from automatic mapping are as accurate as semiautomatic segmentation and consistent with clinical examination findings. The average of relative squared differences of SUVmax between automatic and semiautomatic segmentation was found to be 0.02.
Conclusions
These data support a role for LINA in facilitating quantitative analysis of serial PET/CT images to efficiently assess cancer treatment responses in a comprehensive and intuitive software platform.
Lymphoma is a hematologic malignancy of lymphocyte origin, accounting for approximately 5% of all cancers in the United States . This diverse group of diseases is broadly classified as Hodgkin disease or non-Hodgkin’s lymphoma with several subclassification schemes to describe various cellular, genetic, and clinical subtypes . Treatment for lymphoma is dependent on its type and stage, as well as the age and general clinical status of the patient. For most early-stage lymphomas, the standard first-line treatment for lymphoma includes chemotherapy with or without radiation therapy . Immunotherapy, radioimmunotherapy, and hematopoietic stem-cell transplantation have added to the therapeutic armamentarium especially for patients with aggressive, recurrent, or advanced disease. Accurate monitoring of patients undergoing any form of treatment is critical for evaluating response and disease recurrence. However, the diagnostic gold standard, tissue biopsy, is both invasive and logistically difficult to perform on all patients at various time intervals.
Currently, treatment responses are assessed by a canonical approach that integrates clinical examination, laboratory findings, and imaging data. Positron emission tomography (PET)/computed tomography (CT) combining metabolic information using the positron-emitting sugar analog, [F-18]-fluorodeoxyglucose (FDG), with morphologic changes in tumor size , has been well studied in the evaluation of treatment response and predictive value in patients with lymphoma . Combined modality PET/CT has been shown to improve the diagnostic accuracy over either modality alone, particularly for lymphoma . Relative FDG uptake in lesions of active high-grade lymphomas are typically high, thus allowing for quantitative assessment of disease status . Despite the growing clinical imaging knowledgebase, interpretation of PET/CT studies is largely dependent on imprecise criteria for measuring mass lesions and relative tumor metabolism, both of which are manually acquired. Moreover, multiple PET/CT scans obtained over time generate massive amounts of data, most of which are analyzed manually adding significant inefficiency and risk for errors in the interpretation process. Clinical investigators are thus hampered by the absence of validated quantitative methods for evaluating therapy response in an efficient and robust format.
Get Radiology Tree app to read full this article<
Get Radiology Tree app to read full this article<
Get Radiology Tree app to read full this article<
Materials and methods
Data
Get Radiology Tree app to read full this article<
Patients
Get Radiology Tree app to read full this article<
Computer-Assisted Quantitative Analysis
Get Radiology Tree app to read full this article<
Get Radiology Tree app to read full this article<
Co-registration of PET and CT images
Get Radiology Tree app to read full this article<
Segmentation of ROI
Get Radiology Tree app to read full this article<
Determining Longitudinal Deformation of serial CT Images
Get Radiology Tree app to read full this article<
Get Radiology Tree app to read full this article<
Et=∑v∈Ω{|e[It(ft(Rt(v)))]−e[I0(v)]|2+∑i=−1,1|e[It(ft(Rt(v)))]−e[It+i(ft+i(Rt+i(v)))]|2}, E
t
=
∑
v
∈
Ω
{
|
e
[
I
t
(
f
t
(
R
t
(
v
)
)
)
]
−
e
[
I
0
(
v
)
]
|
2
+
∑
i
=
−
1
,
1
|
e
[
I
t
(
f
t
(
R
t
(
v
)
)
)
]
−
e
[
I
t
+
i
(
f
t
+
i
(
R
t
+
i
(
v
)
)
)
]
|
2
}
,
where e[] e
[
] is the operator for calculating the features around each voxel of the image, and Ω Ω is the image domain. In this work, the feature vector for each voxel consisted of the image intensity, gradient magnitude, and the fuzzy membership functions obtained by performing a four-dimensional (4D) fuzzy c-mean algorithm on the images (assuming three tissue types: bone, low-intensity and high-intensity tissues) (ie, e[v]=[I(v),|∇I(v)|,μv,1,μv,2,μv,3]) e
[
v
]
=
[
I
(
v
)
,
|
∇
I
(
v
)
|
,
μ
v
,
1
,
μ
v
,
2
,
μ
v
,
3
]
) . Because the cubic B-Spline was used to model the deformation field, the continuity and smoothness was guaranteed, and the smoothness regularization term of the deformation field was omitted. Further, we used a topological regularization step to ensure that the Jacobian determinants of the deformations fields were positive. Thus the topology of the deformation field did not change from one image onto the subsequent images. The serial image registration algorithm then iteratively refines the deformation field ft f
t of each time point image by minimizing the energy function in Equation 1 and performs 4D clustering of the image series until convergence. Notice that in the first iteration, since the registration results for neighboring images were not available, only the first term of Equation 1 was used, which is essentially a pairwise FFD .
Get Radiology Tree app to read full this article<
Automatic ROI Delineation and Quantitative Indexing
Get Radiology Tree app to read full this article<
Get Radiology Tree app to read full this article<
SUV(v)=Radioactive concentration at v(MBq/g)Injected dose(MBq)/Patient body weight(g). S
U
V
(
v
)
=
Radioactive concentration at v
(
MBq
/
g
)
Injected dose
(
MBq
)
/
Patient body weight
(
g
)
.
Get Radiology Tree app to read full this article<
Get Radiology Tree app to read full this article<
Get Radiology Tree app to read full this article<
QI(rt)=SUVmaxSUVmean=maxv∈rt{SUV(v)}mean(SUV(livert)). Q
I
(
r
t
)
=
S
U
V
max
S
U
V
mean
=
max
v
∈
r
t
{
S
U
V
(
v
)
}
mean
(
S
U
V
(
liver
t
)
)
.
Get Radiology Tree app to read full this article<
Get Radiology Tree app to read full this article<
Results
Get Radiology Tree app to read full this article<
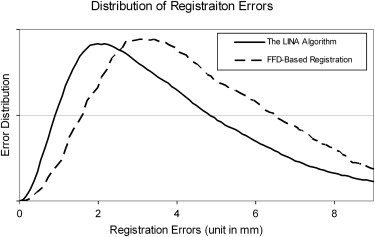
Quantitative Evaluation of the Algorithm
Get Radiology Tree app to read full this article<
Registration Error=1N|Ω|∑i=1,…,N∑v∈Ω∣∣fi,v−f∗i,v∣∣, Registration Error
=
1
N
|
Ω
|
∑
i
=
1
,
…
,
N
∑
v
∈
Ω
|
f
i
,
v
−
f
i
,
v
∗
|
,
where N=10 N
=
10 is the number of testing images, and |Ω| |
Ω
| represents the number of voxels in the template image domain. fi,v f
i
,
v is the resultant deformation at voxel v v for testing image i i , and f∗i,v f
i
,
v
∗ is the corresponding ground truth from the simulated deformation fields.
Get Radiology Tree app to read full this article<
Get Radiology Tree app to read full this article<
Get Radiology Tree app to read full this article<
Get Radiology Tree app to read full this article<
Get Radiology Tree app to read full this article<
Get Radiology Tree app to read full this article<
error=∑i∈N(SUVmax(ri)−SUVmax(rˆi))2(SUVmax(ri))2/N, e
r
r
o
r
=
∑
i
∈
N
(
S
U
V
max
(
r
i
)
−
S
U
V
max
(
r
ˆ
i
)
)
2
(
S
U
V
max
(
r
i
)
)
2
/
N
,
where ri r
i and rˆi r
ˆ
i denote the segmentation results using the semiautomatic/manual segmentation and the proposed automatic mapping for the i th, respectively. N N is the total number of ROIs under evaluation. For all the ROIs of the nine patients we studied, this average normalized squared difference is 0.02. Therefore, the computer-assisted quantitative analysis method obtains similar results with the “gold standard.”
Get Radiology Tree app to read full this article<
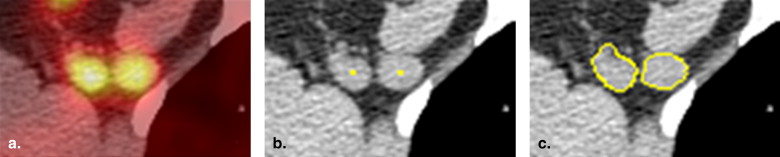
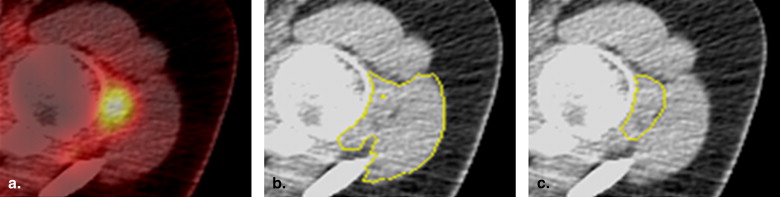
Segmentation and Visualization of Longitudinal ROI Mapping
Get Radiology Tree app to read full this article<
Get Radiology Tree app to read full this article<
Get Radiology Tree app to read full this article<
Get Radiology Tree app to read full this article<
Get Radiology Tree app to read full this article<
Get Radiology Tree app to read full this article<
Get Radiology Tree app to read full this article<
Get Radiology Tree app to read full this article<
Get Radiology Tree app to read full this article<
Get Radiology Tree app to read full this article<
Get Radiology Tree app to read full this article<
Get Radiology Tree app to read full this article<
Get Radiology Tree app to read full this article<
Get Radiology Tree app to read full this article<
Get Radiology Tree app to read full this article<
Conclusion
Get Radiology Tree app to read full this article<
References
1. Jemal A., Siegel R., Ward E., et. al.: Cancer statistics, 2008. CA Cancer J Clin 2008; 58: pp. 71-96.
2. Morton L.M., Turner J.J., Cerhan J.R., et. al.: Proposed classification of lymphoid neoplasms for epidemiologic research from the Pathology Working Group of the International Lymphoma Epidemiology Consortium (InterLymph). Blood 2007; 110: pp. 695-708.
3. Hoppe R., Mauch P.M., Armitage J.O., et. al.: Hodgkin lymphoma.2007.Lippincott Williams & WilkinsPhiladelphia, PA
4. Antoch G., Freudenberg L.S., Debatin J.F., et. al.: A radiologist’s perspective on dual-modality PET/CT: optimized CT scanning protocols and their effect on PET quality. J Nucl Med 2002; 43: pp. 307.
5. Bar-Shalom R., Yefremov N., Guralnik L., et. al.: Clinical performance of PET/CT in evaluation of cancer: additional value for diagnostic imaging and patient management. J Nucl Med 2003; 44: pp. 1200-1209.
6. Coleman R.E., Delbeke D., Guiberteau M.J., et. al.: Concurrent PET/CT with an integrated imaging system: intersociety dialogue from the joint working group of the American College of Radiology, the Society of Nuclear Medicine, and the Society of Computed Body Tomography and Magnetic Resonance. J Nucl Med 2005; 46: pp. 1225-1239.
7. Ell P.J.: The contribution of PET/CT to improved patient management. Br J Radiol 2006; 79: pp. 32-36.
8. Farma J.M., Santillan A.A., Melis M., et. al.: PET/CT fusion scan enhances CT staging in patients with pancreatic neoplasms. Ann Surg Oncol 2008; 15: pp. 2465-2471.
9. Sironi S., Messa C., Mangili G., et. al.: Integrated FDG PET/CT in patients with persistent ovarian cancer: correlation with histologic findings. Radiology 2004; 233: pp. 433-440.
10. Schiepers C., Filmont J.E., Czernin J.: PET for staging of Hodgkin’s disease and non-Hodgkin’s lymphoma. Eur J Nucl Med Mol Imaging 2003; 30: pp. S82-S88.
11. Hutchings M., Barrington S.F.: PET/CT for therapy response assessment in lymphoma. J Nucl Med 2009; 50: pp. 21S-30S.
12. Weber W.A.: Assessing tumor response to therapy. J Nucl Med 2009; 50: pp. 1S-10S.
13. Kostakoglu L., Goldsmith S.J.: F-18-FDG PET evaluation of the response to therapy for lymphoma and for breast, lung, and colorectal carcinoma. J Nucl Med 2003; 44: pp. 224-239.
14. Kuo P.H., Carlson K.R., Christensen I., et. al.: FDG-PET/CT for the evaluation of response to therapy of cutaneous T-cell lymphoma to vorinostat (suberoylanilide hydroxamic acid, SAHA) in a phase II trial. Mol Imaging Biol 2008; 10: pp. 306-314.
15. De Barsy C., Depas G., Dresse M.F., et. al.: Whole-body FDG PET imaging as a method for staging and early assessment of treatment response in pediatric patients with lymphoma. J Nucl Med 2003; 44: pp. 346.
16. Eich H.T., Kobe C., Dietlein M., et. al.: FDG-PET for treatment response assessment in advanced stage Hodgkin lymphoma—report on the 2nd interim analysis of GHSG trial HD15. Strahlenther Und Onkol 2008; 184: pp. 11.
17. Moulin-Romsee G., Spaepen K., Stroobants S., et. al.: Cost-effectiveness of early treatment response assessment by PET in non-Hodgkin lymphoma. Eur J Nucl Med Molec Imaging 2007; 34: pp. S242.
18. Pregno P., Chiappella A., Bello M., et. al.: Response assessment in aggressive non Hodgkin lymphoma disease: predictive value of mid-treatment evaluation by 18-FDG-positron emission tomography/computed tomography (PET). Ann Oncol 2008; 19: pp. 249-250.
19. Pregno P., Chiappella A., Penna D., et. al.: Predictive value of response assessment with mid-treatment evaluation of 18-FDG-positron emission tomography/computed tomography (PET) in aggressive non Hodgkin lymphoma (NHL). Haematologica Hematol J 2007; 92: pp. 59-60.
20. Stroobants S., Brepoels L., Thomas J., et. al.: PET-CT for treatment response assessment in lymphoma. Haematologica Hematol J 2007; 92: pp. 20.
21. Fueger B.J., Yeom K., Czernin J., et. al.: Comparison of CT, PET, and PET/CT for staging of patients with indolent non-Hodgkin’s lymphoma. Mol Imaging Biol 2009; 11: pp. 269-274.
22. Hernandez-Maraver D., Hernandez-Navarro F., Gomez-Leon N., et. al.: Positron emission tomography/computed tomography: diagnostic accuracy in lymphoma. Br J Haematol 2006; 135: pp. 293-302.
23. Macapinlac H.A.: The utility of 2-deoxy-2-[18F]fluoro-D-glucose-positron emission tomography and combined positron emission tomography and computed tomography in lymphoma and melanoma. Mol Imaging Biol 2004; 6: pp. 200-207.
24. Ngeow J.Y., Quek R.H., Ng D.C., et. al.: High SUV uptake on FDG-PET/CT predicts for an aggressive B-cell lymphoma in a prospective study of primary FDG-PET/CT staging in lymphoma. Ann Oncol 2009; 20: pp. 1543-1547.
25. Yan J.Y., Zhao B.S., Curran S., et. al.: Automated matching and segmentation of lymphoma on serial CT examinations. Med Phys 2007; 34: pp. 55-62.
26. Pekar V., Kaus M.R., McNutt T.: 3D image segmentation.Office USPaT ed. 3D image segmentation.2009.Koninklijke Philips Electronics N.V.Amsterdam, Netherlands City:
27. Sofka M., Stewart C.V.: Location registration and recognition (LRR) for longitudinal evaluation of corresponding regions in CT volumes. Med Image Comput Comput Assist Interv Int Conf Med Image Comput Comput Assist Interv 2008; 11: pp. 989-997.
28. Duncan J., Ayache N.: Medical image analysis: progress over two decades and the challenges ahead. IEEE Trans Pattern Anal Mach Intell 2000; 22: pp. 85-106.
29. Rueckert D., Sonoda L.I., Hayes C., et. al.: Nonrigid registration using free-form deformations: application to breast MR images. IEEE Transactions Med Imaging 1999; 18: pp. 712-721.
30. Marsland S., Twining C.J., Taylor C.: A minimum description length objective function for group-wise non-rigid image registration. Image Vision Comput 2008; 26: pp. 333-346.
31. Xue Z, Wong K, Wong STC. Joint registration and segmentation of serial lung CT images for image-guided lung cancer diagnosis and therapy. Computerized Medical Imaging and Graphics;34:55–60.
32. Bollard C.M., Gottschalk S., Leen A.M., et. al.: Complete responses of relapsed lymphoma following genetic modification of tumor-antigen presenting cells and T-lymphocyte transfer. Blood 2007; 110: pp. 2838-2845.
33. Jenkinson M., Smith S.: A global optimisation method for robust affine registration of brain images. Med Image Anal 2001; 5: pp. 143-156.
34. Press W.H., Flannery B.P., Teukolsky S.A., et. al.: Numerical recipes in C.1992.Cambridge University PressCambridge, UK
35. Paragios N., Mellina-Gottardo O., Ramesh V.: Gradient vector flow fast geometric active contours. IEEE Trans Patt Anal Machine Intell 2004; 26: pp. 402-407.
36. Rueckert D., Frangi A.F., Schnabel J.A.: Automatic construction of 3-D statistical deformation models of the brain using nonrigid registration. IEEE Trans Med Imaging 2003; 22: pp. 1014-1025.
37. Ceresoli G., Zucali P., Van Hemert R., et. al.: Positron emission tomography with F18-fluorodeoxyglucose (FDG-PET) in malignant pleural mesothelioma (MPM): Prediction of response to chemotherapy by quantitative assessment of standard uptake value (SUV). Lung Cancer 2005; 49: pp. S219.
38. Keyes J.W.: Suv—standard uptake or silly useless value. J Nucl Med 1995; 36: pp. 1836-1839.
39. Luo J.: Estimate standard uptake value (SUV) in F18FDG PET tumor imaging. Med Phys 2006; 33: pp. 2014-2015.
40. Mahan S., Ramsey C.: Automatic generation of standard uptake value (SUV) isolines for treatment planning. Med Phys 2003; 30: pp. 1429.
41. Panizo C.M., Panizo E., Bosch J., et. al.: The maximum standard uptake value (SUVmax) of PET/CT correlates with lymphoma aggressivity. Ann Oncol 2008; 19: pp. 250.
42. Suzuki O., Morimoto M., Hashiguchi H., et. al.: Standardization of PET standard uptake value for delineating GTV in integrated PET-CT of head and neck cancer. Int J Radiat Oncol Biol Phys 2008; 72: pp. S409.
43. Thie J.A.: Understanding the standardized uptake value, its methods, and implications for usage. J Nucl Med 2004; 45: pp. 1431-1434.
44. Rosenberg S.A.: National Cancer Institute sponsored study of classifications of non-Hodgkins lymphomas - summary and description of a working formulation for clinical usage. Cancer 1982; 49: pp. 2112-2135.
45. Vercauteren T., Pennec X., Perchant A., et. al.: Non-parametric diffeomorphic image registration with the demons algorithm. Med Image Comput Comput Assist Interv Int Conf Med Image Comput Comput Assist Interv 2007; 10: pp. 319-326.
46. Xue Z., Shen D., Davatzikos C.: Statistical representation of high-dimensional deformation fields with application to statistically constrained 3D warping. Med Image Anal 2006; 10: pp. 740-751.
47. Jenkinson M. FLIRT. Book FLIRT. v5.5 ed. Oxford, UK: University of Oxford. Available online: http://www.fmrib.ox.ac.uk/fsl/flirt/index.html . Accessed November 20, 2009.