
Rationale and Objectives
Brain lesions, especially white matter lesions (WMLs), are associated with cardiac and vascular disease, but also with normal aging. Quantitative analysis of WML in large clinical trials is becoming more and more important.
Materials and Methods
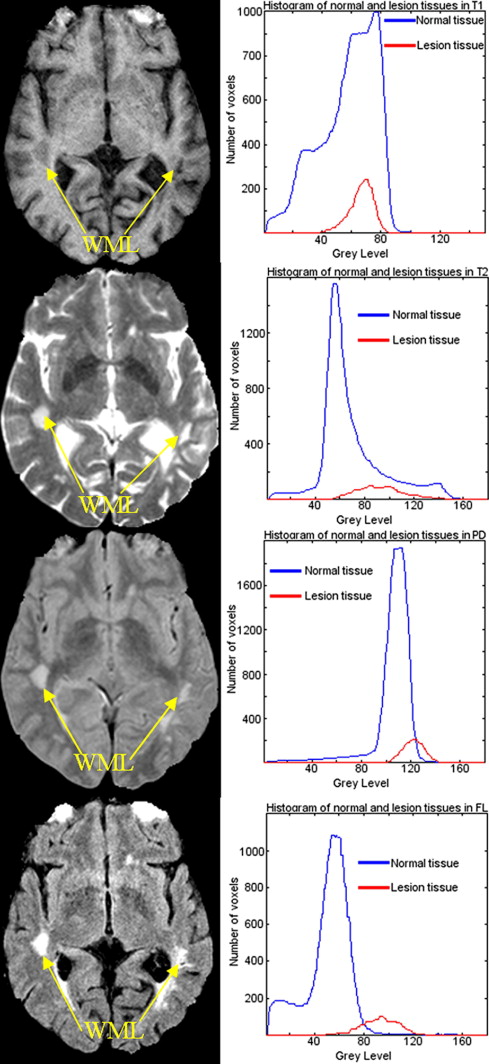
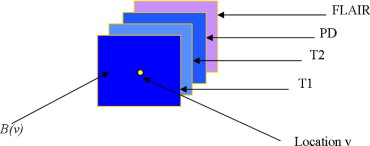
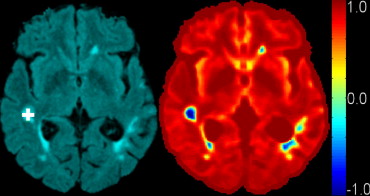
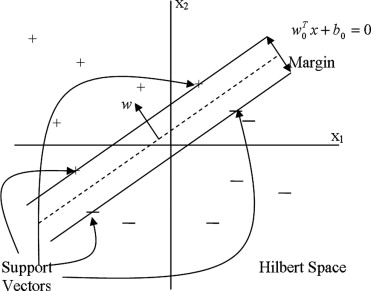
In this article, we present a computer-assisted WML segmentation method, based on local features extracted from multiparametric magnetic resonance imaging (MRI) sequences (ie, T1-weighted, T2-weighted, proton density-weighted, and fluid attenuation inversion recovery MRI scans). A support vector machine classifier is first trained on expert-defined WMLs, and is then used to classify new scans.
Results
Postprocessing analysis further reduces false positives by using anatomic knowledge and measures of distance from the training set.
Conclusions
Cross-validation on a population of 35 patients from three different imaging sites with WMLs of varying sizes, shapes, and locations tests the robustness and accuracy of the proposed segmentation method, compared with the manual segmentation results from two experienced neuroradiologists.
Cerebrovascular disease (CVD) in elderly individuals is very important. In particular, CVD increases the likelihood of clinical dementia ( ) even in the absence of clinical stroke ( ), albeit the literature is somewhat inconclusive as to whether CVD has simply an additive role to Alzheimer’s disease (AD) or there are interactions between the two. Approximately one third of patients that meet clinical and pathologic diagnostic criteria for AD have some degree of vascular pathology ( ). The impact of CVD on mild cognitive impairment—in which the etiology of the cognitive deficit is generally less clear—is likely to be even greater. Therefore, to identify biologic markers specific to the AD process, it is critical to also identify the extent of concurrent CVD related brain injury that is often clinically silent ( ), because, at the very least, CVD increases the likelihood of clinical presentation of dementia, for the same level of AD-related pathology.
Population studies, such as the Cardiovascular Health Study or the Rotterdam Scan Study, have shown that brain lesions, especially white matter lesions (WMLs), are associated with age, clinically silent stroke, higher systolic blood pressure, lower forced expiratory volume in 1 second, hypertension, atrial fibrillation, carotid and peripheral arterioscleroses, impaired cognition, and depression ( ). Furthermore, it has been shown that stroke patients with a large WML load have an increased risk of hemorrhagic transformation, higher preoperative risk of a disabling or fatal stroke during endarterectomy, or intercerebral hemorrhage during anticoagulation therapy ( ). The increased interest in brain lesion research may improve diagnosis and prognosis possibilities for patients with cardiovascular symptoms.
Get Radiology Tree app to read full this article<
Get Radiology Tree app to read full this article<
Get Radiology Tree app to read full this article<
Get Radiology Tree app to read full this article<
Get Radiology Tree app to read full this article<
Get Radiology Tree app to read full this article<
 Open full size image
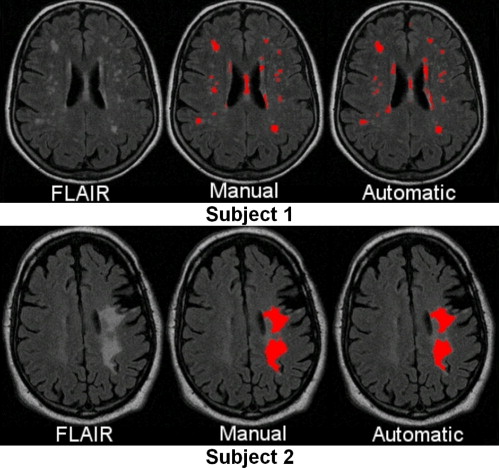
Figure 1
Summary of our computer-assisted white matter lesion segmentation protocol.
Get Radiology Tree app to read full this article<
Methods
Patients and MR Imaging
Get Radiology Tree app to read full this article<
Preprocessing
Get Radiology Tree app to read full this article<
Training
Manual segmentation
Get Radiology Tree app to read full this article<
Attribute vector
Get Radiology Tree app to read full this article<
Get Radiology Tree app to read full this article<
Get Radiology Tree app to read full this article<
Get Radiology Tree app to read full this article<
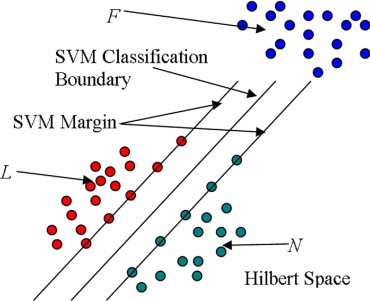
SVMs
Get Radiology Tree app to read full this article<
Get Radiology Tree app to read full this article<
Get Radiology Tree app to read full this article<
K(x,y)=exp(∥x−y∥22α2) K
(
x
,
y
)
=
exp
(
‖
x
−
y
‖
2
2
α
2
)
where x and y are two feature vectors, and α controls the size of the Gaussian kernel.
Get Radiology Tree app to read full this article<
Get Radiology Tree app to read full this article<
Training SVM via AdaBoost
Get Radiology Tree app to read full this article<
Segmenting a New Image
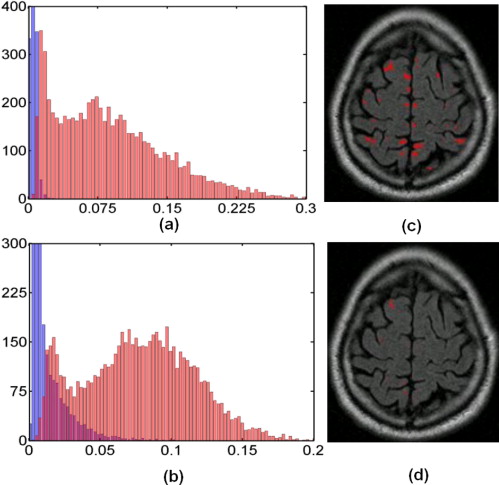
Voxel-wise segmentation of WML by SVM
Get Radiology Tree app to read full this article<
Get Radiology Tree app to read full this article<
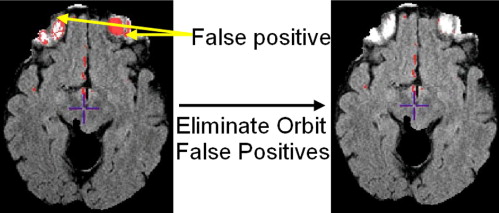
Elimination of false-positive labels
Get Radiology Tree app to read full this article<
Get Radiology Tree app to read full this article<
D2h(v1,v2)=K(v1,v1)+K(v2,v2)−2K(v1,v2), D
h
2
(
v
1
,
v
2
)
=
K
(
v
1
,
v
1
)
+
K
(
v
2
,
v
2
)
−
2
K
(
v
1
,
v
2
)
,
where K is the Gaussian kernel function used by the SVM.
Get Radiology Tree app to read full this article<
Get Radiology Tree app to read full this article<
Get Radiology Tree app to read full this article<
Get Radiology Tree app to read full this article<
Get Radiology Tree app to read full this article<
Results
Get Radiology Tree app to read full this article<
Get Radiology Tree app to read full this article<
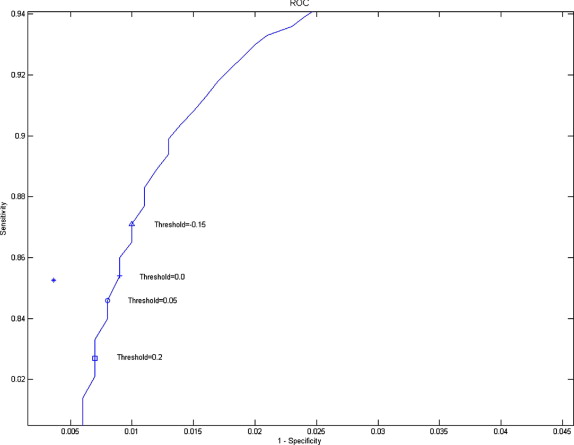
ROC Analysis
Get Radiology Tree app to read full this article<
Get Radiology Tree app to read full this article<
Get Radiology Tree app to read full this article<
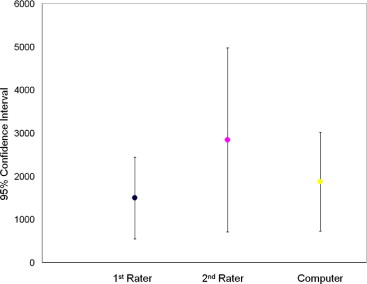
Statistical Analysis
Get Radiology Tree app to read full this article<
Get Radiology Tree app to read full this article<
Get Radiology Tree app to read full this article<
Get Radiology Tree app to read full this article<
Discussion
Get Radiology Tree app to read full this article<
Get Radiology Tree app to read full this article<
Get Radiology Tree app to read full this article<
Get Radiology Tree app to read full this article<
Get Radiology Tree app to read full this article<
Get Radiology Tree app to read full this article<
Get Radiology Tree app to read full this article<
Get Radiology Tree app to read full this article<
Get Radiology Tree app to read full this article<
Acknowledgments
Get Radiology Tree app to read full this article<
Get Radiology Tree app to read full this article<
References
1. Prins N.D., van Dijk E.J., den Heijer T., et. al.: Cerebral white matter lesions and the risk of dementia. Arch Neurol 2004; 61: pp. 1531-1534.
2. Snowdon D.A., Greiner L.H., Mortimer J.A., et. al.: Brain infarction and the clinical expression of Alzheimer’s disease. JAMA 1997; 277: pp. 813-817.
3. Schneider J.A., Wilson R.S., Cochran E.J., et. al.: Relation of cerebral infarctions to dementia and cognitive function in older persons. Neurology 2003; 60: pp. 1082-1088.
4. Schneider J.A., Wilson R.S., Bienias J.L., et. al.: Cerebral infarctions and the likelihood of dementia from Alzheimer disease pathology. Neurology 2004; 62: pp. 1148-1155.
5. Vermeer S.E., Prins N.D., den Heijer T., et. al.: Silent brain infarcts and the risk of dementia and cognitive decline. N Engl J Med 2003; 348: pp. 1215-1222.
6. Gearing M., Mirra S.S., Hedreen J.C., et. al.: The Consortium to Establish a Registry for Alzheimer’s Disease (CERAD). Neurology 1995; 45: pp. 461-466.
7. Ince P., Xuerb J., Mackenzie I.R., et. al.: Neuropathology of a community sample of elderly demented and nondemented people. Brain Pathol 2000; 10: pp. 592-593.
8. Vermeer S.E., Prins N.D., den Heijer T., et. al.: Silent brain infarcts and the risk of dementia and cognitive decline. N Engl J Med 2003; 348: pp. 1215-1222.
9. Zekry D., Duyckaerts C., Moulias R., et. al.: Degenerative and vascular lesions of the brain have synergistic effects in dementia of the elderly. Acta Neuropathol 2002; 103: pp. 481-487.
10. Snowdon D.A., Greiner L.H., Mortimer J.A., et. al.: Brain infarction and the clinical expression of Alzheimer disease. JAMA 1997; 277: pp. 813-817.
11. Schneider J.A., Wilson R.S., Bienias J.L., et. al.: Cerebral infarctions and the likelihood of dementia from Alzheimer disease pathology. Neurology 2004; 13: pp. 1148-1155.
12. de Groot J.C., de Leeuw F.E., Oudkerk M., et. al.: Cerebral white matter lesions and cognitive function: the Rotterdam Scan Study. Ann Neurol 2000; 47: pp. 145-151.
13. de Groot J.C., de Leeuw F.E., Oudkerk M., et. al.: Cerebral white matter lesions and depressive symptoms in elderly adults. Arch Gen Psychiatry 2000; 57: pp. 1071-1076.
14. Longstreth W.T., Manolio T.A., Arnold A., et. al.: Clinical correlates of white matter findings on cranial magnetic resonance imaging of 3301 elderly people. Stroke 1996; 27: pp. 1274-1282.
15. Briley D.P., Haroon S., Sergent S., et. al.: Does leukoaraiosis predict morbidity and mortality?. Neurology 2000; 54: pp. 90-94.
16. Allen K.V., Frier B.M., Strachan M.W.J.: The relationship between type 2 diabetes and cognitive dysfunction: longitudinal studies and their methodological limitations. Eur J Pharmacol 2004; 490: pp. 169-175.
17. Arvanitakis Z., Wilson R.S., Bienias J.L., et. al.: Diabetes mellitus and risk of Alzheimer disease and decline in cognitive function. Arch Neurol 2004; 61: pp. 661-666.
18. Luchsinger J.A., Tang M.X., Stern Y., et. al.: Diabetes mellitus and risk of Alzheimer’s disease and dementia with stroke in a multiethnic cohort. Am J Epidemiol 2001; 154: pp. 635-641.
19. Araki Y., et. al.: MRI of the brain in diabetes mellitus. Neuroradiology 1994; 36: pp. 101-103.
20. Eguchi K., Kario K., Shimada K.: Greater impact of coexistence of hypertension and diabetes on silent cerebral infarcts. Stroke 2003; 34: pp. 2471-2474.
21. Heijer T., Vermeer S.E., van Dijk , et. al.: Type 2 diabetes and atrophy of medial temporal lobe structures on brain MRI. Diabetologia 2003; 46: pp. 1604-1610.
22. Inoue T., Fushimi H., Yamada Y., et. al.: Asymptomatic multiple lacunae in diabetics and non-diabetics detected by brain magnetic resonance imaging. Diabetes Res Clin Pract 1996; 31: pp. 81-86.
23. Kario K., Ishikawa J., Hoshide S., et. al.: Diabetic brain damage in hypertension: role of renin-angiotensin system. Hypertension 2005; 45: pp. 887-893.
24. Schmidt R., Launer L.J., Nilsson L.G., et. al.: Magnetic resonance imaging of the brain in diabetes: the Cardiovascular Determinants of Dementia (CASCADE) study. Diabetes 2004; 53: pp. 687-692.
25. Williamson J., Miller M.E., Bryan R.N., et. al.: The Action to Control Cardiovascular Risk in Diabetes Memory in Diabetes Study (ACCORD-MIND): rationale, design, and methods. Am J Cardiol 2007; 99: pp. 112i-122i.
26. Mäntylä R., Erkinjuntti T., Salonen O., et. al.: Variable agreement between visual rating scales for white matter hyperintensities on MRI comparison of 13 rating scales in a poststroke cohort. Stroke 1997; 28: pp. 1614-1623.
27. Bryan R.N., Manolio T.A., Schertz L.D., et. al.: A method for using MR to evaluate the effects of cardiovascular disease of the brain: the cardiovascular health study. Am J Neuroradiol 1994; 15: pp. 1625-1633.
28. De Groot J.C., De Leeuw F.E., Oudkerk M., et. al.: Periventricular cerebral white matter lesions predict rate of cognitive decline. Ann Neurol 2002; 52: pp. 335-341.
29. Benson R.R., Guttmann C.R., Wei X., et. al.: Older people with impaired mobility have specific loci of periventricular abnormality on MRI. Neurology 2002; 58: pp. 48-55.
30. Smith C.D., Snowdon D.A., Wang H., et. al.: White matter volumes and periventricular white matter hyperintensities in aging and dementia. Neurology 2000; 54: pp. 838-842.
31. Kamber M., Shingal R., Collins D.L., et. al.: Model-based 3-D segmentation of multiple sclerosis lesions in magnetic resonance brain images. IEEE Trans Med Imaging 1995; 14: pp. 442-453.
32. Warfield S., Dengler J., Zaers J., et. al.: Automatic identification of grey matter structures from MRI to improve the segmentation of white matter lesions. J Image Guided Surg 1995; 1: pp. 326-338.
33. Udupa J., Wei L., Samarasekera S., et. al.: Multiple sclerosis lesion quantification using fuzzy-connectedness principles. IEEE Trans Med Imaging 1997; 16: pp. 598-609.
34. Welti D., Gerig G., Radu E.W., et. al.: Spatio-temporal segmentation and characterization of active multiple sclerosis lesions in serial MRI data. Proc Information Proc Med Imaging 2001; pp. 438-445.
35. Zijdenbos A.P., Dawant B.M., Margolin R.A., et. al.: Morphometric analysis of white matter lesions in MR images: method and validation. IEEE Trans Med Imaging 1994; 13: pp. 716-724.
36. Alfano B., Brunetti A., Larobina M., et. al.: Automated segmentation and measurement of global white matter lesion volume in patients with multiple sclerosis. J Magn Reson Imaging 2000; 12: pp. 799-807.
37. Van Leemput K., Maes F., Vandermeulen D., et. al.: Automated segmentation of multiple sclerosis lesions by model outlier detection. IEEE Trans Med Imaging 2001; 20: pp. 677-688.
38. Udupa J.K., Nyúl L.G., Ge Y., et. al.: Multiprotocol MR image segmentation in multiple sclerosis: experience with over 1,000 studies. Acad Radiol 2001; 8: pp. 1116-1126.
39. Van Leemput K., Maes F., Vandermeulen D., et. al.: Automated segmentation of multiple sclerosis lesions my model outlier detection.2000. KU-Leuven
40. Wu Y., Warfield S.K., Tan I.L., et. al.: Automated segmentation of multiple sclerosis lesion subtypes with multichannel MRI. NeuroImage 2006; 32: pp. 1205-1215.
41. Zijdenbos A.P., Forghani R., Evans A.C.: Automatic “pipeline” analysis of 3-D MRI data for clinical trials: application to multiple sclerosis. IEEE Trans MedImaging 2002; 21: pp. 1280-1291.
42. Warfield S.K., Kaus M., Jolesz F.A., et. al.: Adaptive, template moderated, spatially varying statistical classification. Med Image Anal 2000; 4: pp. 43-55.
43. Wei X., Warfield S.K., Zou K.H., et. al.: Quantitative analysis of MRI signal abnormalities of brain white matter with high reproducibility and accuracy. J Magn Reson Imaging 2002; 15: pp. 203-209.
44. Anbeek P., Vincken K.L., van Osch M.J., et. al.: Probabilistic segmentation of white matter lesions in MR imaging. NeuroImage 2004; 21: pp. 1037-1044.
45. Admiraal-Behloul F., van den Heuvel D.M., Olofsen H., et. al.: Fully automatic segmentation of white matter hyperintensities in MR images of the elderly. NeuroImage 2005; 28: pp. 607-617.
46. Yu S., Pham D.L., Shen D., et. al.: Automatic segmentation of white matter lesions in T1-weighted brain MR images. IEEE International Symposium on Biomedical Imaging; Macro to Nano. 2001; pp. 253-256.
47. Anbeek P., Vincken K.L., van Bochove G.S., et. al.: Probabilistic segmentation of brain tissue in MR imaging. NeuroImage 2005; 27: pp. 795-804.
48. Gerig G., Welti D., Guttmann C.R., et. al.: Exploring the discrimination power of the time domain for segmentation and characterization of lesions in serial MR data. Med Image Anal 2000; 4: pp. 31-42.
49. Meier D.S., Guttmann C.R.G.: MRI time series modeling of MS lesion development. NeuroImage 2006; 32: pp. 531-537.
50. Jack C.R.J., O’Brien P.C.: FLAIR histogram segmentation for measurement of leukoaraiosis volume. J Magn Res Imaging 2001; 14: pp. 668-676.
51. Mohamed F.B., Vinitski S., Gonzalez C.F., et. al.: Increased differentiation of intracranial white matter lesions by multispectral 3D-tissue segmentation: preliminary results. Magn Reson Imaging 2001; 19: pp. 207-218.
52. Viola P., Wells W.M.: Alignment by maximization of mutual information.1995. Los Alamitos, CA
53. Smith S.M., Jenkinson M., Woolrich M.W., et. al.: Advances in functional and structural MR image analysis and implementation as FSL. NeuroImage 2004; 23: pp. 208-219.
54. Smith S.M.: Fast robust automated brain extraction. Human Brain Mapping 2002; 17: pp. 143-155.
55. Sled J., Zijdenbos A., Evans A.: A nonparametric method for automatic correction of intensity nonuniformity in MRI data. IEEE Trans Med Imaging 1998; 17: pp. 87-97.
56. Gawne-Cain M.L., O’Riordan J.I., Coles A., et. al.: MRI lesion volume measurement in multiple sclerosis and its correlation with disability: a comparison of fast fluid attenuated inversion recovery (fFLAIR) and spin echo sequences. J Neurol Neurosurg Psychiatry 1998; 64: pp. 197-203.
57. Bastianello S., Bozzao A., Paolillo A., et. al.: Fast spin-echo and fast fluid-attenuated inversion-recovery versus conventional spin-echo sequences for MR quantification of multiple sclerosis lesions. Am J Neuroradiol 1997; 18: pp. 699-704.
58. Rovaris M., Comi G., Rocca M.A., et. al.: Relevance of hypointense lesions on fast fluid-attenuated inversion recovery MR images as a marker of disease severity in cases of multiple sclerosis. Am J Neuroradiol 1999; 20: pp. 813-820.
59. Bakshi R., Caruthers S.D., Janardhan V., et. al.: Intraventricular CSF pulsation artifact on fast fluid-attenuated inversion-recovery MR images: analysis of 100 consecutive normal studies. Am J Neuroradiol 2000; 21: pp. 503-508.
60. Tanaka N., Abe T., Kojima K., et. al.: Applicability and advantages of flow artifact–insensitive fluid-attenuated inversion-recovery MR sequences for imaging the posterior fossa. Am J Neuroradiol 2000; 21: pp. 1095-1098.
61. Vapnik V.N.: Statistical learning theory.1998.WileyNew York, NY
62. Vapnik V.N.: The nature of statistical learning theory (statistics for engineering and information science).2nd ed.1999.Springer-VerlagNew York, NY
63. Burges C.J.C.: A tutorial on support vector machines for pattern recognition. Data Mining Knowledge Discovery 1998; 2: pp. 121-167.
64. Vapnik V.N.: Statistical learning theory.1998.WileyNew York, NY
65. Lao Z., Shen D., Xue Z., et. al.: Morphological classification of brains via high-dimensional shape transformations and machine learning methods. Neuroimage 2004; 21: pp. 46-57.
66. Duda R.O., Hart P.E., Stork D.G.: Pattern classification.2001.John Wiley and Sons, IncNew York, NY
67. Zweig M.H., Campbell G.: Receiver-operating characteristic (ROC) plots: a fundamental evaluation tool in clinical medicine. Clin Chem 1993; 39: pp. 561-577.