
Rationale and Objectives
To conduct a preclinical evaluation of the robustness of our computerized system for breast lesion characterization on two breast magnetic resonance imaging (MRI) databases that were acquired using scanners from two different manufacturers.
Materials and Methods
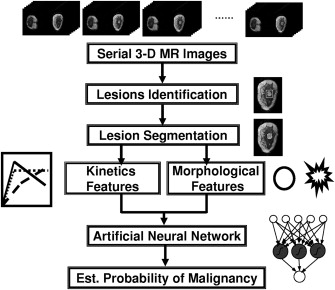
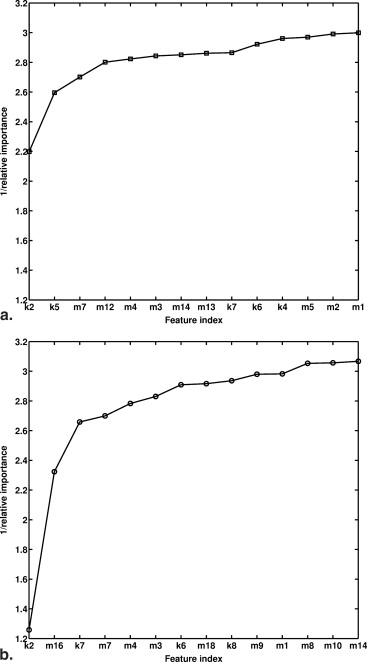
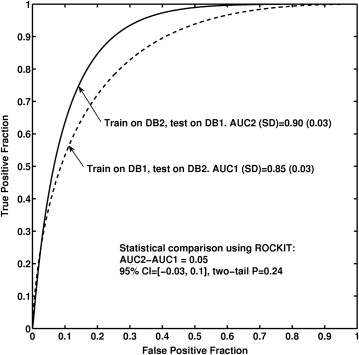
Two clinical breast MRI databases were acquired from a Siemens scanner and a GE scanner, which shared similar imaging protocols and retrospectively collected under an institutional review board–approved protocol. In our computerized analysis system, after a breast lesion is identified by the radiologist, the computer performs automatic lesion segmentation and feature extraction and outputs an estimated probability of malignancy. We used a Bayesian neural network with automatic relevance determination for joint feature selection and classification. To evaluate the robustness of our classification system, we first used Database 1 for feature selection and classifier training, and Database 2 to test the trained classifier. Then, we exchanged the two datasets and repeated the process. Area under the receiver operating characteristic curve (AUC) was used as a performance figure of merit in the task of distinguishing between malignant and benign lesions.
Results
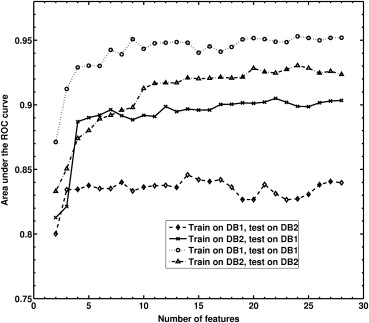
We obtained an AUC of 0.85 (approximate 95% confidence interval [CI] 0.79–0.91) for (a) feature selection and classifier training using Database 1 and testing on Database 2; and an AUC of 0.90 (approximate 95% CI 0.84–0.96) for (b) feature selection and classifier training using Database 2 and testing on Database 1. We failed to observe statistical significance for the difference AUC of 0.05 between the two database conditions ( P = .24; 95% confidence interval -0.03, 0.1).
Conclusion
These results demonstrate the robustness of our computerized classification system in the task of distinguishing between malignant and benign breast lesions on dynamic contrast-enhanced (DCE) MRI images from two manufacturers. Our study showed the feasibility of developing a computerized classification system that is robust across different scanners.
Magnetic resonance imaging (MRI) is being increasingly used in clinical practice for the detection and characterization of breast cancer . The American College of Radiology Imaging Network Trial 6667 Investigators Group has recently reported that MRI can detect cancer that is missed by mammography and clinical examination at the time of the initial breast cancer diagnosis . In 2007, the American Cancer Society published guidelines for breast screening with MRI as an adjunct to mammography in high-risk women. The expanding clinical applications of breast MRI call for developments of advanced computer tools to assist the radiologists in image interpretation and patient workup. First, computer-aided analysis may improve diagnostic accuracy as well as reduce intra- and inter-observer variability as it does in traditional modalities : there is evidence that computerized analysis of breast MRIs complements clinical reading . Furthermore, a typical breast MRI study acquires a substantial amount of four-dimensional data, and navigation and interpretation of these large datasets is time-consuming and even challenging for radiologists . These reasons have motivated us to investigate computerized techniques for breast MRI analysis .
Historically, researchers and clinicians started performing breast MRI at the two ends of the spectrum of imaging techniques: one used high temporal resolution techniques attempting to distinguish between benign and malignant lesions by enhancement characteristics (called the “dynamic school” in a review by Kuhl et al) , whereas another (called the “static school”) used high spatial resolution techniques attempting to distinguish between benign and malignant lesions by characteristic morphological features. This disparity was mainly from technical limitations and tradeoffs between spatial and temporal resolution taken at different institutions. Correspondingly, computerized breast lesion characterization in MRIs has been an active area of research for many years and many of these studies have focused on some particular characteristic features of breast lesions on MRIs. Recent multicenter studies and clinical consensus have shown that both morphological and kinetic features are important and should be combined in breast MRI lesion characterization. Consensus has also been reached, in principle, that breast MRIs should be obtained with both fairly high spatial resolution and fairly high temporal resolution, which is achievable now because of technical progress in recent years . However, the image acquisition protocol for breast MRI is not yet standardized across manufacturers and institutions . This fact raises the question about the robustness of a computerized image analyses to different MRI scanners or acquisition parameters—a question that is insufficiently studied in the current literature.
Get Radiology Tree app to read full this article<
Materials and methods
Breast MRI Databases
Get Radiology Tree app to read full this article<
Table 1
Breast Magnetic Resonance Imaging Acquisition Protocols
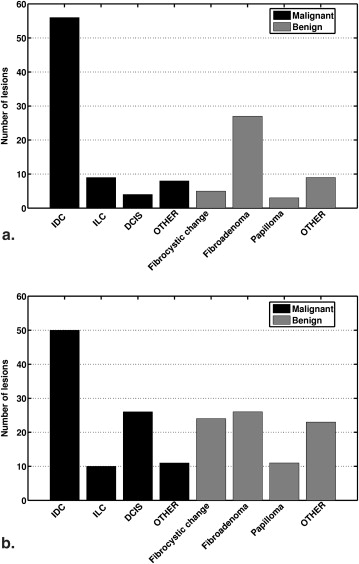
Database 1 Database 2 Scanner 1.5T Siemens vision 1.5T GE Medical system Sequence T1-weighted three-dimensional spoiled gradient echo sequence Repetition time 8.1 ms 7.7 ms Echo time 4 ms 4.2 ms Fat suppression No No Acquisition matrix 256 × 128 256 × 128 Temporal resolution 69 seconds 68 seconds Planar spatial resolution 1.25 mm × 1.25 mm 1.25 mm × 1.25 mm–1.6 mm × 1.6 mm Slice thickness 2–3 mm 3–4 mm View, number of slices Coronal, 64 slices Coronal, 60 slices Gadolinium DiethyleneTriamine Pentaacetic Acid (Gd-DTPA) dose 0.2 mmol/kg Fixed 20 mL of 0.5 mmol/mL Flow rate 2 mL/second Saline flush 20 mL Number of lesions 77 malignant, 44 benign 97 malignant, 84 benign
Get Radiology Tree app to read full this article<
Get Radiology Tree app to read full this article<
Get Radiology Tree app to read full this article<
Computerized Analysis of Breast Lesions on MRI images
Get Radiology Tree app to read full this article<
Get Radiology Tree app to read full this article<
Get Radiology Tree app to read full this article<
Get Radiology Tree app to read full this article<
Get Radiology Tree app to read full this article<
Get Radiology Tree app to read full this article<
Get Radiology Tree app to read full this article<
Get Radiology Tree app to read full this article<
Table 2
Summary of Computerized Features in the Classification of Breast Lesions on Dynamic Contrast-Enhanced Magnetic Resonance Imaging
Feature Description F k1 Max. enh. Maximum contrast enhancement – F k2 Time to peak Time frame at which the maximum enhancement occurs Small F k3 Uptake rate Uptake speed of the contrast enhancement Large F k4 Washout rate Washout speed of the contrast enhancement Large F k5 Curve shape index Difference between late and early enhancement Small F k6 Max. var. of enh. Maximum variance of contrast enhancement – F k7 Time to peak Time frame at which the maximum variance occurs Small F k8 Var. incr. rate Increasing speed of the enhancement-variance Large F k9 Var. dec. rate Decreasing speed of the enhancement-variance Large F m1 Energy Local image homogeneity Small F m2 Contrast Local image variations Large F m3 Correlation Image linearity Large F m4 Variance homogeneity How spread out the gray-level distribution is Large F m5 Inverse difference moment Local image homogeneity Small F m6 Sum average The overall brightness (average gray level) Large F m7 Sum variance How spread out the distribution of the sum of the gray levels of voxel-pairs is Large F m8 Sum entropy The randomness of the sum of gray levels of neighboring voxels Large F m9 Entropy The randomness of the gray levels Large F m10 Difference variance Variations of difference of gray levels between voxel-pairs Large F m11 Difference entropy The randomness of the difference of neighboring voxels’ gray levels Large F m12 IMC1 Nonlinear gray-level dependence Small F m13 IMC2 Nonlinear gray-level dependence Large F m14 Max corr. coeff Nonlinear gray-level dependence Large F m15 Circularity Similarity of lesion shape to an effective sphere Small F m16 Irregularity Deviation of three-dimensional lesion surface from a sphere surface Large F m17 Margin sharpness Mean of the image gradient at the lesion margin Small F m18 Var. of Margin sharpness Variance of the image gradient at the lesion margin Small F m19 Variance of RGH Indicates how well the enhancement structures in a VOI extend in a radial pattern originating from the center of the VOI Small
“small” (“large”): malignant lesions tend to have smaller (larger) feature values than do benign ones; “–”: failing to find significant difference of feature values between malignant and benign lesions; IMC, information measure of correlation; RGH, radial gradient histogram; VOI, volume of interest.
Get Radiology Tree app to read full this article<
Computerized Classification of Breast Lesions on MRIs
Get Radiology Tree app to read full this article<
Get Radiology Tree app to read full this article<
Get Radiology Tree app to read full this article<
Results
Get Radiology Tree app to read full this article<
Get Radiology Tree app to read full this article<
Get Radiology Tree app to read full this article<
Get Radiology Tree app to read full this article<
Get Radiology Tree app to read full this article<
Get Radiology Tree app to read full this article<
Discussion
Get Radiology Tree app to read full this article<
Get Radiology Tree app to read full this article<
Get Radiology Tree app to read full this article<
Get Radiology Tree app to read full this article<
Get Radiology Tree app to read full this article<
Get Radiology Tree app to read full this article<
Get Radiology Tree app to read full this article<
Get Radiology Tree app to read full this article<
Get Radiology Tree app to read full this article<
Get Radiology Tree app to read full this article<
Get Radiology Tree app to read full this article<
References
1. Kuhl C.K.: Current status of breast MR imaging. Part 1. Technical issues. Radiology 2007; 244: pp. 356-378.
2. Kuhl C.K.: Current status of breast MR imaging. Part 2. Clinical applications. Radiology 2007; 244: pp. 672-691.
3. Lehman C.D., Gatsonis C., Kuhl C.K., et. al.: ACRIN Trial 6667 Investigators Group. MRI evaluation of the contralateral breast in women with recently diagnosed breast cancer. N Engl J Med 2007; 356: pp. 1295-1303.
4. Saslow D., Boetes C., Burke W., et. al.: American Cancer Society Breast Cancer Advisory Group. American Cancer Society guidelines for breast screening with MRI as an adjunct to mammography. CA Cancer J Clin 2007; 57: pp. 75-89.
5. DeMartini W., Lehman C., Partridge S.: Breast MRI for cancer detection and characterization: a review of evidence-based clinical applications. Acad Radiol 2008; 15: pp. 408-416.
6. Eyal E., Degani H.: Model-based and model-free parametric analysis of breast dynamic-contrast-enhanced MRI. NMR Biomed 2009; 22: pp. 40.
7. Huo Z., Giger M.L., Vyborny C.J., et. al.: Breast cancer: effectiveness of computer-aided diagnosis observer study with independent database of mammograms. Radiology 2002; 224: pp. 560-568.
8. Chan H.P., Sahiner B., Helvie M.A., et. al.: Improvement of radiologists’ characterization of mammographic masses by using computer-aided diagnosis: an ROC study. Radiology 1999; 212: pp. 817-827.
9. Jiang Y., Nishikawa R.M., Schmidt R.A., et. al.: Improving breast cancer diagnosis with computer-aided diagnosis. Acad Radiol 1999; 6: pp. 22-33.
10. Jiang Y., Nishikawa R.M., Schmidt R.A., et. al.: Potential of computer-aided diagnosis to reduce variability in radiologists’ interpretations of mammograms depicting microcalcifications. Radiology 2001; 220: pp. 787-794.
11. Deurloo E.E., Muller S.H., Peterse J.L., et. al.: Clinically and mammographically occult breast lesions on MR images: potential effect of computerized assessment on clinical reading. Radiology 2005; 234: pp. 693-701.
12. Schnall M.D.: Clinical applications of image analysis and visualization for three dimensional breast imaging.Armato S.G.Brown M.S.Multidimensional image processing, analysis, and display: RSNA categorical course in diagnostic radiology physics.2005.RSNAOak Brook, IL:pp. 195-199.
13. Gilhuijs K.G.: Computer-supported analysis of breast MR imaging in four dimensions: why, when, and how.Armato S.G.Brown M.S.Multidimensional image processing, analysis, and display: RSNA categorical course in diagnostic radiology physics.2005.RSNAOak Brook, IL:pp. 201-213.
14. Chen W., Giger M.L., Lan L., et. al.: Computerized interpretation of breast MRI: investigation of enhancement-variance dynamics. Med Phys 2004; 31: pp. 1076-1082.
15. Chen W., Giger M.L., Bick U.: A fuzzy c-means (FCM) based approach for computerized segmentation of breast lesions in dynamic contrast-enhanced MR images. Acad Radiol 2006; 16: pp. 63-72.
16. Chen W., Giger M.L., Bick U., et. al.: Automatic identification and classification of characteristic kinetic curves of breast lesions on DCE-MRI. Med Phys 2006; 33: pp. 2878-2887.
17. Chen W., Giger M.L., Li H., Bick U., Newstead G.M.: Volumetric texture analysis of breast lesions on contrast-enhanced magnetic resonance images. Magn Reson Med 2007; 58: pp. 562-571.
18. Kuhl C.K., Schild H.H.: Dynamic image interpretation of MRI of the breast. J Magn Reson Imaging 2000; 12: pp. 965-974.
19. Hayton P., Brady M., Tarassenko L., et. al.: Analysis of dynamic MR breast images using a model of contrast enhancement. Med Image Anal 1997; 1: pp. 207-224.
20. Gilhuijs K.G., Giger M.L., Bick U.: Computerized analysis of breast lesions in three dimensions using dynamic magnetic-resonance imaging. Med Phys 1998; 25: pp. 1647-1654.
21. Penn A.I., Bolinger L., Schnall M.D., et. al.: Discrimination of MR images of breast masses with fractal-interpolation function models. Acad Radiol 1999; 6: pp. 156-163.
22. Lucht R.E., Knopp M.V., Brix G.: Classification of signal-time curves from dynamic MR mammography by neural networks. Magn Reson Imaging 2001; 19: pp. 51-57.
23. Gibbs P., Turnbull L.W.: Textural analysis of contrast-enhanced MR images of the breast. Magn Reson Med 2003; 50: pp. 92-98.
24. Szabó B.K., Wiberg M.K., Boné B., et. al.: Application of artificial neural networks to the analysis of dynamic MR imaging features of the breast. Eur Radiol 2004; 14: pp. 1217-1225.
25. Twellmann T., Lichte O., Nattkemper T.W.: An adaptive tissue characterization network for model-free visualization of dynamic contrast-enhanced magnetic resonance image data. IEEE Trans Med Imag 2005; 24: pp. 1256-1266.
26. Penn A.I., Thompson S., Brem R., et. al.: Morphologic blooming in breast MRI as a characterization of margin for discriminating benign from malignant lesions. Acad Radiol 2006; 13: pp. 1344-1354.
27. Schmid V.J., Whitcher B., Padhani A.R., et. al.: Bayesian methods for pharmacokinetic models in dynamic contrast-enhanced magnetic resonance imaging. IEEE Trans Med Imaging 2006; 25: pp. 1627-1636.
28. Williams T.C., DeMartini W.B., Partridge S.C., et. al.: Breast MR imaging: computer-aided evaluation program for discriminating benign from malignant lesions. Radiology 2007; 244: pp. 94-103.
29. Meinel L.A., Stolpen A.H., Berbaum K.S., et. al.: Breast MRI lesion classification: Improved performance of human readers with a back propagation neural network computer-aided diagnosis (CAD) system. J Magn Reson Imaging 2007; 25: pp. 89-95.
30. Woods B.J., Clymer B.D., Kurc T., et. al.: Malignant-lesion segmentation using 4D co-occurrence texture analysis applied to dynamic contrast-enhanced magnetic resonance breast image data. J Magnet Reson Imaging 2007; 25: pp. 495-501.
31. Levman J., Leung T., Causer P., et. al.: Classification of dynamic contrast-enhanced magnetic resonance breast lesions by support vector machines. IEEE Trans Med Imaging 2008; 2: pp. 688-696.
32. Nie K., Chen J.H., Yu H.J., et. al.: Quantitative analysis of lesion morphology and texture features for diagnostic prediction in breast MRI. Acad Radiol 2008; 15: pp. 1513-1525.
33. McLaren C.E., Chen W.P., Nie K., et. al.: Prediction of malignant breast lesions from MRI features: a comparison of artificial neural network and logistic regression techniques. Acad Radiol 2009; 16: pp. 842-851.
34. Schnall M.D., Blume J., Bluemke D.A., et. al.: Diagnostic architectural and dynamic features at breast MR imaging: multicenter study. Radiology 2006; 238: pp. 42-53.
35. Ikeda D.M., Hylton N.M., Kinkel K., et. al.: Development, standardization, and testing of a lexicon for reporting contrast-enhanced breast magnetic resonance imaging studies. J. Magn Reson Imaging 2001; 13: pp. 889-895.
36. American College of Radiology. ACR BI-RADS: MRI. In ACR BIRADS: Breast Imaging Reporting and Data System: breast imaging atlas. Reston, VA, 2003.
37. MacKay DJS. Bayesian methods for adaptive models. PhD thesis, California Institute of Technology, Pasadena, CA, 1992.
38. Neal R.M.: Bayesian learning for neural networks. Lecture notes in statistics.1996.Springer-VerlagNew York
39. Bishop C.M.: Neural networks for pattern recognition.1995.Oxford University PressOxford, UK
40. Nabney T.: Netlab: algorithms for pattern recognition.2002.SpringerLondon, UK
41. Chen W., Zur R.M., Giger M.L.: Joint feature selection and classification using a Bayesian neural network with “automatic relevance determination” priors: potential use in CAD of medical imaging. Proc SPIE, Med Imaging 2007; Comp-aided Diagnosis 6514, 65141G
42. Metz C.E., Herman B.A., Shen J.H.: Maximum likelihood estimation of receiver operating characteristic (ROC) curves from continuously-distributed data. Stat Med 1998; 17: pp. 1033-1053.
43. Metz C.E.: Quantification of failure to demonstrate statistical significance: the usefulness of confidence intervals. Invest Radiol 1993; 28: pp. 59-63.
44. Jansen S.A., Shimauchi A., Zak L., et. al.: Kinetic curves of malignant lesions are not consistent across MR systems: the need for improved standardization of breast dynamic contrast-enhanced MRI acquisitions. AJR Am J Roentgenol 2009; 193: pp. 832-839.
45. Barrett H.H., Myers K.J.: Foundations of image science.2003.Wiley-InterscienceHoboken, NJ
46. Kaiser W.A., Zeitler E.: MR imaging of the breast: fast imaging sequence with and without Gd-DTPA. Radiology 1989; 170: pp. 681-686.
47. Kupinski M.A., Giger M.L.: Feature selection with limited datasets. Med Phys 1999; 26: pp. 2176-2182.
48. Kupinski M.A., Edwards D.C., Giger M.L., et. al.: Ideal observer approximation using Bayesian classification neural networks. IEEE Trans Med Imaging 2001; 20: pp. 886-899.
49. Cook N.R.: Use and misuse of the receiver operating characteristic curve in risk prediction. Circulation 2007; 115: pp. 928-935.
50. Horsch K., Giger M.L., Metz C.E.: Prevalence scaling: applications to an intelligent workstation for the diagnosis of breast cancer. Acad Radiol 2008; 15: pp. 1446-1457.