
Rationale and Objectives
Assessment of the breast tissue pattern asymmetry depicted on bilateral mammograms is routinely used by radiologists when reading and interpreting mammograms. The purpose of this study is to develop an automated scheme to detect breast tissue asymmetry depicted on bilateral mammograms and use the computed asymmetric features to predict the likelihood (or the risk) of women having or developing breast abnormalities or cancer.
Materials and Methods
A testing dataset was selected from a large and diverse full-field digital mammography image database, which includes 100 randomly selected negative cases (not recalled during the screening) and 100 positive cases for having or developing breast abnormalities or cancer. Among these positive cases 40 were recalled (biopsy) because of suspicious findings in which 8 were determined as high risk with the lesions surgically removed and the remaining were proven to be benign, and 60 cases were acquired from examinations that were interpreted as negative (without dominant masses or microcalcifications) but the cancers were detected 6–18 months later. A computerized scheme was developed to detect asymmetry of mammographic tissue density represented by the related feature differences computed from bilateral images. Initially, each of 20 features was tested to classify between the positive and the negative cases. To further improve the classification performance, a genetic algorithm (GA) was applied to select a set of optimal features and build an artificial neural network (ANN). The leave-one-case-out validation method was used to evaluate the ANN classification performance.
Results
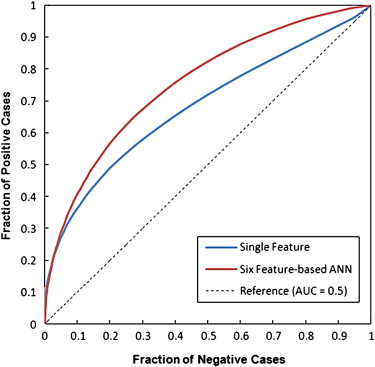
Using a single feature, the maximum classification performance level measured by the area under the receiver operating characteristic curve (AUC) was 0.681 ± 0.038. Using the GA-optimized ANN, the classification performance level increased to an AUC = 0.754 ± 0.024. At 90% specificity, the ANN classifier yielded 42% sensitivity, in which 42 positive cases were correctly identified. Among them, 30 were the “prior” examinations of the cancer cases and 12 were recalled benign cases, which represent 50% and 30% sensitivity levels in these two subgroups, respectively.
Conclusions
This study demonstrated that using the computerized detected feature differences related to the bilateral mammographic breast tissue asymmetry, an automated scheme is able to classify a set of testing cases into the two groups of positive or negative of having or developing breast abnormalities or cancer. Hence, further development and optimization of this automated method may eventually help radiologists identify a fraction of women at high risk of developing breast cancer and ultimately detect cancer at an early stage.
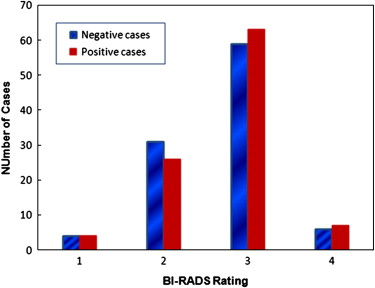
Mammographic breast tissue density has been widely considered as a useful risk indicator of women having or developing breast abnormalities and cancer . Several models have been developed to describe and classify mammographic breast tissue density, including the Wolfe model that classifies mammographic parenchymal patterns into four categories (N1, P1, P2, and DY) based on the radiographic appearance of prominent ducts and dysplasia . The American College of Radiology has established a Breast Imaging Reporting and Data System (BI-RADS) as the current standard in breast tissue density reporting . Thus, in clinical practice, radiologists rate and classify breast tissue composition or density into one of four BI-RADS categories based on the ratio of fibroglandular tissue to the total breast areas. The four BI-RADS categories are: 1) almost entirely fatty (<25% fibroglandular), 2) scattered fibroglandular densities (25%–50% fibroglandular), 3) heterogeneously dense breast tissue (51%–75% fibroglandular), and 4) extremely dense breast tissue (>75% fibroglandular). Based on the visual assessment of breast tissue density, several studies have been performed to investigate the relationship between reported breast tissue density BI-RADS rating and the likelihood of developing breast cancer. The studies reported that, in general, women with dense breast tissue had a higher risk of developing breast cancer . Despite the great efforts made in these laboratory based studies, using visual assessment results to predict risk of developing cancer is difficult and often unreliable in the clinical practice due to the considerable inter- and intra-observer variability in the visual assessment of breast tissue density (ie, BI-RADS) .
To overcome the limitation of visual assessment of breast tissue, several research groups developed and tested different computerized schemes to segment and compute breast tissue density or patterns depicted on mammograms . Many of these studies reported high correlation with the average visual assessment or consensus rating of a group of radiologists in segmenting or rating dense breast tissue using computerized schemes. For examples, one study used an adaptively determined threshold method that was based on the image characteristic of the gray level histogram to segment dense tissue from the breast areas and compared the automatically segmented results with the average results of manual segmentation of five radiologists. The study reported that in a dataset with four-view mammograms acquired from 65 women, the correlation between the automated and the manual segmentation of dense tissue was 0.94 and 0.91 for craniocaudal (CC) and mediolateral oblique views, respectively . Another study applied a computerized scheme to compute eight image texture-based features and derived a computerized index that attempted to mimic the radiologists’ BI-RADS rating of breast tissue composition. The study reported that in a dataset of 200 mammograms, the correlation between the computerized index and the average rating of three radiologists was 0.87, which was also comparable to the correlations of individually provided ratings between these radiologists . In addition, another previous study demonstrated high correlation (0.9) between breast tissue density levels estimated from mammograms and magnetic resonance images.
Get Radiology Tree app to read full this article<
Get Radiology Tree app to read full this article<
Materials and methods
A Testing Image Dataset
Get Radiology Tree app to read full this article<
Get Radiology Tree app to read full this article<
Table 1
Distribution of 100 Positive Cases in the Testing Dataset
Number of Cases Type of Cases “Current” or “Prior” Examination 39 Cancer Prior 21 Interval cancer Prior 8 High risk with surgery excision Current 32 Recalled negative Current
Get Radiology Tree app to read full this article<
Computation and Assessment of Image Features to Measure Asymmetry of Breast Tissue
Get Radiology Tree app to read full this article<
Get Radiology Tree app to read full this article<
Get Radiology Tree app to read full this article<
Get Radiology Tree app to read full this article<
g(t)=∑(x,y)∈R[|I(x,y)−I(x+t,y)|+|I(x,y)−I(x−t,y)|+|I(x,y)−I(x,y+t)|+|I(x,y)−I(x,y−t)|] g
(
t
)
=
∑
(
x
,
y
)
∈
R
[
|
I
(
x
,
y
)
−
I
(
x
+
t
,
y
)
|
+
|
I
(
x
,
y
)
−
I
(
x
−
t
,
y
)
|
+
|
I
(
x
,
y
)
−
I
(
x
,
y
+
t
)
|
+
|
I
(
x
,
y
)
−
I
(
x
,
y
−
t
)
|
]
where t is the distance in the number of pixels and g is the gradient. Feature 10 is defined as the slope estimated by fitting a straight line to the log(g(t)) log
(
g
(
t
)
) versus log(t) log
(
t
) .
Get Radiology Tree app to read full this article<
Get Radiology Tree app to read full this article<
Get Radiology Tree app to read full this article<
Get Radiology Tree app to read full this article<
Get Radiology Tree app to read full this article<
Optimization and Evaluation of a Multifeature-based Artificial Neural Network
Get Radiology Tree app to read full this article<
Get Radiology Tree app to read full this article<
Get Radiology Tree app to read full this article<
Results
Get Radiology Tree app to read full this article<
![Figure 2, The distribution of the performance levels (the areas under receiver operating characteristic [ROC] curves and the standard deviations) when applying each of 20 features to classify 200 testing cases into the two groups of positive and negative of having or developing breast abnormalities or cancer.](https://storage.googleapis.com/dl.dentistrykey.com/clinical/ComputerizedDetectionofBreastTissueAsymmetryDepictedonBilateralMammograms/1_1s20S1076633210002953.jpg)
Table 2
Comparison of Classification Performance Levels (the Areas under the ROC Curves) of Using Four Sets of 20 Features
Feature Type Average AUC Standard Deviation Number of AUC ≥0.6 Number of AUC ≤0.5 Left breast 0.495 0.059 1 12 Right breast 0.505 0.058 1 9 Average of two breasts 0.505 0.066 1 10 Bilateral differences 0.590 0.051 8 1
AUC, area under the curve; ROC, receiver operating characteristic.
Computed from (1) the mammograms of left breast, (2) the mammo-grams of right breast, (3) average of the results from the left and right breasts, and (4) bilateral difference.
Get Radiology Tree app to read full this article<
Get Radiology Tree app to read full this article<
Table 3
The Correlation Coefficients among Six Features Selected to Train the ANN-based Classifier
Feature 4 Feature 8 Feature 11 Feature 12 Feature 13 Feature 1 0.047 0.210 0.146 0.248 0.158 Feature 4 0.063 0.200 0.204 0.034 Feature 8 0.164 0.145 0.205 Feature 11 0.158 0.055 Feature 12 0.116
ANN, artificial neural network.
Get Radiology Tree app to read full this article<
Get Radiology Tree app to read full this article<
Table 4
The Actual Number of Positive Cases Correctly Identified (Sensitivity Levels) at Different Specificity Levels when Applying the ANN to Classify the Dataset with 100 Positive and 100 Negative Cases
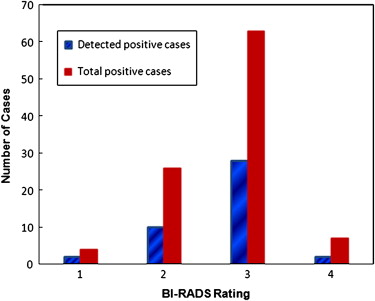
Specificity 95% 90% 85% 80% Sensitivity on all 100 positive cases 34 (34.0%) 42 (42.0%) 44 (44.0%) 51 (51.0%) Sensitivity on 39 cancer cases 14 (35.9%) 17 (43.6%) 18 (46.2%) 20 (51.3%) Sensitivity on 21 interval cancer cases 12 (57.1%) 13 (61.9%) 13 (61.9%) 15 (71.4%) Sensitivity on 8 high-risk cases (surgery excision) 2 (25.0%) 4 (50.0%) 4 (50.0%) 5 (62.5%) Sensitivity on 32 recalled negative cases 6 (18.8%) 8 (25.0%) 9 (28.1%) 11 (34.4%)
ANN, artificial neural network.
Get Radiology Tree app to read full this article<
Discussion
Get Radiology Tree app to read full this article<
Get Radiology Tree app to read full this article<
Get Radiology Tree app to read full this article<
Get Radiology Tree app to read full this article<
Get Radiology Tree app to read full this article<
Get Radiology Tree app to read full this article<
Get Radiology Tree app to read full this article<
References
1. Wolfe J.N.: Breast patterns as an index of risk for developing breast cancer. Am J Roentgenol AJR 1976; 126: pp. 1130-1139.
2. Boyd N.F., Martin I.J., Stone J., et. al.: Mammographic densities as a marker of human breast cancer risk and their use in chemoprevention. Curr Oncol Rep 2001; 3: pp. 314-321.
3. BI-RADS Breast Imaging Reporting and Data System Breast Imaging Atlas.2003.American College of RadiologyReston, VA
4. Wolfe J.N., Saftlas A.F., Salane M.: Mammographic parenchymal patterns and quantitative evaluation of mammographic densities: a case-control study. Am J Roentgenol AJR 1987; 148: pp. 1087-1092.
5. Byng J.W., Yaffe M.J., Lockwood L.E., et. al.: Automated analysis of mammographic densities and breast carcinoma risk. Cancer 1997; 80: pp. 66-74.
6. Brisson J., Diorio C., Masse B.: Wolfe’s parenchymal pattern and percentage of the breast with mammographic densities: redundant or complementary classifications?. Cancer Epidemiol Biomarkers Prev 2003; 12: pp. 728-732.
7. Boyd N.F., Guo H., Martin L.J., et. al.: Mammographic density and the risk and detection of breast cancer. N Engl J Med 2007; 356: pp. 227-236.
8. Berg W.A., Campassi C., Langenberg P., et. al.: Breast imaging reporting and data system: inter- and intra-observer variability in feature analysis and final assessment. Am J Roentgenol AJR 2000; 174: pp. 1769-1777.
9. Taboces P.G., Correa J., Souto M., et. al.: Computer-assisted diagnosis: the classification of mammographic breast parenchymal patterns. Phys Med Biol 1995; 40: pp. 103-117.
10. Zhou C., Chan H.P., Petrick N., et. al.: Computerized image analysis: estimation of breast density on mammograms. Med Phys 2001; 28: pp. 1056-1069.
11. Chang Y.H., Wang X.H., Hardesty L.A., et. al.: Computerized assessment of tissue composition on digitized mammograms. Acad Radiol 2002; 9: pp. 898-905.
12. Wang X.H., Good W.F., Chapman B.E., et. al.: Automated assessment of composition of breast tissue revealed on tissue-thickness-corrected mammography. Am J Roentgenol AJR 2003; 180: pp. 257-262.
13. Wei J., Chan H.P., Helvie M.A., et. al.: Correlation between mammographic density and volumetric fibroglandular tissue estimated on breast MR images. Med Phys 2004; 31: pp. 933-942.
14. Li H., Giger M.L., Olopade O.I., et. al.: Computerized texture analysis of mammographic parenchymal patterns of digitized mammograms. Acad Radiol 2005; 12: pp. 863-873.
15. Glide-Hurst C.K., Duric N., Littrup P.: A new method for quantitative analysis of mammographic density. Med Phys 2007; 34: pp. 4491-4498.
16. Huo Z., Giger M.L., Olopade O.I., et. al.: Computerized analysis of digitized mammograms of BRCA1 and BRCA2 gene mutation carriers. Radiology 2002; 225: pp. 519-526.
17. Li H., Giger M.L., Olopade O.I., et. al.: Fractal analysis of mammographic parenchymal patterns in breast cancer risk assessment. Acad Radiol 2007; 14: pp. 513-521.
18. Li H., Giger M.L., Olopade O.I., et. al.: Power spectral analysis of mammographic parenchymal patterns for breast cancer risk assessment. J Digital Imaging 2008; 21: pp. 145-152.
19. Haralick R.M., Shapiro L.G.: Computer and robot vision.1992.Addison-WesleyReading, MA
20. Metz CE, ROCKIT 0.9B betaversion. University of Chicago. Available online at: http://www-radiology.uchicago.edu/krl/ , 1998.
21. Kantrowitz M.: Prime time freeware for AI, issue 1-1: selected materials from the Carnegie Mellon University, Artificial Intelligence Repository.1994.Prime Time FreewareSunnyvale, CA
22. Li Q., Doi K.: Reduction of bias and variance for evaluation of computer-aided diagnostic schemes. Med Phys 2006; 33: pp. 868-875.
23. Hand W., Semmlow J.L., Ackerman L.V., et. al.: Computer screening of xeromammograms: a technique for defining suspicious areas of the breast. Comput Biomed Res 1979; 12: pp. 445-460.
24. Yin F.F., Giger M.L., Doi K., et. al.: Computerized detection of masses in digital mammograms: analysis of bilateral subtraction images. Med Phys 1991; 18: pp. 955-963.
25. Zheng B., Chang Y.H., Gur D.: Computerized detection of masses from digitized mammograms: comparison of single-image segmentation and bilateral-image subtraction. Acad Radiol 1995; 2: pp. 1056-1061.
26. Mendez A.J., Tahoces P.G., Lado M.J., et. al.: Computer-aided diagnosis: automatic detection of malignant masses in digitized mammograms. Med Phys 1998; 25: pp. 957-964.
27. Nishikawa R.M.: Current status and future directions of computer-aided diagnosis in mammography. Comput Med Imaging Graph 2007; 31: pp. 224-235.
28. Fenton J.J., Taplin S.H., Carney P.A., et. al.: Influence of computer-aided detection on performance of screening mammography. N Engl J Med 2007; 356: pp. 1399-1409.
29. Stojadinovic A., Nissan A., Shriver C.D., et. al.: Electrical impedance scanning as a new breast cancer risk stratification tool for young women. J Surg Oncol 2008; 97: pp. 112-120.