
Rationale and Objectives
We have been developing a computer-aided diagnostic (CAD) scheme for lung nodule detection in order to assist radiologists in the detection of lung cancer in thin-section computed tomography (CT) images.
Materials and Methods
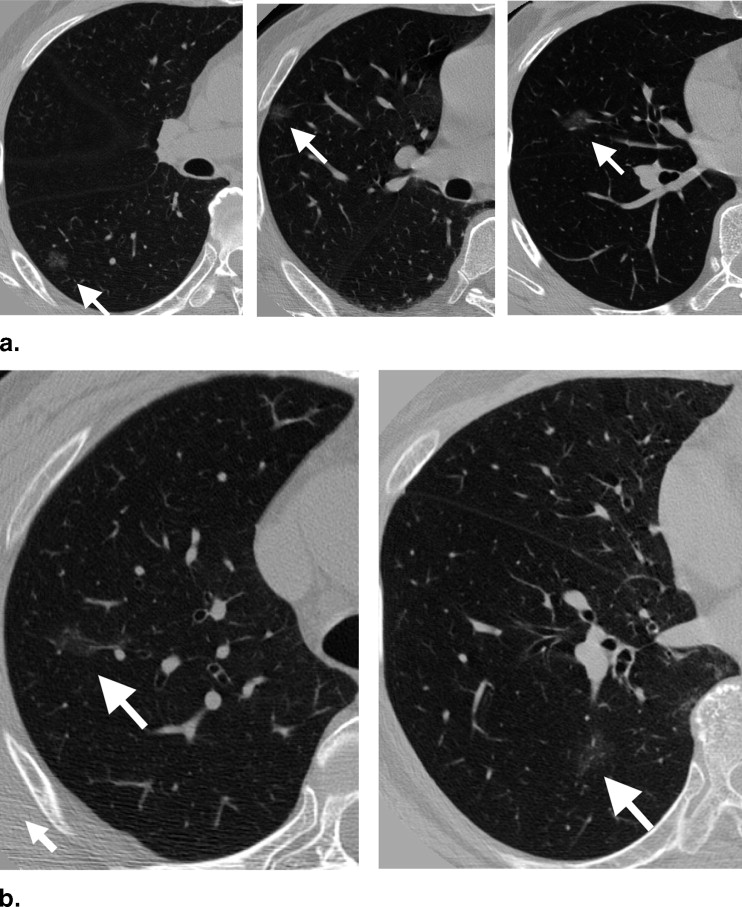
Our database consisted of 117 thin-section CT scans with 153 nodules, obtained from a lung cancer screening program at a Japanese university (85 scans, 91 nodules) and from clinical work at an American university (32 scans, 62 nodules). The database included nodules of different sizes (4–28 mm, mean 10.2 mm), shapes, and patterns (solid and ground-glass opacity (GGO)). Our CAD scheme consisted of modules for lung segmentation, selective nodule enhancement, initial nodule detection, feature extraction, and classification. The selective nodule enhancement filter was a key technique for significant enhancement of nodules and suppression of normal anatomic structures such as blood vessels, which are the main sources of false positives. Use of an automated rule-based classifier for reduction of false positives was another key technique; it resulted in a minimized overtraining effect and an improved classification performance. We used a case-based four-fold cross-validation testing method for evaluation of the performance levels of our computerized detection scheme.
Results
Our CAD scheme achieved an overall sensitivity of 86% (small: 76%, medium-sized: 94%, large: 95%; solid: 86%, mixed GGO: 89%, pure GGO: 81%) with 6.6 false positives per scan; an overall sensitivity of 81% (small: 69%, medium-sized: 91%, large: 91%; solid: 79%, mixed GGO: 88%, pure GGO: 81%) with 3.3 false positives per scan; and an overall sensitivity of 75% (small: 60%, medium-sized: 88%, large: 87%; solid: 70%, mixed GGO: 87%, pure GGO: 81%) with 1.6 false positives per scan.
Conclusion
The experimental results indicate that our CAD scheme with its two key techniques can achieve a relatively high performance for nodules presenting large variations in size, shape, and pattern.
Lung cancer is the leading cause of deaths among all types of cancer in the United States ( ). The number of deaths it causes is greater than the total number of deaths resulting from colon cancer, breast cancer, and prostate cancer combined. Some evidence suggests that early detection of lung cancer may allow for timely therapeutic intervention, which in turn results in a more favorable prognosis for the patients. Therefore, screening programs for early detection of lung cancer have been attempted in the United States and Japan by use of computed tomography (CT) ( ). In a screening program with CT, radiologists must read a large number of images, and they are likely to overlook some lung cancers. Therefore, a computer-aided diagnostic (CAD) scheme for nodule detection ( ), which provides radiologists with the locations of nodule candidates, would be particularly useful for reduction of detection errors in the early detection of cancer in thoracic CT scans.
CAD schemes for lung nodule detection were developed first for chest radiographs ( ) and then for thick-section CT images ( ). The typical performance of current CAD schemes in thick-section CT is an 80–90% sensitivity with one or two false positives per section, which translates into tens of false positives per CT scan. The majority of false positives are caused by blood vessels and other normal anatomic structures ( ). Because of the relatively large section thickness (5–10 mm), CAD schemes for nodule detection in thick-section CT generally detect nodules on a section-by-section basis. Because most of the processing steps, such as nodule segmentation and feature extraction, are performed on two-dimensional (2D) section images, they are considered to be 2D.
Get Radiology Tree app to read full this article<
Get Radiology Tree app to read full this article<
Materials and methods
Materials
Get Radiology Tree app to read full this article<
Get Radiology Tree app to read full this article<
Get Radiology Tree app to read full this article<
Get Radiology Tree app to read full this article<
Get Radiology Tree app to read full this article<
Methods
Overall Scheme of Our Computerized Detection Technique
Get Radiology Tree app to read full this article<
Get Radiology Tree app to read full this article<
Lung Segmentation
Get Radiology Tree app to read full this article<
Get Radiology Tree app to read full this article<
Get Radiology Tree app to read full this article<
Image Enhancement by Use of Three Selective Filters
Get Radiology Tree app to read full this article<
Get Radiology Tree app to read full this article<
Initial Identification and Region Growing of Nodule Candidates
Get Radiology Tree app to read full this article<
Get Radiology Tree app to read full this article<
Feature Determination
Get Radiology Tree app to read full this article<
Get Radiology Tree app to read full this article<
Get Radiology Tree app to read full this article<
False-Positive Reduction by Use of an Automated Rule-Based Classifier
Get Radiology Tree app to read full this article<
Get Radiology Tree app to read full this article<
Get Radiology Tree app to read full this article<
Get Radiology Tree app to read full this article<
Evaluation of the CAD Scheme for Nodule Detection
Get Radiology Tree app to read full this article<
Get Radiology Tree app to read full this article<
Results
Results of Initial Nodule Detection
Get Radiology Tree app to read full this article<
Get Radiology Tree app to read full this article<
Results of Final Nodule Detection
Get Radiology Tree app to read full this article<
Get Radiology Tree app to read full this article<
Get Radiology Tree app to read full this article<
Get Radiology Tree app to read full this article<
Get Radiology Tree app to read full this article<
Get Radiology Tree app to read full this article<
Get Radiology Tree app to read full this article<
Get Radiology Tree app to read full this article<
Get Radiology Tree app to read full this article<
Table 1
Means ± Standard Deviations of Sensitivities and False-Positive Rates per Case for Different Groups of Nodules at Four Operating Points, Obtained with Ten Trials of the Four-Fold Case-Based Cross-Validation Method. The Number Below the Title of Each Column Indicates the Number of Nodules in a Specific Nodule Group
Operating Points Sensitivities (%) for Different Groups of Nodules FP Rates per Case All (n = 153) Small (n = 68) Medium-Sized (n = 52) Large (n = 33) Solid (n = 101) Mixed GGO (n = 36) Pure GGO (n = 16) 1 75.4 ± 1.6 60.4 ± 2.3 87.5 ± 2.6 87.2 ± 3.1 70.3 ± 2.5 86.9 ± 1.3 81.3 ± 0 1.6 ± 0.2 2 81.3 ± 1.6 69.0 ± 2.4 91.3 ± 1.6 90.9 ± 2.3 78.9 ± 2.2 88.1 ± 1.3 81.3 ± 0 3.3 ± 0.3 3 86.0 ± 1.5 75.5 ± 3.0 94.0 ± 1.9 94.7 ± 2.1 85.5 ± 2.0 89.4 ± 1.2 81.3 ± 0 6.6 ± 0.4 4 92.3 ± 1.6 87.8 ± 3.7 96.2 ± 0.0 95.3 ± 1.6 93.4 ± 2.1 93.9 ± 1.2 81.3 ± 0 19.2 ± 1.7
Get Radiology Tree app to read full this article<
Discussion
Get Radiology Tree app to read full this article<
Get Radiology Tree app to read full this article<
Get Radiology Tree app to read full this article<
Get Radiology Tree app to read full this article<
Get Radiology Tree app to read full this article<
Conclusion
Get Radiology Tree app to read full this article<
Appendix
Get Radiology Tree app to read full this article<
Appendix
Optimal rule-based classifier based on linear composite features
Input: A training dataset including N nodules and a design sensitivity S to be achieved. Output: A list of rules based on composite features.
Get Radiology Tree app to read full this article<
Get Radiology Tree app to read full this article<
References
1. Greenlee R.T., Murray T., Bolden S., Wingo P.A.: Cancer statistics, 2000. CA Cancer J Clin 2000; 50: pp. 7-33.
2. Sone S., Takashima S., Li F., et. al.: Mass screening for lung cancer with mobile spiral computed tomography scanner. Lancet 1998; 351: pp. 242-245.
3. Henschke C.I., McCauley D.I., Yankelevitz D.F., et. al.: Early Lung Cancer Action Project: Overall design and findings from baseline screening. Lancet 1999; 354: pp. 99-105.
4. Doi K.: Overview on research and development of computer-aided diagnostic schemes. Semin Ultrasound CT MRI 2004; 25: pp. 404-410.
5. Li Q., Li F., Suzuki K., et. al.: Computer-aided diagnosis in thoracic CT. Semin US CT MRI 2005; 26: pp. 357-363.
6. Giger M.L., Doi K., MacMahon H.: Image feature analysis and computer-aided diagnosis in digital radiography. Med Phys 1988; 15: pp. 158-166.
7. Giger M.L., Bae K.T., MacMahon H.: Computerized detection of pulmonary nodules in CT images. Invest Radiol 1994; 29: pp. 459-465.
8. Reeves A.P., Koitis W.J.: Computer-aided diagnosis of small pulmonary nodules. Semin Ultrasound CT MRI 2000; 21: pp. 116-128.
9. Ko J.P., Betke M.: Chest CT: Automated nodule detection and assessment of change over time: preliminary experience. Radiology 2001; 218: pp. 267-273.
10. Lee Y., Hara T., Fujita H., Itoh S., Ishigaki T.: Automated detection of pulmonary nodules in helical CT images based on an improved template-matching technique. IEEE Trans Med Imag 2001; 20: pp. 595-604.
11. Brown M.S., McNitt-Gary M.F., Goldin J.G., Suh R.D., Sayre J.W., Aberle D.R.: Patient specific models for lung nodule detection and surveillance in CT images. IEEE Trans Med Imag 2001; 20: pp. 1242-1250.
12. Gurcan M.N., Sahiner B., Petrick N., Chan H.P., Kazerooni E.A., Cascade P.N., Hadjiiski L.: Lung nodule detection on thoracic computed tomography images: Preliminary evaluation of a computer-aided diagnosis system. Med Phys 2002; 29: pp. 2552-2558.
13. Wormanns D., Fiebich M., Saidi M., Diederich S., Heindel W.: Automatic detection of pulmonary nodules at spiral CT: Clinical application of a computer-aided diagnosis system. Eur Radiol 2002; 12: pp. 1052-1057.
14. Li F., Novak C., Qian J., Kohl G., Naidich D.P.: Automatic detection of lung nodules from multi-slice low-dose CT images. Proc SPIE Med Imag 2001; 4322: pp. 1828-1835.
15. Wiemker R., Rogalla P., Zwartkruis A., Blaffert T.: Computer aided lung nodule detection on high resolution CT data. Proc SPIE Med Imag 2002; 4684: pp. 677-688.
16. Lawler L.P., Wood S.A., Pannu H.S., Fishman E.K.: Computer-assisted detection of pulmonary nodules: Preliminary observations using a prototype system with multidetector-row CT data sets. J Digit Imag 2003; 16: pp. 251-261.
17. Brown M.S., Goldin J.G., Suh R.D., McNitt-Gary M.F., Sayre J.W., Aberle D.R.: Lung micronodules: Automated method for detection at thin-section CT—initial experience. Radiology 2003; 226: pp. 256-262.
18. Zhao B., Gamsu G., Ginsberg M.S., Jiang L., Schwarts L.H.: Automatic detection of small lung nodules on CT utilizing a local density maximum algorithm. J Appl Clin Med Phys 2003; 4: pp. 248-260.
19. McCulloch C.C., Kaucic R.A., Mendonca P.R.S., Walter D.J., Avila R.S.: Model-based detection of lung nodules in computed tomography exams. Acad Radiol 2004; 11: pp. 258-266.
20. Paik D.S., Beaulieu C.F., Rubin G.D., et. al.: Surface normal overlap: A computer-aided detection algorithm with application to colonic polyps and lung nodules in helical CT. IEEE Trans Med Imag 2004; 23: pp. 661-675.
21. Bae K.T., Kim J.S., Na Y.H., Kim K.G., Kim J.H.: Pulmonary nodules: Automated detection on CT images with morphologic matching algorithm—Preliminary results. Radiology 2005; 236: pp. 286-294.
22. Ge Z.Y., Sahiner B., Chan H.-P., et. al.: Computer-aided detection of lung nodules: False positive reduction using a 3D gradient field method and 3D ellipsoid fitting. Med Phys 2005; 32: pp. 2443-2454.
23. Li Q., Sone S., Doi K.: Selective enhancement filters for nodules, vessels, and airway walls in two- and three-dimensional CT scans. Med Phys 2003; 30: pp. 2040-2051.
24. Li Q., Doi K.: Analysis and minimization of overtraining effect in rule-based classifiers for computer-aided diagnosis. Med Phys 2006; 33: pp. 320-328.
25. Henschke C.I., Yankelevitz D.F., Naidich D.P., et. al.: CT screening for lung cancer: Suspiciousness of nodules according to size on baseline scans. Radiology 2004; 231: pp. 164-168.
26. Thirion J.P., Gourdon A.: Computing the differential characteristics of isointensity surfaces. Comput Vision Image Understanding 1995; 61: pp. 190-202.
27. Markey M.K., Lo J.Y., Tourassi G.D., Floyd C.E.: Self-organizing map for cluster analysis of a breast cancer database. Artif Intell Med 2003; 27: pp. 113-127.
28. Yoshida H., Masutani Y., MacEneaney P., Rubin D.T., Dachman A.H.: Computerized detection of colonic polyps at CT colonography on the basis of volumetric features: Pilot study. Radiology 2002; 222: pp. 327-336.
29. Shao S., Grams R.R.: A proposed computer diagnostic system for malignant melanoma (CDSMM). J Med Syst 1994; 18: pp. 85-96.
30. Hedan B., Ohlin H., Rittner R., Edenbrandt L.: Acute myocardial infarction detected in the 12-lead ECG by artificial neural networks. Circulation 1997; 96: pp. 1798-1802.
31. Robutti F., Betta P.G., Donna A., Pavesi M.: A morphometrically-based classification rule for the diagnosis of primary mesothelial lesions. J Pathol 1990; 162: pp. 57-60.
32. Pietka E.: Computer-assisted bone age assessment based on features automatically extracted from a hand radiograph. Comput Med Imaging Graph 1995; 19: pp. 251-259.
33. Aoyama M., Li Q., Katsuragawa S., Doi K.: Automated computerized scheme for distinction between benign and malignant solitary pulmonary nodules on chest images. Med Phys 2002; 29: pp. 701-708.
34. Aoyama M., Li Q., Katsuragawa S., Li F., Sone S., Doi K.: Computerized scheme for determination of the likelihood measure of malignancy for pulmonary nodules on low-dose CT images. Med Phys 2003; 30: pp. 387-394.
35. Loew M.: Feature extraction.Sonka M.Fitzpatrick J.M.2000.SPIE PressBellingham, WA:pp. 273-338.
36. Metz C.E.: Some practical issues of experimental design and data analysis in radiological ROC studies. Invest Radiol 1989; 24: pp. 234-245.