
Rationale and Objectives
Multidirectional phase-contrast magnetic resonance imaging allows the acquisition of time-resolved velocity fields (vectors) of cardiac and vascular blood flow. Its unique ability to provide vectorial flow information promises to give new insights into hemodynamic physiology. However, up to now appropriate and standardized procedures and software tools are missing to take advantage of all the information contained in the data. The objective of this work is to present a new versatile software tool and to demonstrate its practical value for the examination of multidirectional blood flow.
Materials and Methods
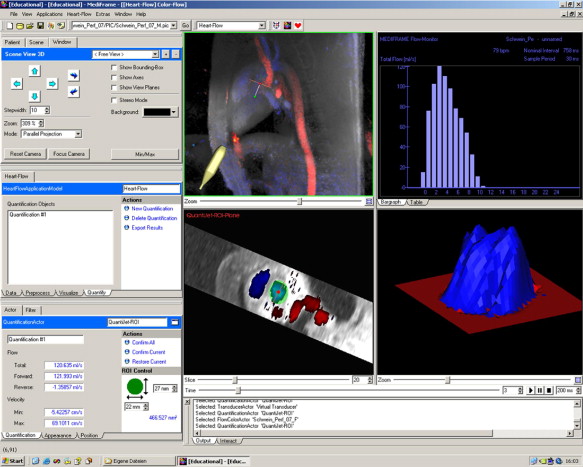
An exemplary selection of data sets from healthy volunteers, patients with cardiovascular pathologies, and healthy domestic pigs has been acquired using a phase-contrast magnetic resonance imaging sequence based on FLASH (fast low angle shot) that encodes velocity as field of three-dimensional vectors. For data processing, we have developed a software tool that integrates the whole workflow, including noise filtering, interactive visualization, and flow quantification.
Results
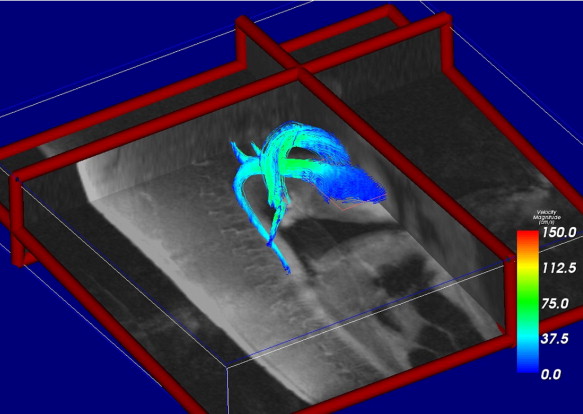
Using the software tool visualization of complex flow data is easily generated within 5 minutes; interactive exploration of the data is possible in real-time. Exemplary physiologic and pathologic flow patterns were visualized in an intuitive manner. The visual results suggest valuable diagnostic information; its significance, however, must be further evaluated together with the development of more specific data processing.
Conclusions
Multidirectional phase-contrast magnetic resonance imaging is a valuable tool for assessment of cardiac and vascular hemodynamics. With the development of tools that offer standardized and thus comparable visualizations it may be integrated into the clinical routine in the near future.
Phase-contrast flow measurements in magnetic resonance imaging (pc-MRI) are widely used to noninvasively assess hemodynamics. Most often the technique is used to quantify blood flow orthogonal to an imaging slice ( ). It has been demonstrated to yield high precision and reproducibility ( ), but the measurement is limited to one axis. To acquire the entire three-directional (3D) flow (ie, velocity vectors), this technique can be enhanced by additional velocity encoding gradients. Then, acquiring a time-resolved stack of slices or a 3D volume, respectively, velocity maps and particle paths can be calculated inside major vessels being covered.
Although one-directional flow measurements can be postprocessed with commercially available software, no software exists for multidirectional pc-MRI. This lack impedes the use of the data in clinical routine, because it is difficult to interpret visually. There is no commonly accepted application in the radiologic practice. Besides, relatively long acquisition times are considered to be a major limitation. With the development of appropriate software tools appreciation of the data might increase, and new applications for the examination of all vascular pathologies, in pretreatment screening as well as for postoperative follow-up, might be defined.
Get Radiology Tree app to read full this article<
Get Radiology Tree app to read full this article<
Material and methods
Data
Get Radiology Tree app to read full this article<
Get Radiology Tree app to read full this article<
m(x,y,z,t)=mv⃗ (x,y,z,t)=(vxvyvz)T m
(
x
,
y
,
z
,
t
)
=
m
v
⃗
(
x
,
y
,
z
,
t
)
=
(
v
x
v
y
v
z
)
T
Get Radiology Tree app to read full this article<
Get Radiology Tree app to read full this article<
Get Radiology Tree app to read full this article<
Software Tool
Get Radiology Tree app to read full this article<
Get Radiology Tree app to read full this article<
Get Radiology Tree app to read full this article<
Preprocessing
Get Radiology Tree app to read full this article<
Get Radiology Tree app to read full this article<
Get Radiology Tree app to read full this article<
c(v⃗ 1,v⃗ 2)=v⃗ 1⋅v⃗ 2∥v⃗ 1∥⋅∥v⃗ 2∥ c
(
v
⃗
1
,
v
⃗
2
)
=
v
⃗
1
⋅
v
⃗
2
‖
v
⃗
1
‖
⋅
‖
v
⃗
2
‖
Get Radiology Tree app to read full this article<
Get Radiology Tree app to read full this article<
Get Radiology Tree app to read full this article<
dcm(x,y,z)=10052(25+∑1u=−1∑1v=−1∑1w=−1c(v⃗ (x,y,z),v⃗ (x+u,y+v,z+w))) d
c
m
(
x
,
y
,
z
)
=
100
52
(
25
+
∑
u
=
−
1
1
∑
v
=
−
1
1
∑
w
=
−
1
1
c
(
v
⃗
(
x
,
y
,
z
)
,
v
⃗
(
x
+
u
,
y
+
v
,
z
+
w
)
)
)
Get Radiology Tree app to read full this article<
Get Radiology Tree app to read full this article<
Get Radiology Tree app to read full this article<
Visualization Techniques
Get Radiology Tree app to read full this article<
Probing tool
Get Radiology Tree app to read full this article<
Get Radiology Tree app to read full this article<
Get Radiology Tree app to read full this article<
Virtual echocardiography
Get Radiology Tree app to read full this article<
Get Radiology Tree app to read full this article<
Vector flow visualization
Get Radiology Tree app to read full this article<
Get Radiology Tree app to read full this article<
Get Radiology Tree app to read full this article<
x⃗ i=x⃗ i−1+v⃗ (x⃗ i−1)Δτ,i=1,2,… x
⃗
i
=
x
⃗
i
−
1
+
v
⃗
(
x
⃗
i
−
1
)
Δ
τ
,
i
=
1
,
2
,
…
where Δτ Δ
τ denotes an infinitesimal time step.
Get Radiology Tree app to read full this article<
Get Radiology Tree app to read full this article<
Get Radiology Tree app to read full this article<
Quantification
Get Radiology Tree app to read full this article<
Q=∑Pv⃗ ⋅n⃗ PdP. Q
=
∑
P
v
⃗
⋅
n
⃗
P
d
P
.
Get Radiology Tree app to read full this article<
Get Radiology Tree app to read full this article<
Get Radiology Tree app to read full this article<
Results
Get Radiology Tree app to read full this article<
Get Radiology Tree app to read full this article<
Get Radiology Tree app to read full this article<
Get Radiology Tree app to read full this article<
Get Radiology Tree app to read full this article<
Get Radiology Tree app to read full this article<
Get Radiology Tree app to read full this article<
Get Radiology Tree app to read full this article<
Get Radiology Tree app to read full this article<
Get Radiology Tree app to read full this article<
Get Radiology Tree app to read full this article<
Get Radiology Tree app to read full this article<
Get Radiology Tree app to read full this article<
Get Radiology Tree app to read full this article<
Discussion
Get Radiology Tree app to read full this article<
Get Radiology Tree app to read full this article<
Get Radiology Tree app to read full this article<
Get Radiology Tree app to read full this article<
Get Radiology Tree app to read full this article<
Get Radiology Tree app to read full this article<
Get Radiology Tree app to read full this article<
Get Radiology Tree app to read full this article<
Get Radiology Tree app to read full this article<
Get Radiology Tree app to read full this article<
Get Radiology Tree app to read full this article<
Acknowledgment
Get Radiology Tree app to read full this article<
References
1. Bryant D.J., Payne J.A., Firmin D.N., et. al.: Measurement of flow with NMR imaging using a gradient pulse and phase difference technique. J Comput Assist Tomogr 1984; 8: pp. 588-593.
2. Lotz J., Meier C., Leppert A., et. al.: Cardiovascular flow measurement with phase-contrast MR imaging: basic facts and implementation. Radiographics 2002; 22: pp. 651-671.
3. Ley S., Ley-Zaporozhan J., Kreitner K.F., et. al.: MR flow measurements for assessment of the pulmonary, systemic and bronchosystemic circulation: impact of different ECG gating methods and breathing schema. Eur J Radiol 2007; 61: pp. 124-129.
4. Foo T.K.F., Bernstein M.A., Aisen A.M., et. al.: Improved ejection fraction and flow velocity estimates with use of view sharing and uniform repetition time excitation with fast cardiac techniques. Radiology 1995; 195: pp. 471-478.
5. Bogren H.G., Buonocore M.H.: Complex flow patterns in the great vessels: a review. Int J Card Imaging 1999; 15: pp. 105-113.
6. Bogren H.G., Buonocore M.H.: 4D magnetic resonance velocity mapping of blood flow patterns in the aorta in young vs. elderly normal subjects. J Magn Reson Imaging 1999; 10: pp. 861-869.
7. Isoda H., Hirano M., Takeda H., et. al.: Visualization of hemodynamics in a silicon aneurysm model using time-resolved, 3D, phase-contrast MRI. AJNR Am J Neuroradiol 2006; 27: pp. 1119-1122.
8. Markl M., Draney M.T., Hope M.D., et. al.: Time-resolved 3-dimensional velocity mapping in the thoracic aorta: visualization of 3-directional blood flow patterns in healthy volunteers and patients. J Comput Assist Tomogr 2004; 28: pp. 459-468.
9. Seifert S., Burgert O., Dillmann R.: MEDIFRAME—an extendable software framework for medical applications. Surgetica 2002; pp. 224-231.
10. (2006)Unterhinninghofen R., Ley S., Zaporozhan J., et. al.: A versatile tool for flow analysis in 3D-phase-contrast magnetic resonance imaging. Int J CARS 2006; 1: pp. 111-113.
11. Nayak K.S., Hu B.S.: Triggered real-time MRI and cardiac applications. Magn Reson Med 2003; 49: pp. 188-192.
12. Unterhinninghofen R., Albers J., Hosch W., et. al.: Multidimensional interactive colour-coding in velocity encoded magnetic resonance images of mitral insufficiency. Surgetica 2005; pp. 329-332.
13. Eichhorn J.G., Fink C., Delorme S., et. al.: Magnetic resonance blood flow measurements in the follow-up of pediatric patients with aortic coarctation—a re-evaluation. Int J Cardiol 2006; 113: pp. 91-298.