
Rationale and Objectives
American College of Radiology guidelines suggest that digital screening mammographic images should be viewed at the full resolution at which they were acquired. This slows interpretation speed. The aim of this study was to examine the effect of various levels of zooming on the detection and conspicuity of microcalcifications.
Materials and Methods
Six radiologists viewed 40 mammographic images five times in different random orders using five different levels of zooming: full resolution (100%) and 30%, 61%, 88%, and 126% of that size. Thirty-three images contained microcalcifications varying in subtlety, all associated with breast cancer. The clusters were circled. Seven images contained no malignant calcifications but also had randomly placed circles. The radiologists graded the presence or absence and visual conspicuity of any calcifications compared to calcifications in a reference image. They also counted the microcalcifications.
Results
The radiologists saw the microcalcifications in 94% of the images at 30% size and in either 99% or 100% of the other tested levels of zooming. Conspicuity ratings were worst for the 30% size and fairly similar for the others. Using the 30% size, two radiologists failed to see the microcalcifications on either the craniocaudal or mediolateral oblique view taken from one patient. Interobserver agreement regarding the number of calcifications was lowest for the 30% images and second lowest for the 100% images.
Conclusions
Images at 30% size should not be relied on alone for systematic scanning for microcalcifications. The other four levels of magnification all performed well enough to warrant further testing.
In 2007 the American College of Radiology promulgated recommendations that all digital screening mammograms should be viewed at the full resolution at which they were acquired. To do this, images must be zoomed so that they are physically larger than the area of the 5-megapixel monitors on which they are typically viewed. This zooming contributes to a near doubling of the time needed to interpret digital screening mammograms compared to film-screen screening mammograms . That increase in interpretation time may contribute to a relatively slow penetration of digital imaging into mammography, compared to its acceptance in other areas of radiology. We have studied the effect of varying degrees of image zooming on the visual conspicuity of microcalcifications present on digital screening mammograms to determine the contribution of zooming to the detection of microcalcifications and to guide our choice of levels of zooming to be tested in a subsequent trial. Eventually, we intend to study the effect of zooming on the detection of other signs of breast cancer, particularly masses. Because malignant microcalcifications are often small and subtle, any degradation of resolution caused by rebinning might have a greater impact on their detection than on the detection of masses. Therefore, we have first tested microcalcifications.
Materials and methods
This study was granted exemption by our institutional review board. The requirement for informed consent regarding patients whose images were used as part of the study was waived. Verbal consent to participate was deemed adequate for radiologists who agreed to take part as readers.
Get Radiology Tree app to read full this article<
Get Radiology Tree app to read full this article<
Get Radiology Tree app to read full this article<
Get Radiology Tree app to read full this article<
Get Radiology Tree app to read full this article<
Get Radiology Tree app to read full this article<
Get Radiology Tree app to read full this article<
Get Radiology Tree app to read full this article<
Get Radiology Tree app to read full this article<
Get Radiology Tree app to read full this article<
Get Radiology Tree app to read full this article<
Get Radiology Tree app to read full this article<
Get Radiology Tree app to read full this article<
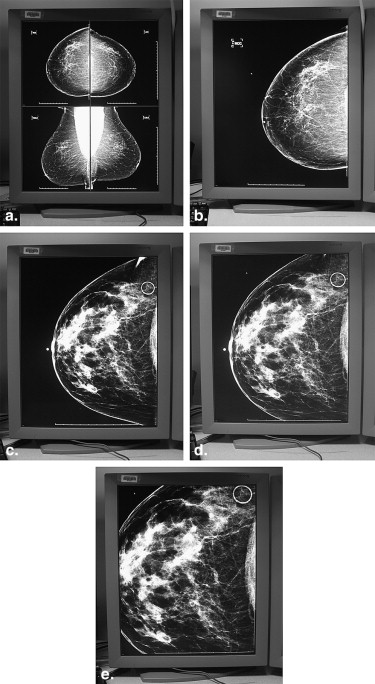
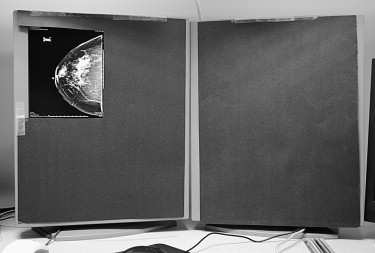
Setting for the Experiment
Get Radiology Tree app to read full this article<
Get Radiology Tree app to read full this article<
Get Radiology Tree app to read full this article<
Get Radiology Tree app to read full this article<
Scoring
Get Radiology Tree app to read full this article<
Get Radiology Tree app to read full this article<
Statistical Analysis
Get Radiology Tree app to read full this article<
Get Radiology Tree app to read full this article<
Results
Sensitivity
Get Radiology Tree app to read full this article<
Specificity
Get Radiology Tree app to read full this article<
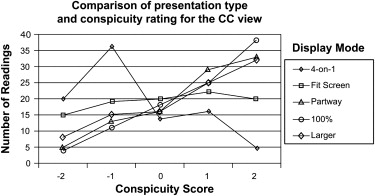
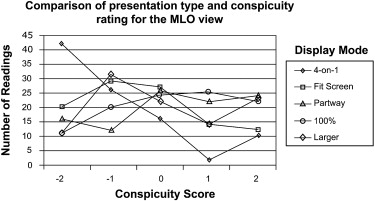
Conspicuity
Get Radiology Tree app to read full this article<
Get Radiology Tree app to read full this article<
Get Radiology Tree app to read full this article<
Table 1
Conspicuity of Microcalcifications for Each of the 10 Pairs of Display Modes That Were Compared
Display Mode Four on One Fit Screen Partway 100% Resolution Slightly Larger Craniocaudal Four on one <.0001 <.0001 <.0001 <.0001 Fit screen <.0001 <.0001 <.0001 Partway .6442 .2616 100% resolution .0167 Slightly larger Mediolateral oblique Four on one <.0001 <.0001 <.0001 <.0001 Fit screen <.0001 <.0001 <.0001 Partway .0122 .0003 100% resolution .0075 Slightly larger
To allow for the several variables, such as differing readers, Bonferroni’s adjustment was used. This meant that the cutoff for significance was P < .005 rather than the more usual cutoff of P < .05.
Get Radiology Tree app to read full this article<
Number of Calcifications
Get Radiology Tree app to read full this article<
Table 2
Interreader Agreement Regarding the Number of Calcifications Comparing Readings for Each Display Mode, with Responses Cut Off Between More Than 10 and All Other Responses
Display mode Craniocaudal Mediolateral Oblique Four on one 0.24 0.21 Fit screen 0.68 0.67 Partway 0.64 0.65 100% resolution 0.55 0.56 Slightly larger 0.66 0.61
Table 3
Interreader Agreement Regarding the Number of Calcifications Comparing Readings for Each Display Mode, with Response Cut Off Between 5 and 6 to 10
Display mode Craniocaudal Mediolateral Oblique Four on one 0.28 0.29 Fit screen 0.62 0.60 Partway 0.67 0.46 100% resolution 0.40 0.58 Slightly larger 0.59 0.47
Get Radiology Tree app to read full this article<
Discussion
Get Radiology Tree app to read full this article<
Get Radiology Tree app to read full this article<
Get Radiology Tree app to read full this article<
Get Radiology Tree app to read full this article<
Get Radiology Tree app to read full this article<
Get Radiology Tree app to read full this article<
Get Radiology Tree app to read full this article<
Get Radiology Tree app to read full this article<
Get Radiology Tree app to read full this article<
Get Radiology Tree app to read full this article<
Get Radiology Tree app to read full this article<
Get Radiology Tree app to read full this article<
Get Radiology Tree app to read full this article<
References
1. American College of Radiology. Practice guideline for determinants of image quality in digital mammography. Available at: http://www.acr.org/SecondaryMainMenuCategories/quality_safety/guidelines/breast/image_quality_digital_mammo.aspx . Accessed August 27, 2008.
2. Berns E.A., Hendrick R.E., Solari M., et. al.: Digital and screen-film mammography: comparison of image acquisition and interpretation times. AJR Am J Roentgenol 2006; 187: pp. 38-41.
3. Haygood T.M., Wang J., Atkinson E.N., et. al.: Timed efficiency of digital and film-screen screening mammographic interpretation. AJR Am J Roentgenol 2009; 192: pp. 216-220.
4. Landis J.R., Koch G.G.: The measurement of observer agreement for categorical data. Biometrics 1977; 33: pp. 159-174.
5. Pisano E.D., Cole E.B., Kistner E.O., et. al.: Interpretation of digital mammograms: comparison of speed and accuracy of soft-copy versus printed-film display. Radiology 2002; 223: pp. 483-488.
6. Cole E., Pisano E.D., Brown M., et. al.: Diagnostic accuracy of Fischer Senoscan digital mammography versus screen-film mammography in a diagnostic mammography population. Acad Radiol 2004; 11: pp. 879-886.
7. Lewin J.M., D’Orsi C.J., Hendrick R.E., et. al.: Clinical comparison of full-field digital mammography and screen-film mammography for detection of breast cancer. AJR Am J Roentgenol 2002; 179: pp. 671-677.
8. Skaane P., Young K., Skjennald A.: Population-based mammography screening: comparison of screen-film and full-field digital mammography with soft-copy reading—Oslo I study. Radiology 2003; 229: pp. 877-884.
9. Skaane P., Skjennald A.: Screen-film mammography versus full-field digital mammography with soft-copy reading: randomized trial in a population-based screening program—the Oslo II study. Radiology 2004; 232: pp. 197-204.
10. Hermann K.P., Obenauer S., Funke M., et. al.: Magnification mammography: a comparison of full-field digital mammography and screen-film mammography for the detection of simulated small masses and microcalcifications. Eur J Radiol 2002; 12: pp. 2188-2191.
11. Pisano E.D., Hendrick R.E., Yaffe M.J., et. al.: Diagnostic accuracy of digital versus film mammography: exploratory analysis of selected population subgroups in DMIST. Radiology 2008; 246: pp. 376-383.
12. Skaane P., Hofvind S., Skjennald A.: Randomized trial of screen-film versus full-field digital mammography with soft-copy reading in population-based screening program: follow-up and final results of Oslo II study. Radiology 2007; 244: pp. 708-717.
13. Del Turco M.R., Mantellini P., Ciatto S., et. al.: Full-field digital versus screen-film mammography: comparative accuracy in concurrent screening cohorts. AJR Am J Roentgenol 2007; 189: pp. 860-866.
14. Haygood T.M., Wang J., Lane D., et. al.: Why does it take longer to read digital than film-screen screening mammograms? A partial explanation. J Digit Imaging 2009 Feb 13; [Epub ahead of print]
15. Krupinski E.A., Roehrig H., Dallas W., et. al.: Differential use of image enhancement techniques by experienced and inexperienced observers. J Digit Imaging 2005; 18: pp. 311-315.
16. Hendrick R.E., Cole E.B., Pisano E.D., et. al.: Accuracy of soft-copy digital mammography versus that of screen-film mammography according to digital manufacturer: ACRIN DMIST retrospective multireader study. Radiology 2008; 247: pp. 38-48.
17. Kim H.H., Pisano E.D., Cole E.B., et. al.: Comparison of calcification specificity in digital mammography using soft-copy display versus screen-film mammography. AJR Am J Roentgenol 2006; 187: pp. 47-50.
18. Nodine C.F., Mello-Thoms C., Kundel H.L., et. al.: Time course of perception and decision making during mammographic interpretation. AJR Am J Roentgenol 2002; 179: pp. 917-923.
19. Oestmann J.W., Greene R., Bourgouin P.M., et. al.: Chest “gestalt” and detectability of lung lesions. Eur J Radiol 1993; 16: pp. 154-157.
20. Kundel H.L., Nodine C.F., Krupinski E.A., et. al.: Using gaze-tracking data and mixture distribution analysis to support a holistic model for the detection of cancers on mammograms. Acad Radiol 2008; 15: pp. 881-886.
21. Zuley M.L., Willison K.M., Bonaccio E., et. al.: Full-field digital mammography on LCD versus CRT monitors. AJR Am J Roentgenol 2006; 187: pp. 1492-1498.
22. Kim H.S., Han B.K., Choo K.S., et. al.: Screen-film mammography and soft-copy full-field digital mammography: comparison in the patients with microcalcifications. Korean J Radiol 2005; 6: pp. 214-220.
23. Taylor P.M.: A review of research into the development of radiologic expertise: Implications for computer-based training. Acad Radiol 2007; 14: pp. 1252-1263.
24. Mello-Thoms C., Hardesty L., Sumkin J., et. al.: Effects of lesion conspicuity on visual search in mammogram reading. Acad Radiol 2005; 12: pp. 830-840.
25. Saunders R.S., Sameu E.: The effect of breast compression on mass conspicuity in digital mammography. Med Phys 2008; 35: pp. 4464-4473.
26. Chakraborty D.P.: Validation and statistical power comparison of methods for analyzing free-response observer performance studies. Acad Radiol 2008; 15: pp. 1554-1566.