
Rationale and Objectives
We aimed to compare the contrast enhancement between tumor and mammary-gland tissue to distinguish lesions in the super-early phase, during which minimal contrast media uptake is observed in mammary-gland tissue.
Materials and Methods
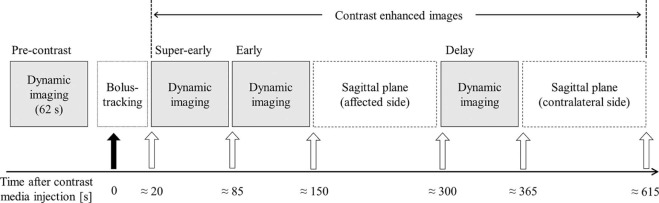
Dynamic magnetic resonance imaging, including the super-early phase with bolus tracking (BT) method (to determine the optimal imaging start time), was performed by using identical parameters to obtain transverse fat-suppressed T1-weighted images of both breasts. The percent enhancement (PE) and the contrast ratio (CR) indicators for tumor and mammary-gland tissue were assessed in each dynamic phase.
Results
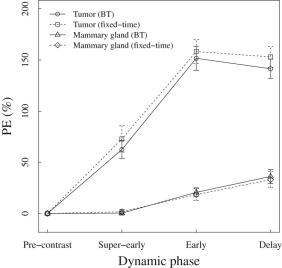
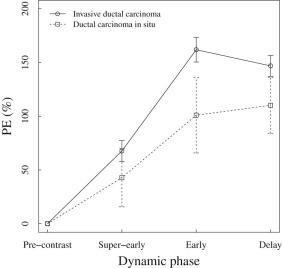
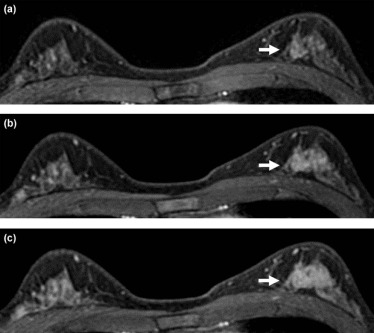
The PE values of the tumor were 62.4% and 151.6%, and those of the mammary gland were 0.3% and 20.7% in the super-early and early phases, respectively. Therefore, virtually no background parenchymal enhancement was observed in the super-early phase. The variation in the PE values during the super-early phase was significantly smaller when the values were determined with the BT method ( P < .05). The CR was highest in the early phase, and the CR in the super-early phase was lower than in the other phases. Early-phase PE and CR were significantly higher in invasive cancer cases than in noninvasive cancer cases ( P < .01). A significant difference in the imaging start time was observed for the anatomic side factor by the BT method.
Conclusion
Background parenchymal enhancement almost never appeared in the super-early phase, but the CR was lower in the super-early phase than in the early phase. The BT method allowed for an optimal imaging start time for the super-early phase and yielded images with less deviation of contrast enhancement.
Introduction
The increase in breast cancer-related morbidity has led to the widespread use of mammography, ultrasonography, and diagnostic imaging modalities in screenings and clinical examinations. Magnetic resonance imaging (MRI) is particularly considered useful for breast cancer examination. The American Cancer Society guidelines recommend MRI screening for patients with a lifetime breast cancer risk of >20% . High-field MRI facilitates higher resolution and faster imaging. When combined with the use of contrast media (CM), MRI can be used to detect breast cancer and examine its spread as well . The use of CM in MRI for breast cancer diagnosis is considered essential by many guidelines . In particular, dynamic MRI is recommended to differentiate benign from malignant tumors. For breast cancer, images are obtained at the early phase, wherein contrast enhancement peaks approximately 60–120 seconds after CM injection, and at the delay phase to confirm CM washout .
The menstrual cycle and other factors impact contrast enhancement in normal mammary-gland tissue . However, the number of contrast-enhanced breast MRI sessions that can be conducted daily is limited in some institutions; hence, it may not be possible to schedule examinations based on the menstrual cycle. In such cases, during conventional dynamic MRI, the CM is also taken up by mammary-gland tissue, sometimes even outside the menstrual cycle, which decreases the contrast with tumor tissue because of background parenchymal enhancement (BPE). Uematsu et al. reported that BPE negatively affects the detection, diagnosis, and staging of breast cancer . BPE is expected to be lower in the super-early phase because normal mammary-gland tissue becomes enhanced more slowly than tumors do . Based on this expectation, super-early-phase images would yield data that could assist in both the detection and diagnosis of breast cancer. Therefore, previous studies have attempted to improve the diagnostic capability of dynamic images by adding imaging during the super-early phase to the standard protocol .
Get Radiology Tree app to read full this article<
Materials and Methods
Subjects
Get Radiology Tree app to read full this article<
Get Radiology Tree app to read full this article<
Get Radiology Tree app to read full this article<
Imaging Sequences
Get Radiology Tree app to read full this article<
Table 1
Acquisition Parameters of Fat-Suppressed GRE 3D T1-Weighted Images for Dynamic Breast MRI
Parameters Values Field of view (mm) 330 × 330 Matrix size 400 × 320 TR/TE (ms) 3.42/1.79 Flip angle (degree) 10 Echo train length 33 NEX 1 Slice thickness/gap (mm) 1.8/−0.9 Phase encoding order Centric order Acceleration factor; R–L/H–F 2/1 Half scan factor; R–L/H–F 0.675/0.8 Shimming SmartExam Breast (Philips Healthcare, Amsterdam, The Netherlands) Time per phase (s) 62
GRE, gradient echo; H–F, head-foot; MRI, magnetic resonance imaging; NEX, number of excitations; R–L, right-left; TE, echo time; TR, repetition time.
Get Radiology Tree app to read full this article<
Contrast Imaging Protocol
Get Radiology Tree app to read full this article<
Get Radiology Tree app to read full this article<
Get Radiology Tree app to read full this article<
Comparisons of Contrast Values and Images
Get Radiology Tree app to read full this article<
PE=100×(SICE−SIpre)/SIpre[%] P
E
=
100
×
(
S
I
CE
−
S
I
pre
)
/
S
I
pre
[
%
]
CR=(SIt−SIm.g)/(SIt+SIm.g) C
R
=
(
S
I
t
−
S
I
m
.
g
)
/
(
S
I
t
+
S
I
m
.
g
)
Get Radiology Tree app to read full this article<
Get Radiology Tree app to read full this article<
Comparison of Contrast by Pathologic Type
Get Radiology Tree app to read full this article<
Analysis of the Imaging Start Time for the Super-Early Phase with the BT Method
Get Radiology Tree app to read full this article<
Statistical Analysis
Get Radiology Tree app to read full this article<
Results
PE
Get Radiology Tree app to read full this article<
Table 2
Background Characteristics of the Examined Patients in This Study
Characteristics Scanning Method Bolus Tracking Fixed-Time_P_ -Value Number of patients 62 50 Number of tumors 69 55 Mean age, years (SD) 55.3 (12.3) 55.3 (11.1) 0.991 Mean weight, kg (SD) 53.8 (8.1) 53.5 (9.0) 0.984
SD, standard deviation.
Get Radiology Tree app to read full this article<
Get Radiology Tree app to read full this article<
Table 3
Mean and Standard Deviation Values of PE During the Dynamic Phases, Obtained With the Bolus-Tracking and Fixed-Time Methods
Dynamic Phase Scanning Method_P_ -Value Bolus Tracking Fixed-Time Super-early Mean 62.4 72.8 0.189 SD 37.1 47.8 0.049 Early Mean 151.6 158.2 0.426 SD 48.6 43.1 0.366 Delay Mean 141.4 153.0 0.095 SD 38.9 37.5 0.775
SD, standard deviation.
The P -value for the mean and SD were calculated by Welch t test and F test, respectively.
Get Radiology Tree app to read full this article<
CR
Get Radiology Tree app to read full this article<
Comparison of Contrast Enhancement by Pathologic Type
Get Radiology Tree app to read full this article<
Table 4
Categorization of PE and CR According to Pathologic Type in the Different Dynamic Phases
Dynamic Phase Pathologic Type Number of Tumors PE CR Mean_t_ Test Mean_t_ Test Super-early IDC 54 67.7P = .054 0.29P = .064 DCIS 10 42.8 0.20 Early IDC 54 161.9P = .00018 0.41P = .0011 DCIS 10 101.0 0.30 Delay IDC 54 146.9P = .0047 0.33P = .34 DCIS 10 110.2 0.30
CR, contrast ratio; DCIS, ductal carcinoma in situ; IDC, invasive ductal carcinoma; PE, percent enhancement.
Get Radiology Tree app to read full this article<
Differences in the Imaging Start Time for the Super-Early Phase by the BT Method
Get Radiology Tree app to read full this article<
Discussion
Get Radiology Tree app to read full this article<
Get Radiology Tree app to read full this article<
Get Radiology Tree app to read full this article<
Get Radiology Tree app to read full this article<
Get Radiology Tree app to read full this article<
Get Radiology Tree app to read full this article<
Conclusions
Get Radiology Tree app to read full this article<
References
1. Saslow D., Boetes C., Burke W., et. al.: American Cancer Society guidelines for breast screening with MRI as an adjunct to mammography. CA Cancer J Clin 2007; 57: pp. 75-89.
2. Uematsu T., Yuen S., Kasami M., et. al.: Comparison of magnetic resonance imaging, multidetector row computed tomography, ultrasonography, and mammography for tumor extension of breast cancer. Breast Cancer Res Treat 2008; 112: pp. 461-474.
3. Orel S.G., Schnall M.D.: MR imaging of the breast for the detection, diagnosis, and staging of breast cancer. Radiology 2001; 220: pp. 13-30.
4. Heywang-Köbrunner S.H., Bick U., Bradley W.G., et. al.: International investigation of breast MRI: results of a multicentre study (11 sites) concerning diagnostic parameters for contrast-enhanced MRI based on 519 histopathologically correlated lesions. Eur Radiol 2001; 11: pp. 531-546.
5. Mann R.M., Kuhl C.K., Kinkel K., et. al.: Guidelines from the European Society of Breast Imaging. Eur Radiol 2008; 18: pp. 1307-1318.
6. American College of Radiology : ACR practice parameter for the performance of contrast-enhanced Magnetic Resonance Imaging (MRI) of the breast. Available at: http://www.acr.org/~/media/ACR/Documents/PGTS/guidelines/MRI_Breast.pdf Accessed December 7, 2015; Amended 2014
7. Nakajima Y., Okuda I., Tozaki M., et. al.: Guidelines for the optimal use of breast magnetic resonance imaging (MRI) for screening of breast cancer in high risk women, version 1.2. J Jpn Assoc Breast Cancer Screen 2013; 22: pp. 155-176.
8. Kaiser W.A., Zeitler E.: MR imaging of the breast: fast imaging sequences with and without Gd-DTPA. Preliminary observations. Radiology 1989; 170: pp. 681-686.
9. Kuhl C.K.: MRI of breast tumors. Eur Radiol 2000; 10: pp. 46-58.
10. Delille J.P., Slanetz P.J., Yeh E.D., et. al.: Physiologic changes in breast magnetic resonance imaging during the menstrual cycle: perfusion imaging, signal enhancement, and influence of the T1 relaxation time of breast tissue. Breast J 2005; 11: pp. 236-241.
11. Kuhl C.K., Bieling H.B., Gieseke J., et. al.: Healthy premenopausal breast parenchyma in dynamic contrast-enhanced MR imaging of the breast: normal contrast medium enhancement and cyclical-phase dependency. Radiology 1997; 203: pp. 137-144.
12. Müller-Schimpfle M., Ohmenhaüser K., Stoll P., et. al.: Menstrual cycle and age: influence on parenchymal contrast medium enhancement in MR imaging of the breast. Radiology 1997; 203: pp. 145-149.
13. Uematsu T., Kasami M., Watanabe J.: Does the degree of background enhancement in breast MRI affect the detection and staging of breast cancer?. Eur Radiol 2011; 21: pp. 2261-2267.
14. Uematsu T., Kasami M., Watanabe J.: Background enhancement of mammary glandular tissue on breast dynamic MRI: imaging features and effect on assessment of breast cancer extent. Breast Cancer 2012; 19: pp. 259-265.
15. Jansen S.A., Fan X., Medved M., et. al.: Characterizing early contrast uptake of ductal carcinoma in situ with high temporal resolution dynamic contrast-enhanced MRI of the breast: a pilot study. Phys Med Biol 2010; 55: pp. N473-N485.
16. Boetes C., Barentsz J.O., Mus R.D., et. al.: MR characterization of suspicious breast lesions with a gadolinium-enhanced TurboFLASH subtraction technique. Radiology 1994; 193: pp. 777-781.
17. Heiberg E.V., Perman W.H., Herrmann V.M., et. al.: Dynamic sequential 3D gadolinium-enhanced MRI of the whole breast. Magn Reson Imaging 1996; 14: pp. 337-348.
18. Jansen S.A., Newstead G.M., Abe H., et. al.: Pure ductal carcinoma in situ: kinetic and morphologic MR characteristics compared with mammographic appearance and nuclear grade. Radiology 2007; 245: pp. 684-691.
19. Lehman C.D.: Magnetic resonance imaging in the evaluation of ductal carcinoma in situ. J Natl Cancer Inst Monogr 2010; 2010: pp. 150-151.
20. Mann R.M., Balleyguier C., Baltzer P.A., et. al.: Breast MRI: EUSOBI recommendations for women’s information. Eur Radiol 2015; 25: pp. 3669-3678.
21. Jiang L., Zhou Y., Zhou C., et. al.: Dual-source parallel radiofrequency transmission for magnetic resonance breast imaging at 3T: any added clinical value?. Magn Reson Imaging 2014; 32: pp. 523-528.
22. Abe H., Mori N., Tsuchiya K., et. al.: Kinetic analysis of benign and malignant breast lesions with ultrafast dynamic contrast-enhanced MRI: comparison with standard kinetic assessment. AJR Am J Roentgenol 2016; 207: pp. 1159-1166.
23. Kuhl C.K., Schild H.H., Morakkabati N.: Dynamic bilateral contrast-enhanced MR imaging of the breast: trade-off between spatial and temporal resolution. Radiology 2005; 236: pp. 789-800.
24. Uematsu T., Kasami M.: High-spatial-resolution 3-T breast MRI of nonmasslike enhancement lesions: an analysis of their features as significant predictors of malignancy. AJR Am J Roentgenol 2012; 198: pp. 1223-1230.