
Rationale and Objectives
The objective of this study was to develop and quantitatively evaluate a radiology-pathology fusion method for spatially mapping tissue regions corresponding to different chemoradiation therapy-related effects from surgically excised whole-mount rectal cancer histopathology onto preoperative magnetic resonance imaging (MRI).
Materials and Methods
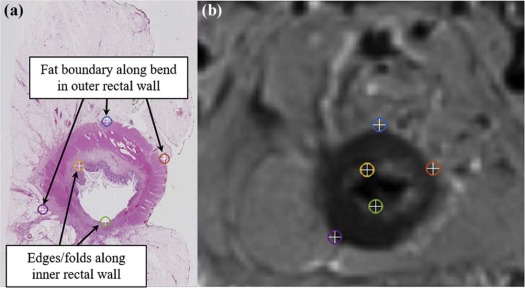
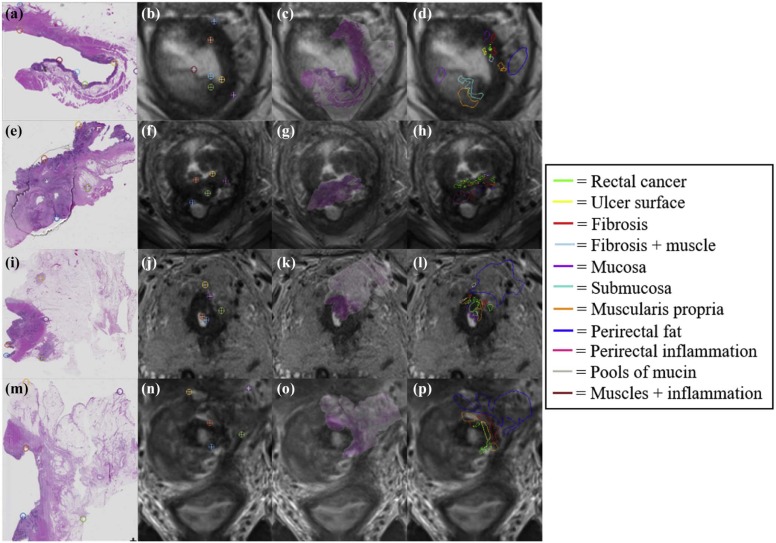
This study included six subjects with rectal cancer treated with chemoradiation therapy who were then imaged with a 3-T T2-weighted MRI sequence, before undergoing mesorectal excision surgery. Excised rectal specimens were sectioned, stained, and digitized as two-dimensional (2D) whole-mount slides. Annotations of residual disease, ulceration, fibrosis, muscularis propria, mucosa, fat, inflammation, and pools of mucin were made by an expert pathologist on digitized slide images. An expert radiologist and pathologist jointly established corresponding 2D sections between MRI and pathology images, as well as identified a total of 10 corresponding landmarks per case (based on visually similar structures) on both modalities (five for driving registration and five for evaluating alignment). We spatially fused the in vivo MRI and ex vivo pathology images using landmark-based registration. This allowed us to spatially map detailed annotations from 2D pathology slides onto corresponding 2D MRI sections.
Results
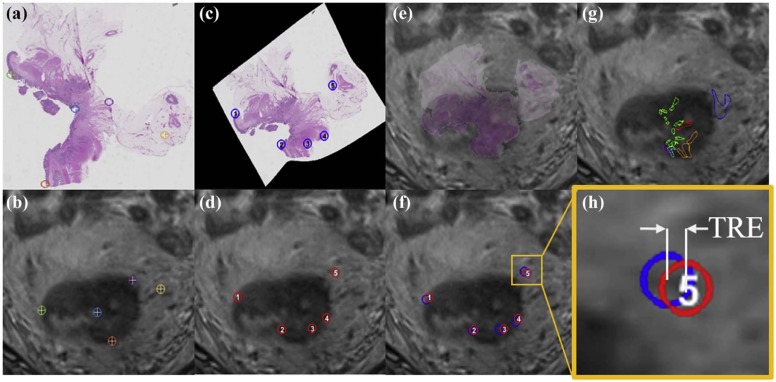
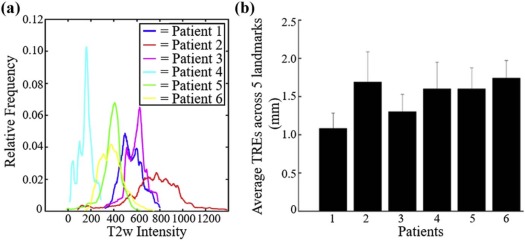
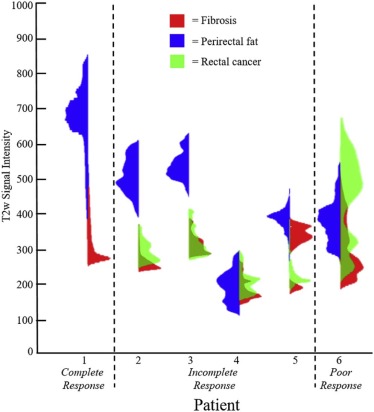
Quantitative assessment of coregistered pathology and MRI sections revealed excellent structural alignment, with an overall deviation of 1.50 ± 0.63 mm across five expert-selected anatomic landmarks (in-plane misalignment of two to three pixels at 0.67- to 1.00-mm spatial resolution). Moreover, the T2-weighted intensity distributions were distinctly different when comparing fibrotic tissue to perirectal fat (as expected), but showed a marked overlap when comparing fibrotic tissue and residual rectal cancer.
Conclusions
Our fusion methodology enabled successful and accurate localization of post-treatment effects on in vivo MRI.
Introduction
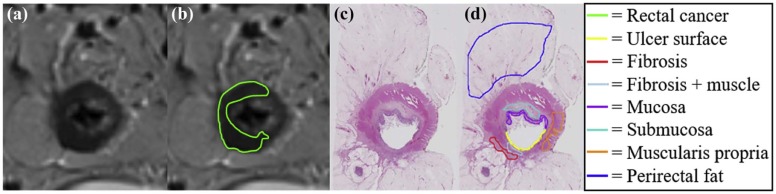
Of the 40,000 patients diagnosed with rectal cancer in 2016 , most underwent neoadjuvant chemoradiation therapy before surgery. However, histopathologic analysis of the postsurgical specimens reveals that up to 27% of these patients had pathologic complete response to treatment , indicating they could have potentially avoided aggressive surgery. Current preoperative standard-of-care assessment is primarily based on T2-weighted (T2w) magnetic resonance imaging (MRI) for evaluation of treatment response and extent of tumor regression in vivo. Radiologists attempt to restage the tumor based on visual differences in grayscale contrast of soft tissue regions within and around the rectum. Although fibrotic tissue and rectal cancer may be different from a physiological perspective (different T2 relaxation times) , regions of benign treatment effects such as fibrosis, inflammation, and mucin pools typically have indistinguishable intensities from residual cancer on T2w MRI ( Fig 1 ) . Thus, experts tend to struggle in identifying patients with complete response (no residual disease and only fibrosis) via MRI, leading to possible overstaging in patients with rectal cancer .
Get Radiology Tree app to read full this article<
Get Radiology Tree app to read full this article<
Get Radiology Tree app to read full this article<
Materials and Methods
Data Description
Get Radiology Tree app to read full this article<
Acquisition of In Vivo MRI
Get Radiology Tree app to read full this article<
Digitization of Surgical Specimens and Annotation of Treatment Effects
Get Radiology Tree app to read full this article<
Identification of Corresponding Slices and Landmarks Between MRI and Pathology Sections
Get Radiology Tree app to read full this article<
Get Radiology Tree app to read full this article<
Get Radiology Tree app to read full this article<
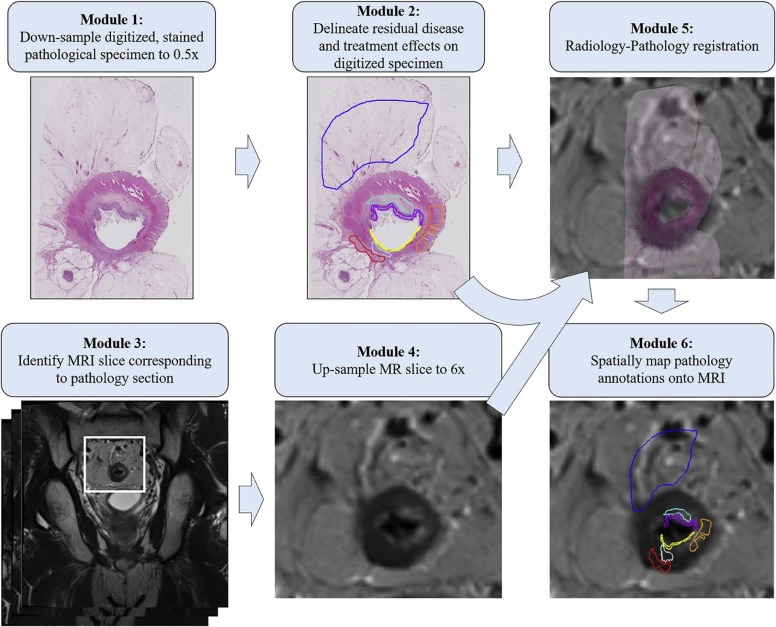
Coregistration of Radiology-Pathology to Spatially Map Detailed Annotations onto MRI
Get Radiology Tree app to read full this article<
Get Radiology Tree app to read full this article<
Get Radiology Tree app to read full this article<
Get Radiology Tree app to read full this article<
Get Radiology Tree app to read full this article<
Evaluation of Coregistration Accuracy
Get Radiology Tree app to read full this article<
Get Radiology Tree app to read full this article<
Get Radiology Tree app to read full this article<
Get Radiology Tree app to read full this article<
Results
Get Radiology Tree app to read full this article<
Get Radiology Tree app to read full this article<
Get Radiology Tree app to read full this article<
Get Radiology Tree app to read full this article<
Get Radiology Tree app to read full this article<
Get Radiology Tree app to read full this article<
Get Radiology Tree app to read full this article<
Discussion
Get Radiology Tree app to read full this article<
Get Radiology Tree app to read full this article<
TABLE 1
Comparison of Radiology-Pathology Coregistration Results to Relevant Literature
Reference Organ Fused Modalities Coregistration Method Number of Registration Landmarks (per Case) Number of Evaluation Landmarks (per Case) TRE (mm) Kimm et al. (2012) Prostate Ex vivo MRI-histology (2D) Injected fiducials 3 10–25 1.24 ± 0.59 Gibson et al. (2012) Prostate Ex vivo MRI-histology (2D) Injected fiducials 10 3–7 0.71 ± 0.38 Litjens et al. (2014) Prostate In vivo MRI-histology (2D) Thin-plate spline 7 Not performed Not performed Rusu et al. (2017) Lung nodules In vivo CT-histology reconstruction (3D) Rigid + nonrigid N/A 5–7 1.06 ± 0.40 This work Rectum In vivo MRI-histology (2D) Thin-plate spline 5–7 5 1.50 ± 0.63
2D, two-dimensional; 3D, three-dimensional; CT, computed tomography; MRI, magnetic resonance imaging; TRE, target registration error.
Get Radiology Tree app to read full this article<
Get Radiology Tree app to read full this article<
Get Radiology Tree app to read full this article<
Get Radiology Tree app to read full this article<
Get Radiology Tree app to read full this article<
Get Radiology Tree app to read full this article<
Supplementary Data
Get Radiology Tree app to read full this article<
Figure S1
Get Radiology Tree app to read full this article<
Get Radiology Tree app to read full this article<
Get Radiology Tree app to read full this article<
Get Radiology Tree app to read full this article<
Get Radiology Tree app to read full this article<
References
1. Siegel R.L., Miller K.D., Jemal A.: Cancer statistics, 2016. CA Cancer J Clin 2017; 66: pp. 7-30.
2. Janjan N.A., Khoo V.S., Abbruzzese J., et. al.: Tumor downstaging and sphincter preservation with preoperative chemoradiation in locally advanced rectal cancer: the M. D. Anderson Cancer Center experience. Int J Radiat Oncol Biol Phys 1999; 44: pp. 1027-1038.
3. Stolfuss J.C., Becker K., Sendler A., et. al.: Rectal carcinoma: high-spatial-resolution MR imaging and T2 quantification in rectal cancer specimens. Radiology 2006; 241: pp. 132-141.
4. Messiou C., Chalmers A.G., Boyle K., et. al.: Pre-operative MR assessment of recurrent rectal cancer. Br J Radiol 2008; 81: pp. 468-473.
5. Videhult P., Smedh K., Lundin P., et. al.: Magnetic resonance imaging for preoperative staging of rectal cancer in clinical practice: high accuracy in predicting circumferential margin with clinical benefit. Colorectal Dis 2007; 9: pp. 412-419.
6. Patel U.B., Taylor F., Blomqvist L., et. al.: Magnetic resonance imaging-detected tumor response for locally advanced rectal cancer predicts survival outcomes: MERCURY experience. J Clin Oncol 2011; 29: pp. 3753-3760.
7. Mandard A.M., Dalibard F., Mandard J.C., et. al.: Pathologic assessment of tumor regression after preoperative chemoradiotherapy of esophageal carcinoma. Clinicopathologic correlations. Cancer 1994; 73: pp. 2680-2686.
8. Ward A.D., Crukley C., McKenzie C.A., et. al.: Prostate: registration of digital histopathologic images to in vivo MR images acquired by using endorectal receive coil. Radiology 2012; 263: pp. 856-864.
9. Nougaret S., Reinhold C., Mikhael H.W., et. al.: The use of MR imaging in treatment planning for patients with rectal carcinoma: have you checked the “DISTANCE”?. Radiology 2013; 268: pp. 330-344.
10. Koh D.H., Brown G., Temple L., et. al.: Distribution of mesorectal lymph nodes in rectal cancer: in vivo MR imaging compared with histopathological examination. Initial observations. Eur Radiol 2005; 15: pp. 1650-1657.
11. Kimm S.Y., Tarin T.V., Lee J.H., et. al.: Methods for registration of magnetic resonance images of ex vivo prostate specimens with histology. J Magn Reson Imaging 2012; 36: pp. 206-212.
12. Gibson E., Cruckley C., Gaed M., et. al.: Registration of prostate histology images to ex vivo MR images via strand-shaped fiducials. J Magn Reson Imaging 2012; 36: pp. 1402-1412.
13. Singanamalli A., Rusu M., Sparks R.E., et. al.: Identifying in vivo DCE MRI markers associated with microvessel architecture and Gleason grades of prostate cancer. J Magn Reson Imaging 2016; 43: pp. 149-158.
14. Hambrock T., Somford D.M., Huisman H.J., et. al.: Relationship between apparent diffusion coefficients at 3.0-T MR imaging and Gleason grade in peripheral zone prostate cancer. Radiology 2011; 259: pp. 453-461.
15. Litjens G.J., Huisman H.J., Elliot R.M., et. al.: Quantitative identification of magnetic resonance imaging features of prostate cancer response following laser ablation and radical prostatectomy. J Med Imaging (Bellingham) 2014; 1: pp. 035001.
16. Greene F.L., Page D.L., Fleming I.D., et. al.: AJCC cancer staging manual.6th ed.2002.Springer-VerlagNew York, NYpp. 113-123.
17. Duchon J.: Splines minimizing rotation-invariant semi-norms in Sobolev spaces.Schempp W.Zeller K.Constructive theory of functions of several variables.1977.Springer-VerlagBerlin:pp. 85-100.
18. Thies S., Langer R.: Tumor regression grading of gastrointestinal carcinomas after neoadjuvant treatment. Front Oncol 2013; 3: pp. 262.
19. Rusu M., Rajiah P., Gilkeson R., et. al.: Co-registration of pre-operative CT with ex vivo surgically excised ground glass nodules to define spatial extent of invasive adenocarcinoma on in vivo imaging: a proof-of-concept study. Eur Radiol 2017; 27: pp. 4209-4217.
20. Dresen R.C., Kusters M., Daniels-Gooszen A.W., et. al.: Absence of tumor invasion into pelvic structures in locally recurrent rectal cancer: prediction with preoperative MR imaging. Radiology 2010; 256: pp. 143-150.
21. Barbaro B., Fiorucci C., Tebala C., et. al.: Locally advanced rectal cancer: MR imaging in prediction of response after preoperative chemotherapy and radiation therapy. Radiology 2009; 250: pp. 730-739.
22. De Cecco C.N., Ganeshan B., Ciolina M., et. al.: Texture analysis as imaging biomarker of tumoral response to neoadjuvant chemoradiotherapy in rectal cancer patients studied with 3-T magnetic resonance. Invest Radiol 2015; 50: pp. 239-245.
23. De Cecco C.N., Ciolina M., Caruso D., et. al.: Performance of diffusion-weighted imaging, perfusion imaging, and texture analysis in predicting tumoral response to neoadjuvant chemoradiotherapy in rectal cancer patients studied with 3T MR: initial experience. Abdom Radiol (NY) 2016; 41: pp. 1728-1735.
24. Dinapoli N., Casa C., Barbaro B., et. al.: Radiomics for rectal cancer. Transl Cancer Res 2016; 5: pp. 424-431.
25. Nie K., Shi L., Chen Q., et. al.: Rectal cancer: assessment of neoadjuvant chemoradiation outcome based on radiomics of multi-parametric MRI. Clin Cancer Res 2016; 22:
26. Rusu M., Golden T., Wang H., et. al.: Framework for 3D histologic reconstruction and fusion with in vivo MRI: preliminary results of characterizing pulmonary inflammation in a mouse model. Med Phys 2015; 42: pp. 4822-4832.
27. Tominaga T., Takagi K., Takeshita H., et. al.: Usefulness of three-dimensional printing models for patients with stoma construction. Case Rep Gastroenterol 2016; 10: pp. 57-62.