
Rationale and Objectives
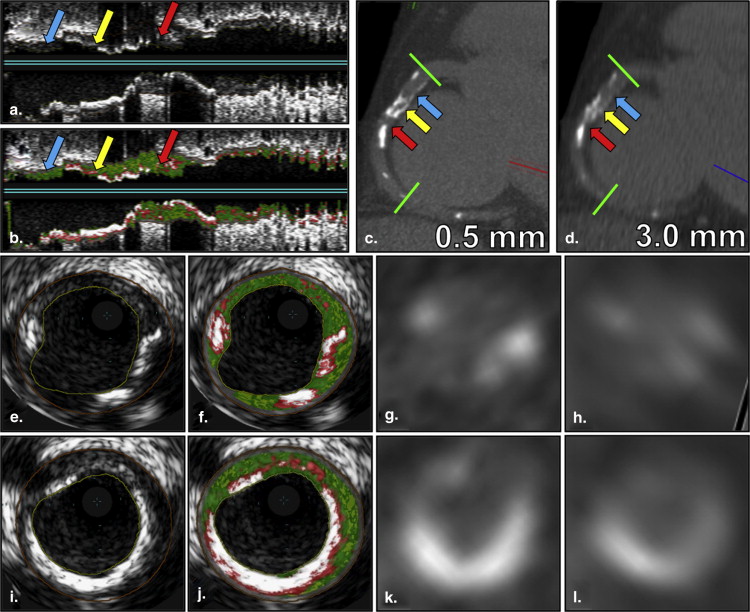
Coronary artery calcium (CAC) images can be reconstructed with thinner slice thickness on some modern multidetector-row computed tomography scanners without additional radiation. We hypothesized that the isotropic 0.5-mm CAC reconstruction outperforms the conventional 3.0-mm reconstruction in detecting and quantifying coronary calcium, and we proposed to compare them by validating against spatially registered intravascular ultrasound with radiofrequency backscatter-virtual histology (IVUS-VH).
Materials and Methods
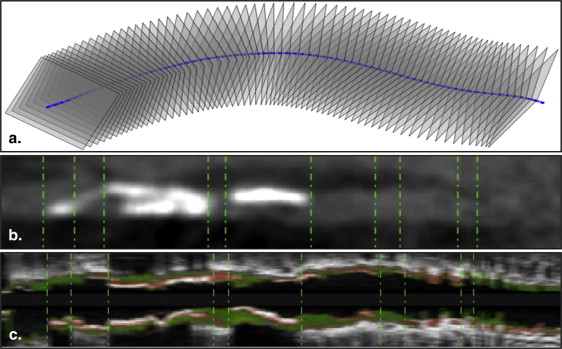
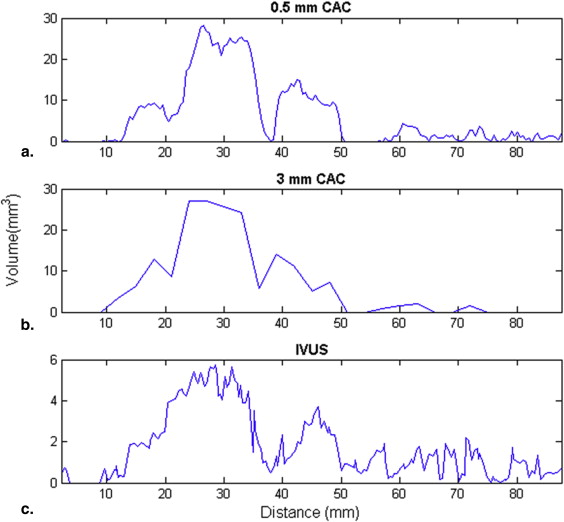
Twenty-seven patients were enrolled, and 5976 mm of coronary arteries were analyzed. A semiautomatic software was developed to coregister CAC and IVUS-VH on a detailed slice-by-slice basis. Calcium detection and calcium volume quantification were evaluated and compared using varying calcium attenuation thresholds. Algorithms for deriving individualized optimal threshold and comparable Agatston score on the 0.5-mm reconstruction were developed.
Results
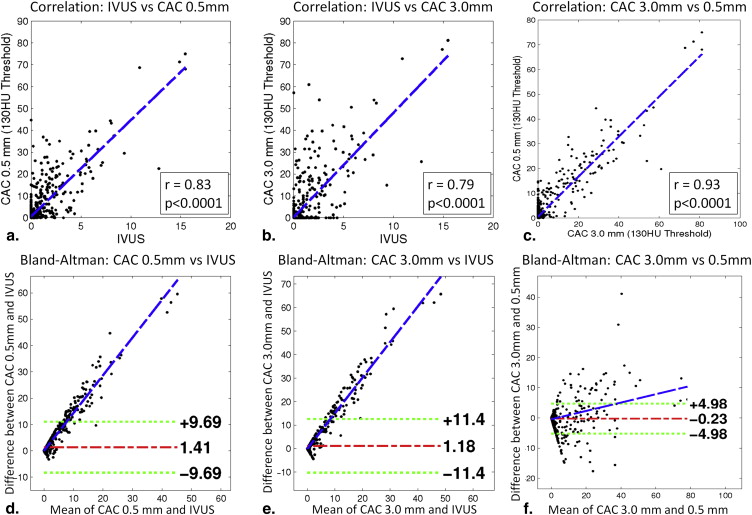
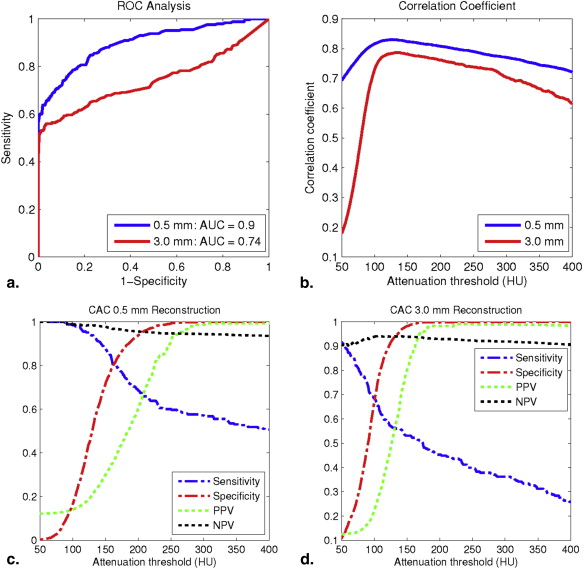
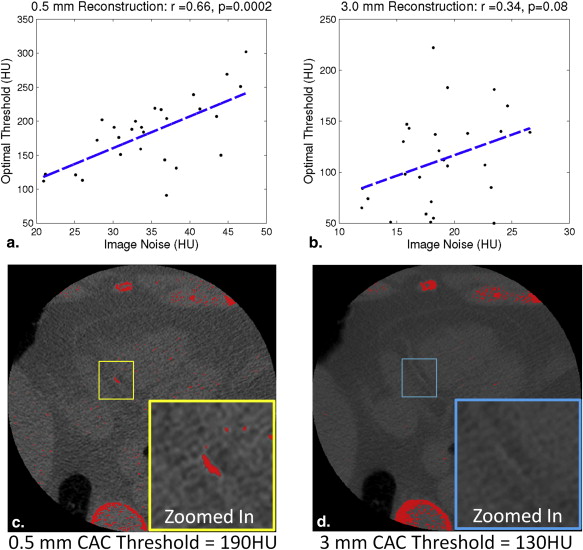
The isotropic 0.5-mm reconstruction achieved significantly higher area under receiver-operating curve than the conventional 3.0-mm reconstruction (0.9 vs. 0.74, P < .001). Using the optimal threshold, the 0.5-mm reconstruction had higher sensitivity (0.79 vs. 0.65), specificity (0.85 vs. 0.77), positive predictive value (0.42 vs. 0.29), and negative predictive value (0.97 vs. 0.94) than the 3.0 mm. Individualized optimal threshold was significantly correlated with the image noise (r = 0.66, P < .001) in the 0.5-mm reconstruction.
Conclusions
By optimizing the calcium threshold, the 0.5-mm reconstruction is superior to the conventional 3.0-mm in detecting and quantifying calcium, which may improve the clinical value of CAC without additional radiation.
Coronary artery calcium (CAC) scoring is a noninvasive, low-radiation computed tomography (CT)-based imaging technique that quantifies the calcium in the coronary vasculature . It provides a well-validated risk stratification scheme for future cardiovascular events . CAC studies were originally developed and validated on the electron-beam CT scanner (EBCT) , and were quantified by calculating the Agatston score and/or the volume score , in which a minimum attenuation value of 130 Hounsfield unit (HU) is typically used as the threshold to detect coronary calcium. Recent studies have shown that the fixed 130-HU threshold may not be optimal for detecting calcium , and a scanner-specific and individualized attenuation threshold is more desirable .
With the increasing popularity and accessibility of multidetector-row CT (MDCT), CAC studies are now typically performed on MDCT scanners. To make the CAC quantification on the MDCT comparable to the original EBCT, current MDCT-based CACs are reconstructed with a 3.0-mm slice thickness, which is the typical collimation thickness on the EBCT scanners. However, CAC volumes acquired on most MDCT scanners can be reconstructed with thinner slice thickness because of MDCT’s smaller detector size. For example, CAC images can be acquired volumetrically using a prospective single-rotation protocol on a 320-detector-row CT scanner. Because of the 0.5-mm collimation thickness, CAC images can be reconstructed with the 0.5-mm slice thickness to achieve an isotropic resolution without increasing the radiation dose. Compared to 3.0 mm, thinner slice thickness potentially reduces partial volume artifact and may improve the sensitivity/specificity and accuracy in quantifying calcium. Some studies reported that the thinner-slice reconstruction resulted in significantly higher Agatston and volume scores and was able to identify more subclinical calcification lesions. On the other hand, some researchers found that the image noise level was significantly higher in the thinner-slice reconstructions, and the conventional threshold of 130 HU leads to more false positives. Mühlenbruch et al. empirically used the threshold of 350 HU in the 1.0-mm reconstruction. However, little is known about the optimal calcium threshold in thinner-slice reconstructions.
Get Radiology Tree app to read full this article<
Get Radiology Tree app to read full this article<
Materials and methods
General Study Design
Get Radiology Tree app to read full this article<
CAC Image Acquisition and Analysis
Get Radiology Tree app to read full this article<
Table 1
CT Imaging Parameters of the CAC Scan
Image Acquisition Parameters Values Detector width, mm 0.5 No. of detectors 320 Gantry rotation time, milliseconds 350 Scan mode Volumetric EKG synchronization Prospectively triggered Tube voltage, kVp 120 Tube current, mA 100–550 Reconstruction slice thickness, mm 3.0 and 0.5 Reconstruction kernel FC12
CAC, coronary artery calcium; CT, computed tomography; EKG, electrocardiogram.
Get Radiology Tree app to read full this article<
Get Radiology Tree app to read full this article<
IVUS Image Acquisition and Analysis
Get Radiology Tree app to read full this article<
Get Radiology Tree app to read full this article<
CAC and IVUS Registration
Get Radiology Tree app to read full this article<
Get Radiology Tree app to read full this article<
Get Radiology Tree app to read full this article<
Get Radiology Tree app to read full this article<
Statistical Analysis
Get Radiology Tree app to read full this article<
Get Radiology Tree app to read full this article<
Get Radiology Tree app to read full this article<
Results
Patient Demographics
Get Radiology Tree app to read full this article<
Table 2
The Demographic Information of the Enrolled Subjects
Patient Demography CAD Normal Patient number 14 13 Age, y 61.5 ± 7.9 48.6 ± 10.2 Sex 10 M, 4 F 8 M, 5 F
CAD, coronary artery disease; F, female; M, male.
Get Radiology Tree app to read full this article<
Using Threshold of 130 HU
Get Radiology Tree app to read full this article<
Get Radiology Tree app to read full this article<
Get Radiology Tree app to read full this article<
Table 3
Summarized Calcium Detection and Quantification Performances of the 0.5-mm and 3.0-mm Reconstructions Using the 130-HU Threshold
Slice Thickness, mm Correlation Coefficient, r_P_ Value Sensitivity Specificity PPV NPV 0.5 0.83 <.0001 0.94 0.50 0.21 0.98 3.0 0.79 <.0001 0.56 0.93 0.54 0.94
NPV, negative predictive value; PPV, positive predictive value.
Get Radiology Tree app to read full this article<
Get Radiology Tree app to read full this article<
Using Thresholds Between 50–400 HU
Get Radiology Tree app to read full this article<
Get Radiology Tree app to read full this article<
Get Radiology Tree app to read full this article<
Get Radiology Tree app to read full this article<
Table 4
Comparison Between 0.5-mm and 3.0-mm Reconstructions Using Optimal Thresholds
Reconstruction, mm Optimal Threshold Sens Spec PPV NPV Correlation Coefficient, r_P_ Value 0.5 171 HU 0.79 0.85 0.42 0.97 0.82 <.0001 3.0 107 HU 0.65 0.77 0.29 0.94 0.76 <.0001
NPV, negative predictive value; PPV, positive predictive value; Sens, sensitivity; Spec, specificity.
The sensitivity, specificity, PPV, NPV, correlation coefficient, and the corresponding P values were calculated at the respective optimal thresholds of the 0.5-mm and 3.0-mm CAC.
Get Radiology Tree app to read full this article<
Individualized Thresholds and the Relationship with Image Noise
Get Radiology Tree app to read full this article<
Get Radiology Tree app to read full this article<
Tind=imagenoise×4.66+20.44HU T
ind
=
image
noise
×
4.66
+
20.44
HU
Get Radiology Tree app to read full this article<
Get Radiology Tree app to read full this article<
Deriving Comparable Agatston Score From 0.5-mm Reconstruction
Get Radiology Tree app to read full this article<
Weightedscore=⎛⎝⎜⎜⎜⎜1,Tind≤HUMAX<Tind×0.74+113HU2,Tind×0.74+113HU≤HUMAX<Tind×0.37+275HU3,Tind×0.37+275HU≤HUMAX<436HU4,HUMAX≥436HU Weighted
score
=
(
1
,
T
ind
≤
H
U
MAX
<
T
ind
×
0.74
+
113
HU
2
,
T
ind
×
0.74
+
113
HU
≤
H
U
MAX
<
T
ind
×
0.37
+
275
HU
3
,
T
ind
×
0.37
+
275
HU
≤
H
U
MAX
<
436
HU
4
,
H
U
MAX
≥
436
HU
Get Radiology Tree app to read full this article<
Get Radiology Tree app to read full this article<
Discussion
Get Radiology Tree app to read full this article<
Get Radiology Tree app to read full this article<
Get Radiology Tree app to read full this article<
Get Radiology Tree app to read full this article<
Get Radiology Tree app to read full this article<
Get Radiology Tree app to read full this article<
Get Radiology Tree app to read full this article<
Get Radiology Tree app to read full this article<
Conclusion
Get Radiology Tree app to read full this article<
Acknowledgment
Get Radiology Tree app to read full this article<
References
1. Budoff M.J., Georgiou D., Brody A., et. al.: Ultrafast computed tomography as a diagnostic modality in the detection of coronary artery disease: a multicenter study. Circulation 1996; 93: pp. 898-904.
2. Guerci A.D., Spadaro L.A., Goodman K.J., et. al.: Comparison of electron beam computed tomography scanning and conventional risk factor assessment for the prediction of angiographic coronary artery disease. J Am Coll Cardiol 1998; 32: pp. 673-679.
3. Budoff M.J., Shaw L.J., Liu S.T., et. al.: Long-term prognosis associated with coronary calcification: observations from a registry of 25,253 patients. J Am Coll Cardiol 2007; 49: pp. 1860-1870.
4. O’Rourke R.A., Brundage B.H., Froelicher V.F., et. al.: American College of Cardiology/American Heart Association Expert Consensus document on electron-beam computed tomography for the diagnosis and prognosis of coronary artery disease. Circulation 2000; 102: pp. 126-140.
5. Rumberger J.A., Brundage B.H., Rader D.J., et. al.: Electron beam computed tomographic coronary calcium scanning: a review and guidelines for use in asymptomatic persons. Mayo Clin Proc 1999; 74: pp. 243-252.
6. Agatston A.S., Janowitz W.R., Hildner F.J., et. al.: Quantification of coronary artery calcium using ultrafast computed tomography. J Am Coll Cardiol 1990; 15: pp. 827-832.
7. Callister T.Q., Cooil B., Raya S.P., et. al.: Coronary artery disease: improved reproducibility of calcium scoring with an electron-beam CT volumetric method. Radiology 1998; 208: pp. 807-814.
8. Hong C., Bae K.T., Pilgram T.K.: Coronary artery calcium: accuracy and reproducibility of measurements with multi-detector row CT–assessment of effects of different thresholds and quantification methods. Radiology 2003; 227: pp. 795-801.
9. Nelson J.C., Kronmal R.A., Carr J.J., et. al.: Measuring coronary calcium on CT images adjusted for attenuation differences. Radiology 2005; 235: pp. 403-414.
10. Raggi P., Callister T.Q., Cooil B.: Calcium scoring of the coronary artery by electron beam CT: how to apply an individual attenuation threshold. AJR Am J Roentgenol 2002; 178: pp. 497-502.
11. Aslam A., Khokhar U.S., Chaudhry A., et. al.: Assessment of isotropic calcium using 0.5-mm reconstructions from 320-row CT data sets identifies more patients with non-zero Agatston score and more subclinical atherosclerosis than standard 3.0-mm coronary artery calcium scan and CT angiography. J Cardiovasc Comput Tomogr 2014; 8: pp. 58-66.
12. van der Bijl N., de Bruin P.W., Geleijns J., et. al.: Assessment of coronary artery calcium by using volumetric 320-row multi-detector computed tomography: comparison of 0.5 mm with 3.0 mm slice reconstructions. Int J Cardiovasc Imaging 2010; 26: pp. 473-482.
13. Muhlenbruch G., Klotz E., Wildberger J.E., et. al.: The accuracy of 1- and 3-mm slices in coronary calcium scoring using multi-slice CT in vitro and in vivo. Eur Radiol 2007; 17: pp. 321-329.
14. Muhlenbruch G., Thomas C., Wildberger J.E., et. al.: Effect of varying slice thickness on coronary calcium scoring with multislice computed tomography in vitro and in vivo. Invest Radiol 2005; 40: pp. 695-699.
15. Hoffmann U., Kwait D.C., Handwerker J., et. al.: Vascular calcification in ex vivo carotid specimens: precision and accuracy of measurements with multi-detector row CT. Radiology 2003; 229: pp. 375-381.
16. Nair A., Kuban B.D., Tuzcu E.M., et. al.: Coronary plaque classification with intravascular ultrasound radiofrequency data analysis. Circulation 2002; 106: pp. 2200-2206.
17. Nasu K., Tsuchikane E., Katoh O., et. al.: Accuracy of in vivo coronary plaque morphology assessment: a validation study of in vivo virtual histology compared with in vitro histopathology. J Am Coll Cardiol 2006; 47: pp. 2405-2412.
18. Nair A., Margolis M.P., Kuban B.D., et. al.: Automated coronary plaque characterisation with intravascular ultrasound backscatter: ex vivo validation. EuroIntervention 2007; 3: pp. 113-120.
19. Gonzalez R., Woods R.: Digital image processing.2nd ed.2002.Prentice HallUpper Saddle River, New Jersey
20. Dhungel A., Qian Z., Vazquez G., et. al.: Optimal cutoff threshold for calcium quantification in isotropic CT calcium scans by validating against registered intravascular ultrasound with radiofrequency backscatter. Conf Proc IEEE Eng Med Biol Soc 2012; 2012: pp. 4982-4985.
21. Coffin M., Sukhatme S.: Receiver operating characteristic studies and measurement errors. Biometrics 1997; 53: pp. 823-837.
22. Sharir T., Berman D.S., Waechter P.B., et. al.: Quantitative analysis of regional motion and thickening by gated myocardial perfusion SPECT: normal heterogeneity and criteria for abnormality. J Nucl Med 2001; 42: pp. 1630-1638.
23. McCollough C.H., Ulzheimer S., Halliburton S.S., et. al.: Coronary artery calcium: a multi-institutional, multimanufacturer international standard for quantification at cardiac CT. Radiology 2007; 243: pp. 527-538.
24. Shaw L.J., Raggi P., Schisterman E., et. al.: Prognostic value of cardiac risk factors and coronary artery calcium screening for all-cause mortality. Radiology 2003; 228: pp. 826-833.
25. Rubinshtein R., Gaspar T., Halon D.A., et. al.: Prevalence and extent of obstructive coronary artery disease in patients with zero or low calcium score undergoing 64-slice cardiac multidetector computed tomography for evaluation of a chest pain syndrome. Am J Cardiol 2007; 99: pp. 472-475.
26. Sarwar A., Shaw L.J., Shapiro M.D., et. al.: Diagnostic and prognostic value of absence of coronary artery calcification. JACC Cardiovasc Imaging 2009; 2: pp. 675-688.
27. Qian Z., Anderson H., Marvasty I., et. al.: Lesion- and vessel-specific coronary artery calcium scores are superior to whole-heart Agatston and volume scores in the diagnosis of obstructive coronary artery disease. J Cardiovasc Comput Tomogr 2010; 4: pp. 391-399.
28. Qian Z., Marvasty I., Rinehart S., et. al.: A lesion-specific coronary artery calcium quantification framework for the prediction of cardiac events. IEEE Trans Inf Technol Biomed 2011; 15: pp. 673-680.
29. Brunner G., Chittajallu D.R., Kurkure U., et. al.: Toward the automatic detection of coronary artery calcification in non-contrast computed tomography data. Int J Cardiovasc Imaging 2010; 26: pp. 829-838.
30. Isgum I., Prokop M., Niemeijer M., et. al.: Automatic coronary calcium scoring in low-dose chest computed tomography. IEEE Trans Med Imaging 2012; 31: pp. 2322-2334.