
Rationale and Objectives
The purpose of this prospective study was to assess image noise and variability in repeated coronary artery calcium (CAC) scoring on low-dose prospective electrocardiographically-triggered 64-slice multidetector computed tomography.
Materials and Methods
Patients (n = 115) suspected of having coronary artery disease were scanned twice, using a tube current of 10 × body mass index mA. The standard deviation (SD) of the computed tomographic value in the ascending aorta and (mean + 2 × SD) were obtained. Repeated CAC scores (Agatston, volume, and mass) were measured by two observers, and the interscan and interobserver variability were determined.
Results
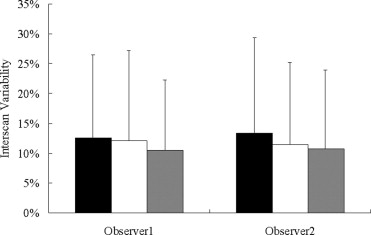
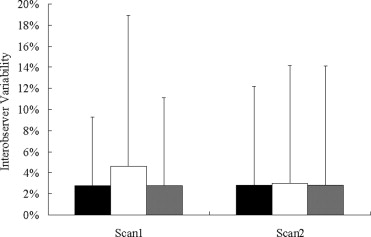
The mean tube current used was 246 ± 36 mA. The mean tube current–time product and mean estimated effective dose were 57 ± 8 mA and 0.9 ± 0.2 mSv, respectively. The SD and (mean + 2 × SD) computed tomographic values in the ascending aorta were 16 ± 3 and 75 ± 10 Hounsfield units, respectively. Repeated CAC scores were correlated ( r 2 = 0.995–0.998). The interscan variability for observer 1 and observer 2, respectively, were 13% and 13% for Agatston score, 12% and 11% for volume, and 11% and 11% for mass. The interobserver variability for scan 1 and scan 2, respectively, were 3% and 3% for Agatston score, 5% and 3% for volume, and 3% and 3% for mass.
Conclusion
Low-dose prospective electrocardiographically-triggered 64-slice multidetector computed tomography shows low interscan and interobserver variability on CAC scoring while maintaining low image noise.
The validity of serial coronary artery calcium (CAC) measurements as a method to monitor the progression of atherosclerosis requires ( ) that the progression of CAC has biologic relevance to atherosclerotic activity, ( ) that the progression of CAC can be detected relative to intertest variability, ( ) that changes in CAC severity have prognostic relevance, and ( ) that the modification of cardiovascular risk factors modulates the progression of CAC ( ). The normal progression of CAC score per year is reported to be 14% to 27% (average, 24%) ( ) and is accelerated up to 33% to 48% with significant coronary disease ( ). However in previous studies, the interscan variability of the Agatston score ( ) using electron-beam computed tomography (CT) has been 20% to 37% ( ). Retrospective electrocardiographically-gated overlapping scanning using 4-slice CT ( ) and 16-slice CT ( ) have shown low interscan variability (12%–13%) for CAC scoring, but this method entails high radiation exposure. Because the progression of CAC is not clearly modifiable through standard risk-reducing therapies, and CAC measurement involves both cost and radiation exposure, the clinical monitoring of CAC progression using serial fast CT is not recommended by the American College of Cardiology and American Heart Association expert committee ( ). Under these circumstances, low radiation exposure and low interscan variability are key requirements for CAC scoring.
In a cardiac phantom study, prospective electrocardiographically-triggered 64-slice multidetector CT (MDCT), even with low radiation dose comparable with that of electron-beam CT, showed low variability for CAC scoring, comparable with that of retrospective electrocardiographically-gated 16-slice MDCT ( ). In a clinical study with 64-slice MDCT ( ), prospective electrocardiographically-triggered scanning showed low variability (Agatston score, 18%; volume, 12%; mass, 11%). The study used a tube current of 350 mA, thereby resulting in a tube current–time product of 82 mA. In studies using 4-slice CT, however, lower tube current–time products of 40 mA ( ) and 55 mA ( ) have been recommended for low-dose CAC scoring. Thus, the purpose of this prospective study was to assess image noise and variability in repeated CAC scoring on low-dose prospective electrocardiographically-triggered 64-slice MDCT.
Materials and methods
Patients
Get Radiology Tree app to read full this article<
Prospective Electrocardiographically-triggered Step-and-Shoot Computed Tomographic Protocol
Get Radiology Tree app to read full this article<
Get Radiology Tree app to read full this article<
Get Radiology Tree app to read full this article<
Image Noise
Get Radiology Tree app to read full this article<
CAC Scoring
Get Radiology Tree app to read full this article<
Get Radiology Tree app to read full this article<
Get Radiology Tree app to read full this article<
Get Radiology Tree app to read full this article<
Interscan and Interobserver Variability
Get Radiology Tree app to read full this article<
Get Radiology Tree app to read full this article<
Radiation Dose
Get Radiology Tree app to read full this article<
Statistical Analyses
Get Radiology Tree app to read full this article<
Results
Get Radiology Tree app to read full this article<
Get Radiology Tree app to read full this article<
Table 1
Patient Demographics
Variable All Patients Coronary Artery Calcium (Agatston Score) Positive Negative No. of patients 115 80 35 Women/men 81/34 62/18 19/16 Age (y) (range) 64 ± 12 (34–87) 67 ± 11 (39–87) 57 ± 13 (34–80) Body mass index (kg/m 2 ) 25 ± 3 (18–35) 25 ± 3 (24–35) 25 ± 4 (18–34) Symptom 82/115 (71%) 56/80 (70%) 26/35 (74%) Risk factor 80/115 (70%) 56/80 (70%) 14/35 (40%)
Quantitative variables are expressed as mean ± SD (range). Categorical variables are expressed as frequency (percentage).
Get Radiology Tree app to read full this article<
Image Noise
Get Radiology Tree app to read full this article<
![Figure 1, Representative images showing high and low SD values. Two low-noise images ( a , 11 Hounsfield units [HU]; b , 11 HU) and two high-noise images ( c , 27 HU; d , 26 HU) are shown. (a) Image of a man with a body mass index [BMI] of 20 kg/m 2 and a body height of 164 cm. (b) Image of a woman with a BMI of 22 kg/m 2 and a body height of 146 cm. (c) Image of a man with a BMI of 31 kg/m 2 and a body height of 180 cm. (d) Image of a woman with a BMI of 29 kg/m 2 and a body height of 160 cm, presenting with cardiomegaly.](https://storage.googleapis.com/dl.dentistrykey.com/clinical/CoronaryArteryCalciumScoringonLowdoseProspectiveElectrocardiographicallytriggered64SliceCT/0_1s20S1076633208003358.jpg)
Get Radiology Tree app to read full this article<
CAC Scores
Get Radiology Tree app to read full this article<
Table 2
Agatston, Volume, and Mass Scores on Two Scans Measured by Two Observers
Agatston Score Volume Mass Observer 1 ⁎ Scan 1 688 (223), 1–5,676 538 (186), 2–4,270 143 (40), 0.2–1,158 Scan 2 683 (211), 1–6,130 533 (180), 3–4,658 143 (40), 0.3–1,185 Observer 2 † Scan 1 709 (229), 1–5,849 552 (189), 2–4,392 144 (40), 0.2–1,167 Scan 2 701 (211), 1–6,262 546 (183), 3–4,748 144 (40), 0.3–1,187
Data are expressed as mean (median), range.
Get Radiology Tree app to read full this article<
Get Radiology Tree app to read full this article<
Get Radiology Tree app to read full this article<
Interscan Variability
Get Radiology Tree app to read full this article<
Get Radiology Tree app to read full this article<
Interobserver Variability
Get Radiology Tree app to read full this article<
Get Radiology Tree app to read full this article<
Radiation Dose
Get Radiology Tree app to read full this article<
Discussion
Get Radiology Tree app to read full this article<
Image Noise
Get Radiology Tree app to read full this article<
Get Radiology Tree app to read full this article<
CAC Scores: Interscan and Interobserver Variability
Get Radiology Tree app to read full this article<
Radiation Dose
Get Radiology Tree app to read full this article<
Get Radiology Tree app to read full this article<
Get Radiology Tree app to read full this article<
References
1. Greenland P., Bonow R.O., Brundage B.H., et. al.: ACCF/AHA 2007 clinical expert consensus document on coronary artery calcium scoring by computed tomography in global cardiovascular risk assessment and in evaluation of patients with chest pain. J Am Coll Cardiol 2007; 49: pp. 378-402.
2. Maher J.E., Bielak L.F., Raz J.A., Sheedy P.F., Schwartz R.S., Peyser P.A.: Progression of coronary artery calcification: a pilot study. Mayo Clin Proc 1999; 74: pp. 347-355.
3. Janowitz W.R., Agatston A.S., Viamonte M.: Comparison of serial quantitative evaluation of calcified coronary artery plaque by ultrafast computed tomography in persons with and without obstructive coronary artery disease. Am J Cardiol 1991; 68: pp. 1-6.
4. Fischbach R., Heindel W.: Detection and quantification of coronary calcification: an update. Rofo 2000; 172: pp. 407-414.
5. Agatston A.S., Janowitz W.R., Hildner F.J., Zusmer N.R., Viamonte M., Detrano R.: Quantification of coronary calcium using ultrafast computed tomography. J Am Coll Cardiol 1990; 15: pp. 827-832.
6. Callister T.Q., Cooil B., Raya S.P., et. al.: Coronary artery disease: improved reproducibility of calcium scoring with an electron-beam CT volumetric method. Radiology 1998; 208: pp. 807-814.
7. Yoon H.C., Greaser L.E., Mather R., Sinha S., McNitt-Gray M.F., Goldin J.G.: Coronary artery calcium: alternate methods for accurate and reproducible quantitation. Acad Radiol 1997; 4: pp. 666-673.
8. Wang S.J., Detrano B.C., Secci A., et. al.: Detection of coronary calcification with electron-beam computed tomography: evaluation of interexamination reproducibility and comparison of three image-acquisition protocols. Am Heart J 1996; 132: pp. 550-558.
9. Achenbach S., Ropers D., Mohlenkamp S., et. al.: Variability of repeated coronary artery calcium measurements by electron beam tomography. Am J Cardiol 2001; 87: pp. 210-213.
10. Ohnesorge B., Flohr T., Fischbach R., et. al.: Reproducibility of coronary calcium quantification in repeat examinations with retrospectively ECG-gated multisection spiral CT. Eur Radiol 2002; 12: pp. 1532-1540.
11. Horiguchi J., Yamamoto H., Akiyama Y., et. al.: Variability of repeated coronary artery calcium measurements by 16-MDCT with retrospective reconstruction. AJR Am J Roentgenol 2005; 184: pp. 1917-1923.
12. Horiguchi J., Kiguchi M., Fujioka C., et. al.: Variability of repeated coronary artery calcium scoring and radiation dose on 64-slice and 16-slice CT by prospective electrocardiograph-triggered axial and retrospective electrocardiograph-gated spiral CT—a phantom study. Acad Radiol 2008; 15: pp. 958-965.
13. Horiguchi J., Matsuura N., Yamamoto H., et. al.: Variability of repeated coronary artery calcium measurements by 1.25-mm- and 2.5-mm-thickness images on prospective electrocardiograph-triggered 64-slice CT. Eur Radiol 2008; 18: pp. 209-216.
14. Takahashi N., Bae K.T.: Quantification of coronary artery calcium with multi-detector row CT: assessing interscan variability with different tube currents-pilot study. Radiology 2003; 228: pp. 101-106.
15. Shemesh J., Evron R., Koren-Morag N., et. al.: Coronary artery calcium measurement with multi-detector row CT and low radiation dose: comparison between 55 and 165 mAs. Radiology 2005; 236: pp. 810-814.
16. Horiguchi J., Shen Y., Hirai N., et. al.: Timing on 16-slice scanner and implications for 64-slice cardiac CT: do you start scanning immediately after breath-hold?. Acad Radiol 2006; 13: pp. 173-176.
17. Matsuura N., Horiguchi J., Yamamoto H., et. al.: Optimal cardiac phase for coronary artery calcium scoring on single-source 64-MDCT scanner—least interscan variability and least motion artifacts. AJR Am J Roentgenol 2008; 190: pp. 1561-1568.
18. Sevrukov A., Pratap A., Doss C., Jelnin V., Hoff J.A., Kondos G.T.: Electron beam tomography imaging of coronary calcium: the effect of body mass index on radiologic noise. J Comput Assist Tomogr 2002; 26: pp. 592-597.
19. Hong C., Bae K.T., Pilgram T.K., Suh J., Bradley D.: Coronary artery calcium measurement with multi-detector row CT: in vitro assessment of effect of radiation dose. Radiology 2002; 225: pp. 901-906.
20. Halliburton S.S., Stillman A.E., Lieber M., Kasper J.M., Kuzmiak S.A., White R.D.: Potential clinical impact of variability in the measurement of coronary artery calcification with sequential MDCT. AJR Am J Roentgenol 2005; 184: pp. 643-648.
21. Menzel H., Schibilla H., Teunen D.: European Guidelines for Quality Criteria for Computed Tomography.2000.European CommissionBrussels, Belgium
22. McCollough C.H., Ulzheimer S., Halliburton S.S., et. al.: Coronary artery calcium: a multiinstitutional, multimanufacturer international standard for quantification at cardiac CT. Radiology 2007; 243: pp. 527-538.
23. Bielak L.F., Kaufmann R.B., Moll P.P., MacCollough C.H., Schwartz R.S., Sheedy P.F.: Small lesions in the heart identified at electron beam CT: calcification or noise?. Radiology 1994; 192: pp. 631-636.
24. Thomas C.K., Mühlenbruch G., Wildberger J.E., et. al.: Coronary artery calcium scoring with multislice computed tomography. Invest Radiol 2006; 41: pp. 668-673.
25. Jakobs T.F., Wintersperger B.J., Herzog P., et. al.: Ultra-low-dose coronary artery calcium screening using multislice CT with retrospective ECG gating. Eur Radiol 2003; 13: pp. 1923-1930.