
Rationale and Objectives
Iterative reconstruction (IR) computed tomography (CT) techniques allow for radiation dose reduction while maintaining image quality. However, CT coronary artery calcium (CAC) scores may be influenced by certain IR algorithms. The aim of our study is to identify suitable correction factors to ensure consistency between IR and filtered back projection (FBP)-based CAC scoring.
Material and Methods
A phantom study was performed to derive suitable correction factors for CAC scores and volume (VOL) values with advanced modeled iterative reconstruction (or ADMIRE) strength level 3 (ADM3) and 5 (ADM5) vs FBP. CT data from 40 patients were retrospectively analyzed, and CAC score and VOL values were obtained following reconstruction with FBP, ADM3, and ADM5. Linear regression analysis was performed to obtain correction factors. Results with and without application of the correction factors were compared. Inter-reader agreement for risk class stratification was analyzed.
Results
Phantom experiments determined a correction factor of 1.14 for ADM3 and 1.25 for ADM5. FBP-based CAC scores (897 ± 1413) were significantly higher than uncorrected scores with ADM3 (746 ± 1184, P ≤ .001) and ADM5 (640 ± 1036, P ≤ .001). After application of correction factors, no significant differences were found for CAC scores based on FBP (897 ± 1413) and ADM3 (853 ± 1353, P = .07). The inter-reader agreement for risk stratification was excellent ( k = 0.91).
Conclusion
ADM3 can be applied to CAC scoring with use of a correction factor. When applying a correction factor of 1.14, excellent agreement with standard FBP for both CAC score and VOL can be achieved.
Introduction
Coronary artery calcium (CAC) scoring is a well-established technique for coronary artery disease risk stratification and patient management and is an independent predictor of major adverse cardiovascular events . Accordingly, CAC scoring has been integrated into societal guidelines for the assessment of asymptomatic patients with intermediate cardiac risk according to the Framingham classification . However, CAC scoring was recently downgraded to a IIb appropriateness classification because of concerns about exposing a potentially large group of a priori healthy individuals to ionizing radiation through widespread screening . Tube current reduction during CAC scoring has been proposed as a possible solution to lower radiation exposure. However, as reported by Deprez et al. , although lower tube currents do not influence the computed tomography (CT) attenuation of CAC, image noise can be increased, thus limiting interpretation .
Iterative reconstruction (IR) algorithms have been universally shown to lower image noise and thus allow radiation dose reduction without compromising image quality . They have been widely investigated for use in coronary CT angiography (CCTA) , but their role in CAC scoring remains controversial. Gebhard et al. and Kurata et al. reported a systematic underestimation of the Agatston score with IR . In contrast, Schindler et al. reported excellent agreement between standard filtered back projection (FBP) and IR in terms of Agatston score-based cardiac risk classification .
Get Radiology Tree app to read full this article<
Get Radiology Tree app to read full this article<
Materials and Methods
CT Acquisition Protocol and Image Reconstruction
Get Radiology Tree app to read full this article<
Get Radiology Tree app to read full this article<
Get Radiology Tree app to read full this article<
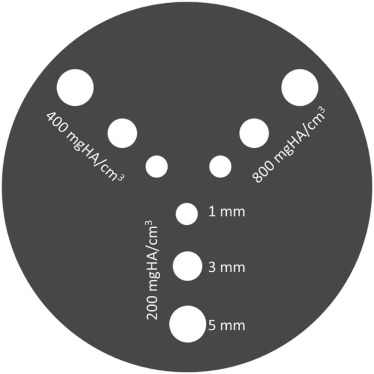
Phantom Study
Get Radiology Tree app to read full this article<
Get Radiology Tree app to read full this article<
Get Radiology Tree app to read full this article<
Get Radiology Tree app to read full this article<
Get Radiology Tree app to read full this article<
Correction Factors
Get Radiology Tree app to read full this article<
Patient Study
Get Radiology Tree app to read full this article<
Get Radiology Tree app to read full this article<
Calcium Scoring Values
Get Radiology Tree app to read full this article<
Get Radiology Tree app to read full this article<
Get Radiology Tree app to read full this article<

Get Radiology Tree app to read full this article<
Statistical Analysis
Get Radiology Tree app to read full this article<
Results
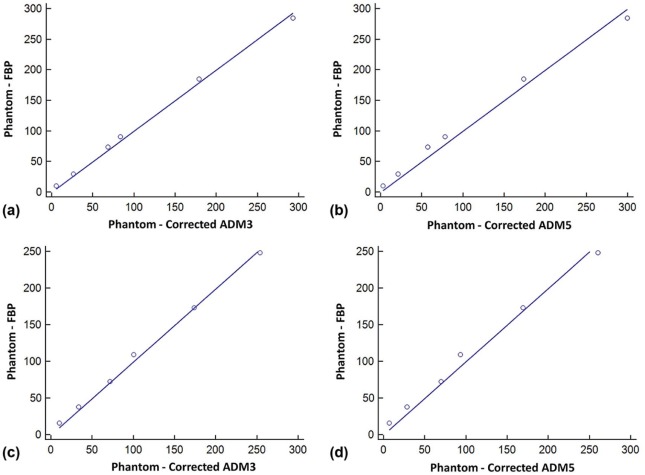
Phantom Study
Get Radiology Tree app to read full this article<
Get Radiology Tree app to read full this article<
Get Radiology Tree app to read full this article<
Table 1
CAC Score and Volume Values of Phantom Study Among the Three Reconstruction Groups (FBP, ADM3, and ADM5)
CAC Score Volume Before correction factor application_P_ value Before correction factor application_P_ value FBP 112 ± 104 FBP vs ADM3.024 FBP 109 ± 87 FBP vs ADM3.016 ADM3 95 ± 94 FBP vs ADM5.021 ADM3 92 ± 79 FBP vs ADM5.016 ADM5 83 ± 89 ADM3 vs ADM5.021 ADM5 81 ± 74 ADM3 vs ADM5.018 After correction factor application_P_ value After correction factor application_P_ value FBP 112 ± 104 FBP vs ADM3 .550 FBP 109 ± 87 FBP vs ADM3 .684 ADM3 109 ± 108 FBP vs ADM5 .476 ADM3 107 ± 92 FBP vs ADM5 .635 ADM5 105 ± 112 ADM3 vs ADM5 .478 ADM5 104 ± 95 ADM3 vs ADM5 .699
ADM3, advanced modeled iterative reconstruction (ADMIRE) strength level 3; ADM5, ADMIRE strength level 3; CAC; coronary artery calcium; FBP, filtered back projection.
Results are reported before and after the application of a correction factor.
Bold values indicate significant differences.
Get Radiology Tree app to read full this article<
Correction Factor
Get Radiology Tree app to read full this article<
Get Radiology Tree app to read full this article<
Get Radiology Tree app to read full this article<
Get Radiology Tree app to read full this article<
Patient Study Population
Get Radiology Tree app to read full this article<
Objective Image Quality
Get Radiology Tree app to read full this article<
Table 2
Patient-Based Objective Image Quality Results Comprising Attenuation (HU), Image Noise (HU), and Signal-to-Noise Ratio (SNR) for FBP, ADM3, and AMD5
Attenuation (HU)P Value FBP 42.18 ± 5.57 FBP vs ADM3 .63 ADM3 42.43 ± 5.81 FBP vs ADM5 .95 ADM5 42.20 ± 5.54 ADM3 vs ADM5 .54 Image noise (HU)P value FBP 21.08 ± 4.84 FBP vs ADM3.001 ADM3 15.38 ± 3.98 FBP vs ADM5.001 ADM5 10.63 ± 2.72 ADM3 vs ADM5.001 SNR_P_ value FBP 2.10 ± 0.57 FBP vs ADM3.001 ADM3 2.94 ± 0.87 FBP vs ADM5.001 ADM5 4.23 ± 1.24 ADM3 vs ADM5.001
ADM3, advanced modeled iterative reconstruction (ADMIRE) strength level 3; ADM5, ADMIRE strength level 3; FBP, filtered back projection; HU, Hounsfield unit.
Bold values indicate significant differences.
Get Radiology Tree app to read full this article<
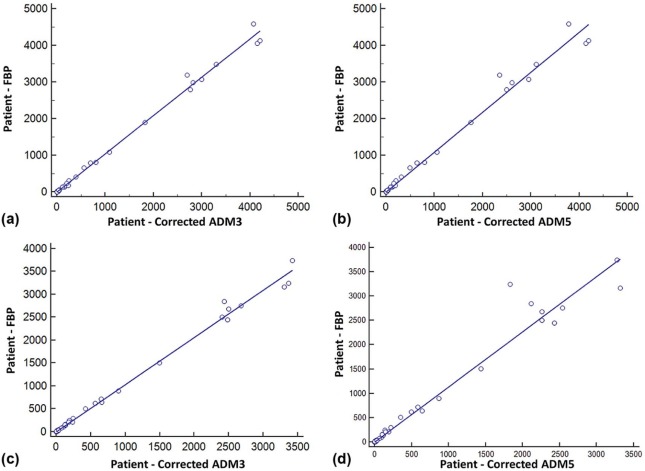
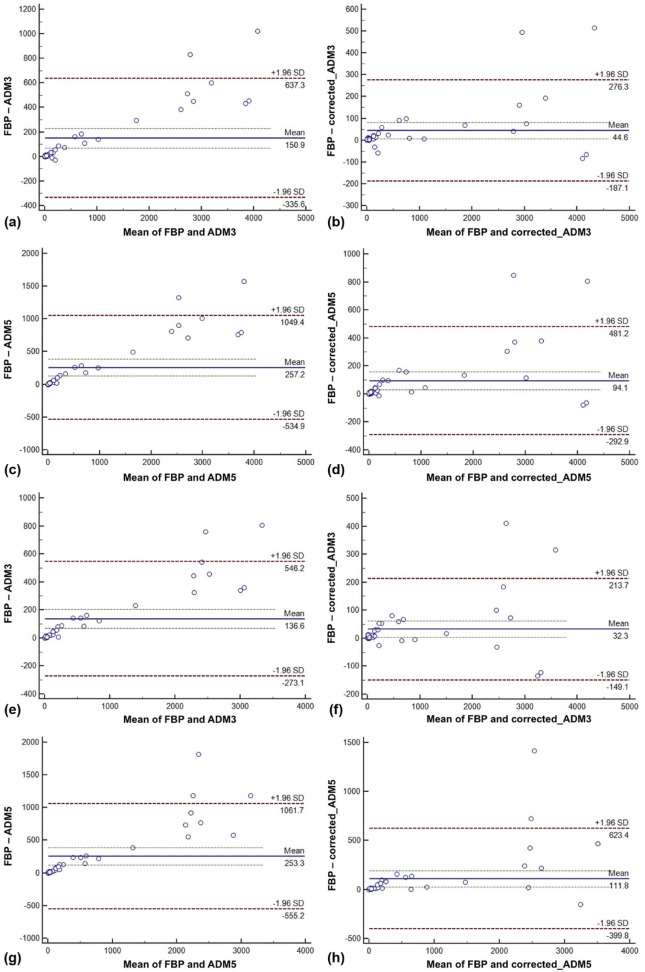
CAC Score
Get Radiology Tree app to read full this article<
Table 3
CAC Score and Volume Values of the Patient Study Among the Three Reconstruction Groups (FBP, ADM3, and ADM5)
CAC Score Volume Before correction factor application_P_ value Before correction factor application_P_ value FBP 897 ± 1413 FBP vs ADM3.001 FBP 758 ± 1150 FBP vs ADM3.001 ADM3 746 ± 1184 FBP vs ADM5.001 ADM3 622 ± 957 FBP vs ADM5.001 ADM5 640 ± 1036 ADM3 vs ADM5.001 ADM5 505 ± 785 ADM3 vs ADM5.01 After correction factor application_P_ value After correction factor application_P_ value FBP 897 ± 1413 FBP vs ADM3 .07 FBP 758 ± 1150 FBP vs ADM3 .10 ADM3 853 ± 1353 FBP vs ADM5.01 ADM3 726 ± 1118 FBP vs ADM5.03 ADM5 803 ± 1300 ADM3 vs ADM5.001 ADM5 647 ± 1005 ADM3 vs ADM5 .14
ADM3, advanced modeled iterative reconstruction (ADMIRE) strength level 3; ADM5, ADMIRE strength level 3; CAC, coronary artery calcium; FBP, filtered back projection.
Results are reported before and after the application of a correction factor.
Bold values indicate significant differences.
Get Radiology Tree app to read full this article<
Get Radiology Tree app to read full this article<
Get Radiology Tree app to read full this article<
Risk Classification
Get Radiology Tree app to read full this article<
Table 4
CAC Score Risk Class Stratification Before and After the Application of a Correction Factor
None
0 Minor
1–10 Mild
11–100 Moderate
101–400 Severe
400k FBP – 4 13 9 14 ADM3 – 8 10 9 13 FBP vs ADM3 0.73 ADM5 3 6 13 6 12 FBP vs ADM5 0.51 Corrected values ADM3 – 7 10 10 13 FBP vs ADM3 0.91 ADM5 3 6 10 8 13 FBP vs ADM5 0.65
ADM3, advanced modeled iterative reconstruction (ADMIRE) strength level 3; ADM5, ADMIRE strength level 3; CAC, coronary artery calcium; FBP, filtered back projection.
Cohen k represents inter-reader agreement.
Get Radiology Tree app to read full this article<
Get Radiology Tree app to read full this article<
Get Radiology Tree app to read full this article<
Get Radiology Tree app to read full this article<
Discussion
Get Radiology Tree app to read full this article<
Get Radiology Tree app to read full this article<
Get Radiology Tree app to read full this article<
Get Radiology Tree app to read full this article<
Get Radiology Tree app to read full this article<
Conclusion
Get Radiology Tree app to read full this article<
References
1. Becker C.R., Majeed A., Crispin A., et. al.: CT measurement of coronary calcium mass: impact on global cardiac risk assessment. Eur Radiol 2005; 15: pp. 96-101.
2. Agatston A.S., Janowitz W.R., Hildner F.J., et. al.: Quantification of coronary artery calcium using ultrafast computed tomography. J Am Coll Cardiol 1990; 15: pp. 827-832.
3. Pletcher M.J., Sibley C.T., Pignone M., et. al.: Interpretation of the coronary artery calcium score in combination with conventional cardiovascular risk factors: the Multi-Ethnic Study of Atherosclerosis (MESA). Circulation 2013; 128: pp. 1076-1084.
4. Rumberger J.A.: Electron beam CT and coronary calcium score. Circulation 1998; 97: pp. 2095-2096.
5. Greenland P., Alpert J.S., Beller G.A., et. al.: 2010 ACCF/AHA guideline for assessment of cardiovascular risk in asymptomatic adults: a report of the American College of Cardiology Foundation/American Heart Association Task Force on Practice Guidelines. J Am Coll Cardiol 2010; 56: pp. e50-e103.
6. Goff D.C., Lloyd-Jones D.M., Bennett G., et. al.: 2013 ACC/AHA guideline on the assessment of cardiovascular risk: a report of the American College of Cardiology/American Heart Association Task Force on Practice Guidelines. J Am Coll Cardiol 2014; 63: pp. 2935-2959.
7. Deprez F.C., Vlassenbroek A., Ghaye B., et. al.: Controversies about effects of low-kilovoltage MDCT acquisition on Agatston calcium scoring. J Cardiovasc Comput Tomogr 2013; 7: pp. 58-61.
8. Geyer L.L., Schoepf U.J., Meinel F.G., et. al.: State of the art: iterative CT reconstruction techniques. Radiology 2015; 276: pp. 339-357.
9. Yin W.H., Lu B., Gao J.B., et. al.: Effect of reduced x-ray tube voltage, low iodine concentration contrast medium, and sinogram-affirmed iterative reconstruction on image quality and radiation dose at coronary CT angiography: results of the prospective multicenter REALISE trial. J Cardiovasc Comput Tomogr 2015; 9: pp. 215-224.
10. Ebersberger U., Tricarico F., Schoepf U.J., et. al.: CT evaluation of coronary artery stents with iterative image reconstruction: improvements in image quality and potential for radiation dose reduction. Eur Radiol 2013; 23: pp. 125-132.
11. Yin W.H., Lu B., Li N., et. al.: Iterative reconstruction to preserve image quality and diagnostic accuracy at reduced radiation dose in coronary CT angiography: an intraindividual comparison. JACC Cardiovasc Imaging 2013; 6: pp. 1239-1249.
12. Flohr T.G., De Cecco C.N., Schmidt B., et. al.: Computed tomographic assessment of coronary artery disease: state-of-the-art imaging techniques. Radiol Clin North Am 2015; 53: pp. 271-285.
13. Renker M., Ramachandra A., Schoepf U.J., et. al.: Iterative image reconstruction techniques: applications for cardiac CT. J Cardiovasc Comput Tomogr 2011; 5: pp. 225-230.
14. Wang R., Schoepf U.J., Wu R., et. al.: Image quality and radiation dose of low dose coronary CT angiography in obese patients: sinogram affirmed iterative reconstruction versus filtered back projection. Eur J Radiol 2012; 81: pp. 3141-3145.
15. Gordic S., Desbiolles L., Sedlmair M., et. al.: Optimizing radiation dose by using advanced modelled iterative reconstruction in high-pitch coronary CT angiography. Eur Radiol 2015; 26: pp. 459-468.
16. Yin W.H., Lu B., Hou Z.H., et. al.: Detection of coronary artery stenosis with sub-milliSievert radiation dose by prospectively ECG-triggered high-pitch spiral CT angiography and iterative reconstruction. Eur Radiol 2013; 23: pp. 2927-2933.
17. Gebhard C., Fiechter M., Fuchs T.A., et. al.: Coronary artery calcium scoring: Influence of adaptive statistical iterative reconstruction using 64-MDCT. Int J Cardiol 2013; 167: pp. 2932-2937.
18. Kurata A., Dharampal A., Dedic A., et. al.: Impact of iterative reconstruction on CT coronary calcium quantification. Eur Radiol 2013; 23: pp. 3246-3252.
19. Schindler A., Vliegenthart R., Schoepf U.J., et. al.: Iterative image reconstruction techniques for CT coronary artery calcium quantification: comparison with traditional filtered back projection in vitro and in vivo. Radiology 2014; 270: pp. 387-393.
20. Gordic S., Desbiolles L., Stolzmann P., et. al.: Advanced modelled iterative reconstruction for abdominal CT: qualitative and quantitative evaluation. Clin Radiol 2014; 69: pp. e497-e504.
21. Vliegenthart R., Song B., Hofman A., et. al.: Coronary calcification at electron-beam CT: effect of section thickness on calcium scoring in vitro and in vivo. Radiology 2003; 229: pp. 520-525.
22. van Osch J.A., Mouden M., van Dalen J.A., et. al.: Influence of iterative image reconstruction on CT-based calcium score measurements. Int J Cardiovasc Imaging 2014; 30: pp. 961-967.
23. Shaw L.J., Raggi P., Schisterman E., et. al.: Prognostic value of cardiac risk factors and coronary artery calcium screening for all-cause mortality. Radiology 2003; 228: pp. 826-833.
24. Renker M., Nance J.W., Schoepf U.J., et. al.: Evaluation of heavily calcified vessels with coronary CT angiography: comparison of iterative and filtered back projection image reconstruction. Radiology 2011; 260: pp. 390-399.
25. Cho Y.J., Schoepf U.J., Silverman J.R., et. al.: Iterative image reconstruction techniques: cardiothoracic computed tomography applications. J Thorac Imaging 2014; 29: pp. 198-208.
26. Hecht H.S., de Siqueira M.E., Cham M., et. al.: Low- vs. standard-dose coronary artery calcium scanning. Eur Heart J Cardiovasc Imaging 2015; 16: pp. 358-363.
27. Szilveszter B., Elzomor H., Karolyi M., et. al.: The effect of iterative model reconstruction on coronary artery calcium quantification. Int J Cardiovasc Imaging 2016; 32: pp. 153-160.
28. Takahashi M., Kimura F., Umezawa T., et. al.: Comparison of adaptive statistical iterative and filtered back projection reconstruction techniques in quantifying coronary calcium. J Cardiovasc Comput Tomogr 2016; 10: pp. 61-68.
29. Tatsugami F., Higaki T., Fukumoto W., et. al.: Radiation dose reduction for coronary artery calcium scoring at 320-detector CT with adaptive iterative dose reduction 3D. Int J Cardiovasc Imaging 2015; 31: pp. 1045-1052.
30. Vogler N., Meyer M., Fink C., et. al.: Predictive value of zero calcium score and low-end percentiles for the presence of significant coronary artery stenosis in stable patients with suspected coronary artery disease. Rofo 2013; 185: pp. 726-732.