
Rationale and Objectives
The objective of this study was to assess the relationship of brown adipose tissue (BAT) activity with different fat compartments of the body, body mass index (BMI), outdoor temperature, thyroid-stimulating hormone (TSH) levels, blood glucose, age, and sex in a large patient population using F-18-fluordesoxyglucose positron emission tomography-computer tomography (FDG-PET/CT) scans obtained under thermoneutral conditions.
Materials and Methods
FDG-PET/CT scans of 4852 patients were retrospectively analyzed for BAT activity. The volumes of the different fat compartments visceral adipose tissue (VAT), subcutaneous adipose tissue (SCAT), and liver fat, were assessed by computed tomography. Age, sex, TSH levels, blood glucose levels, BMI, primary disease, and the outdoor temperature were determined. Multiple linear regression analyses were performed to identify independent relationships between the parameters.
Results
The VAT, SCAT, and liver fat content were lower in BAT-positive patients than in BAT-negative patients (each P < 0.0001). BAT-positive patients had a lower BMI ( P < 0.0001) and were more often female ( P < 0.0001), younger ( P < 0.0001), and had higher TSH levels ( P = 0.0002), whereas the outdoor temperature and the blood glucose level were not different compared to BAT-negative patients. Age, sex, VAT, and SCAT were independent factors related to BAT.
Conclusions
Age, sex, and VAT are the most important determinants of BAT activity under thermoneutral conditions. VAT reflects the association between BAT activity and body fat mass more clearly than BMI. The strength of the association between VAT and BAT decreases during aging in men, but increases in women. This may indicate a different importance of BAT activity for obesity in men and in women.
Introduction
Brown adipose tissue (BAT) is exclusively found in mammals and generates heat to protect animals from hypothermia . For a long time, it was thought that BAT is present in humans only in newborns, until it was found to be present also in about 5%–10% of adults under thermoneutral conditions . BAT activity is increased upon cold activation . However, whereas cold-activated BAT was found in approximately 50% of younger subjects, it was merely found in 10% of older people .
BAT has the function of nonshivering thermogenesis. Being activated by the sympathetic nervous system, BAT has a high glucose and fatty acid consumption . This increase in BAT-associated expenditure is thought to have positive effects on body fat mass . In agreement with this notion, BAT mass and activity are negatively associated with the body mass index (BMI), the total fat mass, and the mass of visceral adipose tissue (VAT) and subcutaneous adipose tissue (SCAT) . In particular, the body fat compartment VAT is related to obesity-related disorders . In addition, increased BAT mass and activity are thought to be associated with improved glucose and lipid metabolism . Consequently, activation of BAT is accompanied by increased insulin sensitivity and diminished glucose levels, although this association is not confirmed consistently in published data . Interestingly, although cold exposure can strongly induce BAT activity and cold-induced thermogenesis in young adults, the effects on body fat mass are small . Furthermore, it is not realistic that cold exposure will become a widely applied tool to treat obesity and its metabolic consequences in the clinical setting. This raises the question as to what extent BAT mass and activity associate with different body compartments, liver fat (LF) content, and glucose levels under thermoneutral conditions. As further regulators, thyroid hormones have been shown to induce BAT activity in mice and in men .
Get Radiology Tree app to read full this article<
Materials and Methods
Patients
Get Radiology Tree app to read full this article<
FDG-PET/CT Examination
Get Radiology Tree app to read full this article<
Get Radiology Tree app to read full this article<
Image Analysis and Data Collection
Get Radiology Tree app to read full this article<
Get Radiology Tree app to read full this article<
Statistical Analysis
Get Radiology Tree app to read full this article<
Results
Whole Patient Group
Get Radiology Tree app to read full this article<
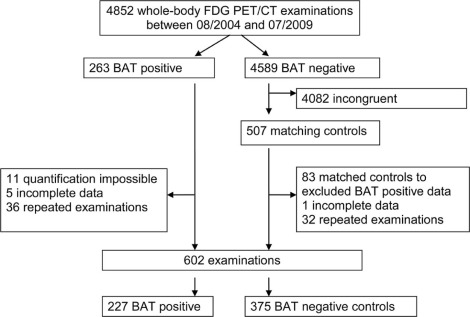
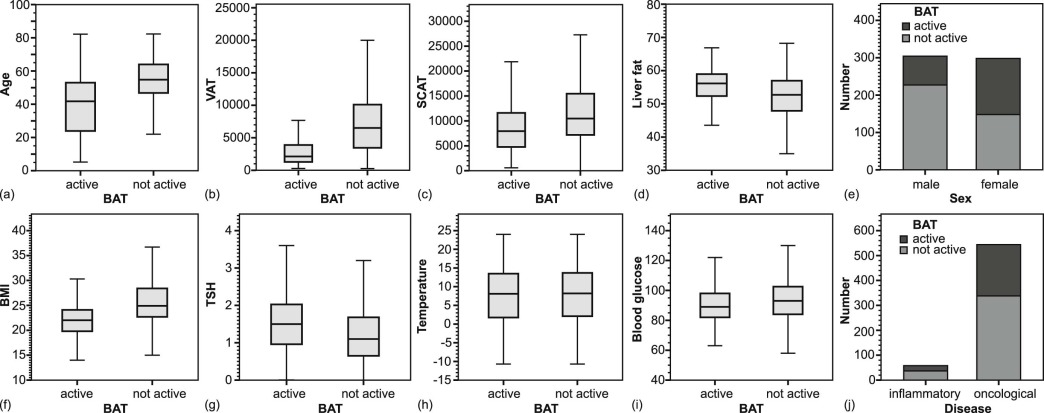
TABLE 1
Relationship of Patient Characteristics and Temperature with BAT Activity
Characteristics Spearman Correlation r Spearman Correlation P Value Multiple Linear Regression P Value Sex <0.0001 Age −0.3851 <0.0001 \* <0.0001 BMI −0.3336 <0.0001 \* n.s. TSH 0.1326 0.0035 \* n.s. Blood glucose −0.0976 0.0168 n.s. Temperature −0.0473 0.2464 n.s. VAT −0.5060 <0.0001 \* 0.0344 LF −0.2902 <0.0001 \* n.s. SCAT −0.2344 <0.0001 \* 0.0314
BMI, body mass index; LF, liver fat; n.s., not significant; SCAT, subcutaneous adipose tissue; TSH, thyroid-stimulating hormone; VAT, visceral adipose tissue.
Get Radiology Tree app to read full this article<
Get Radiology Tree app to read full this article<
Get Radiology Tree app to read full this article<
Subgroups Divided by Age
Get Radiology Tree app to read full this article<
TABLE 2
Association Between Patient Characteristics and BAT Activity in Subgroups by Age
Age Group Characteristics Spearman Correlation r Spearman Correlation P Value Multiple Linear Regression P Value Tertile 1 ( n = 201) BMI −0.2960 <0.0001 \* n.s. TSH 0.2142 0.0089 n.s. Blood glucose −0.0337 0.6364 n.s. VAT −0.3466 <0.0001 \* <0.0001 LF −0.1679 0.0543 n.s. SCAT −0.2085 0.0031 \* n.s. Tertile 2 ( n = 200) BMI −0.2967 <0.0001 \* n.s. TSH 0.0093 0.9043 n.s. Blood glucose −0.0085 0.9045 n.s. VAT −0.4423 <0.0001 \* <0.0001 LF −0.3458 <0.0001 \* n.s. SCAT −0.1630 0.0211 n.s. Tertile 3 ( n = 201) BMI −0.2107 0.0027 \* n.s. TSH −0.0414 0.8376 n.s. Blood glucose −0.0251 0.7239 n.s. VAT −0.4283 <0.0001 \* <0.0001 LF −0.2112 0.0079 \* n.s. SCAT −0.1354 0.0553 n.s.
BMI, body mass index; LF, liver fat; n.s., not significant; SCAT, subcutaneous adipose tissue; TSH, thyroid-stimulating hormone; VAT, visceral adipose tissue.
Tertile 1: age 5–44 years; tertile 2: age 44–57 years; tertile 3, 57–82 years.
Get Radiology Tree app to read full this article<
Get Radiology Tree app to read full this article<
Get Radiology Tree app to read full this article<
Subgroups Divided by Sex
Get Radiology Tree app to read full this article<
TABLE 3
Association Between Patient Characteristics and BAT Activity in Subgroups by Sex
Sex Characteristics Spearman Correlation r Spearman Correlation P Value Multiple Linear Regression P Value Male ( n = 304) BMI −0.3340 <0.0001 \* n.s. TSH 0.0998 0.1778 n.s. Blood glucose −0.0730 n.s. n.s. VAT −0.4945 <0.0001 \* <0.0001 LF −0.2750 <0.0001 \* 0.0386 SCAT −0.3902 <0.0001 \* n.s. Female ( n = 298) BMI −0.2402 <0.0001 \* n.s. TSH 0.1731 0.0076 \* n.s. Blood glucose −0.0990 n.s. n.s. VAT −0.3433 <0.0001 \* <0.0001 LF −0.2765 <0.0001 \* n.s. SCAT −0.2131 0.0012 \* n.s.
BMI, body mass index; LF, liver fat; n.s., not significant; SCAT, subcutaneous adipose tissue; TSH, thyroid-stimulating hormone; VAT, visceral adipose tissue.
Get Radiology Tree app to read full this article<
Get Radiology Tree app to read full this article<
Subgroups Divided by Age and Sex
Get Radiology Tree app to read full this article<
TABLE 4
Association Between Patient Characteristics and BAT Activity in Subgroups by Age and Sex
Subgroup Characteristics Spearman Correlation r Spearman Correlation P Value Multiple Linear Regression P Value Male tertile 1 ( n = 108) BMI −0.3404 0.0003 \* n.s. TSH 0.3699 0.0007 \* n.s. Blood glucose 0.0789 0.4189 n.s. VAT −0.4319 <0.0001 \* <0.0001 LF −0.2322 0.0549 n.s. SCAT −0.3692 <0.0001 \* n.s. Male tertile 2 ( n = 93) BMI −0.2447 0.0181 n.s. TSH −0.2186 0.0514 n.s. Blood glucose 0.0259 0.8056 n.s. VAT −0.3560 0.0005 \* 0.0004 LF −0.1936 0.1418 n.s. SCAT −0.3295 0.0013 \* n.s. Male tertile 3 ( n = 103) BMI −0.1001 0.3142 n.s. TSH −0.1698 0.1159 n.s. Blood glucose −0.0213 0.8311 n.s. VAT −0.2934 0.0026 \* n.s. LF −0.0948 0.4091 n.s. SCAT −0.1693 0.0874 0.0385 Female tertile 1 ( n = 93) BMI −0.2032 0.0507 n.s. TSH 0.0920 0.4556 n.s. Blood glucose −0.1679 0.1097 n.s. VAT −0.1329 0.2067 n.s. LF −0.1679 0.1885 n.s. Female tertile 2 ( n = 107) BMI −0.1892 0.0510 n.s. TSH 0.1815 0.0852 n.s. Blood glucose 0.0077 0.9373 n.s. VAT −0.2558 0.0078 \* 0.0443 LF −0.3957 0.0002 \* 0.0149 SCAT −0.1668 0.0860 n.s. Female tertile 3 ( n = 98) BMI −0.1764 0.0839 n.s. TSH 0.0804 0.4842 n.s. Blood glucose 0.0518 0.6123 n.s. VAT −0.3614 0.0003 \* 0.0369 LF −0.2614 0.0200 n.s. SCAT −0.2283 0.0237 n.s.
BMI, body mass index; LF, liver fat; n.s., not significant; SCAT, subcutaneous adipose tissue; TSH, thyroid-stimulating hormone; VAT, visceral adipose tissue.
Tertile 1: age 5–44 years; tertile 2: age 44–57 years; tertile 3, 57–82 years.
Get Radiology Tree app to read full this article<
Get Radiology Tree app to read full this article<
Discussion
Get Radiology Tree app to read full this article<
Get Radiology Tree app to read full this article<
Get Radiology Tree app to read full this article<
Get Radiology Tree app to read full this article<
Get Radiology Tree app to read full this article<
Get Radiology Tree app to read full this article<
Acknowledgment
Get Radiology Tree app to read full this article<
References
1. Cannon B., Nedergaard J.: Brown adipose tissue: function and physiological significance. Physiol Rev 2004; 84: pp. 277-359.
2. Cypess A.M., Lehman S., Williams G., et. al.: Identification and importance of brown adipose tissue in adult humans. N Engl J Med 2009; 360: pp. 1509-1517.
3. Kajimura S., Saito M.: A new era in brown adipose tissue biology: molecular control of brown fat development and energy homeostasis. Annu Rev Physiol 2014; 76: pp. 225-249.
4. Ouellet V., Routhier-Labadie A., Bellemare W., et. al.: Outdoor temperature, age, sex, body mass index, and diabetic status determine the prevalence, mass, and glucose-uptake activity of 18F-FDG-detected BAT in humans. J Clin Endocrinol Metab 2011; 96: pp. 192-199.
5. Pfannenberg C., Werner M.K., Ripkens S., et. al.: Impact of age on the relationships of brown adipose tissue with sex and adiposity in humans. Diabetes 2010; 59: pp. 1789-1793.
6. van Marken Lichtenbelt W.D., Vanhommerig J.W., Smulders N.M., et. al.: Cold-activated brown adipose tissue in healthy men. N Engl J Med 2009; 360: pp. 1500-1508.
7. Virtanen K.A., Lidell M.E., Orava J., et. al.: Functional brown adipose tissue in healthy adults. N Engl J Med 2009; 360: pp. 1518-1525.
8. Saito M., Okamatsu-Ogura Y., Matsushita M., et. al.: High incidence of metabolically active brown adipose tissue in healthy adult humans: effects of cold exposure and adiposity. Diabetes 2009; 58: pp. 1526-1531.
9. Yoneshiro T., Aita S., Matsushita M., et. al.: Age-related decrease in cold-activated brown adipose tissue and accumulation of body fat in healthy humans. Obesity (Silver Spring) 2011; 19: pp. 1755-1760.
10. Carey A.L., Formosa M.F., Van Every B., et. al.: Ephedrine activates brown adipose tissue in lean but not obese humans. Diabetologia 2013; 56: pp. 147-155.
11. Halpern B., Mancini M.C., Halpern A.: Brown adipose tissue: what have we learned since its recent identification in human adults. Arq Bras Endocrinol Metabol 2014; 58: pp. 889-899.
12. Vosselman M.J., van Marken Lichtenbelt W.D., Schrauwen P.: Energy dissipation in brown adipose tissue: from mice to men. Mol Cell Endocrinol 2013; 379: pp. 43-50.
13. Matsushita M., Yoneshiro T., Aita S., et. al.: Impact of brown adipose tissue on body fatness and glucose metabolism in healthy humans. Int J Obes 2014; 38: pp. 812-817.
14. Tchernof A., Despres J.P.: Pathophysiology of human visceral obesity: an update. Physiol Rev 2013; 93: pp. 359-404.
15. Hanssen M.J., Hoeks J., Brans B., et. al.: Short-term cold acclimation improves insulin sensitivity in patients with type 2 diabetes mellitus. Nat Med 2015; 21: pp. 863-865.
16. Chondronikola M., Volpi E., Borsheim E., et. al.: Brown adipose tissue activation is linked to distinct systemic effects on lipid metabolism in humans. Cell Metab 2016; 23: pp. 1200-1206.
17. Betz M.J., Enerback S.: Human brown adipose tissue: what we have learned so far. Diabetes 2015; 64: pp. 2352-2360.
18. Persichetti A., Sciuto R., Rea S., et. al.: Prevalence, mass, and glucose-uptake activity of (1)(8)F-FDG-detected brown adipose tissue in humans living in a temperate zone of Italy. PLoS ONE 2013; 8: pp. e63391.
19. van der Lans A.A., Hoeks J., Brans B., et. al.: Cold acclimation recruits human brown fat and increases nonshivering thermogenesis. J Clin Invest 2013; 123: pp. 3395-3403.
20. Skarulis M.C., Celi F.S., Mueller E., et. al.: Thyroid hormone induced brown adipose tissue and amelioration of diabetes in a patient with extreme insulin resistance. J Clin Endocrinol Metab 2010; 95: pp. 256-262.
21. Lopez M., Varela L., Vazquez M.J., et. al.: Hypothalamic AMPK and fatty acid metabolism mediate thyroid regulation of energy balance. Nat Med 2010; 16: pp. 1001-1008.
22. Machann J., Thamer C., Schnoedt B., et. al.: Standardized assessment of whole body adipose tissue topography by MRI. J Magn Reson Imaging 2005; 21: pp. 455-462.
23. Sampath S.C., Sampath S.C., Bredella M.A., et. al.: Imaging of brown adipose tissue: state of the art. Radiology 2016; 280: pp. 4-19.
24. Carey A.L., Kingwell B.A.: Brown adipose tissue in humans: therapeutic potential to combat obesity. Pharmacol Ther 2013; 140: pp. 26-33.
25. Cronin C.G., Prakash P., Daniels G.H., et. al.: Brown fat at PET/CT: correlation with patient characteristics. Radiology 2012; 263: pp. 836-842.
26. Dinas P.C., Nikaki A., Jamurtas A.Z., et. al.: Association between habitual physical activity and brown adipose tissue activity in individuals undergoing PET-CT scan. Clin Endocrinol (Oxf) 2015; 82: pp. 147-154.
27. Ozguven S., Ones T., Yilmaz Y., et. al.: The role of active brown adipose tissue in human metabolism. Eur J Nucl Med Mol Imaging 2016; 43: pp. 355-361.
28. Pischon T., Boeing H., Hoffmann K., et. al.: General and abdominal adiposity and risk of death in Europe. N Engl J Med 2008; 359: pp. 2105-2120.
29. Merlotti C., Ceriani V., Morabito A., et. al.: Subcutaneous fat loss is greater than visceral fat loss with diet and exercise, weight-loss promoting drugs and bariatric surgery: a critical review and meta-analysis. Int J Obes 2017; 41: pp. 672-682.
30. Stefan N., Schick F., Haring H.U.: Causes, characteristics, and consequences of metabolically unhealthy normal weight in humans. Cell Metab 2017; 26: pp. 292-300.
31. Machann J., Thamer C., Schnoedt B., et. al.: Age and gender related effects on adipose tissue compartments of subjects with increased risk for type 2 diabetes: a whole body MRI/MRS study. MAGMA 2005; 18: pp. 128-137.
32. Gesta S., Tseng Y.H., Kahn C.R.: Developmental origin of fat: tracking obesity to its source. Cell 2007; 131: pp. 242-256.
33. Yilmaz Y., Ones T., Purnak T., et. al.: Association between the presence of brown adipose tissue and non-alcoholic fatty liver disease in adult humans. 2011; 34: pp. 318-323.
34. Chen K.Y., Brychta R.J., Linderman J.D., et. al.: Brown fat activation mediates cold-induced thermogenesis in adult humans in response to a mild decrease in ambient temperature. J Clin Endocrinol Metab 2013; 98: pp. E1218-E1223.
35. Blondin D.P., Labbe S.M., Tingelstad H.C., et. al.: Increased brown adipose tissue oxidative capacity in cold-acclimated humans. J Clin Endocrinol Metab 2014; 99: pp. E438-E446.
36. Ouellet V., Labbe S.M., Blondin D.P., et. al.: Brown adipose tissue oxidative metabolism contributes to energy expenditure during acute cold exposure in humans. J Clin Invest 2012; 122: pp. 545-552.
37. Huang Y.C., Hsu C.C., Wang P.W., et. al.: Review analysis of the association between the prevalence of activated brown adipose tissue and outdoor temperature. ScientificWorldJournal 2012; 2012: pp. 793039.
38. Vosselman M.J., Vijgen G.H., Kingma B.R., et. al.: Frequent extreme cold exposure and brown fat and cold-induced thermogenesis: a study in a monozygotic twin. PLoS ONE 2014; 9: pp. e101653.
39. Obregon M.J.: Adipose tissues and thyroid hormones. Front Physiol 2014; 5: pp. 479.
40. Zhang Q., Miao Q., Ye H., et. al.: The effects of thyroid hormones on brown adipose tissue in humans: a PET-CT study. Diabetes Metab Res Rev 2014; 30: pp. 513-520.
41. Gilsanz V., Hu H.H., Kajimura S.: Relevance of brown adipose tissue in infancy and adolescence. Pediatr Res 2013; 73: pp. 3-9.
42. Drubach L.A., Palmer E.L., Connolly L.P., et. al.: Pediatric brown adipose tissue: detection, epidemiology, and differences from adults. J Pediatr 2011; 159: pp. 939-944.
43. Gilsanz V., Chung S.A., Jackson H., et. al.: Functional brown adipose tissue is related to muscle volume in children and adolescents. J Pediatr 2011; 158: pp. 722-726.
44. Chen K.Y., Cypess A.M., Laughlin M.R., et. al.: Brown Adipose Reporting Criteria in Imaging STudies (BARCIST 1.0): Recommendations for Standardized FDG-PET/CT Experiments in Humans. Cell Metab 2016; 24: pp. 210-222.