
Rationale and Objectives
This work is aimed at determining whether magnetic resonance spectroscopy (MRS) and diffusion tensor imaging (DTI) may correlate with disease severity in a series of Parkinson disease (PD) patients.
Materials and Methods
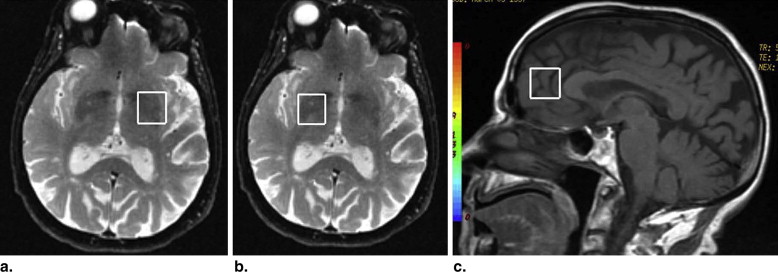
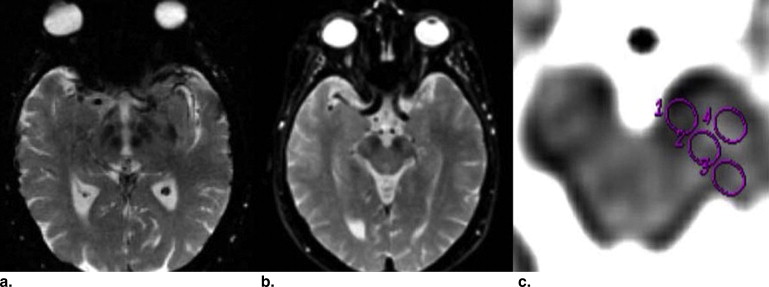
We recruited a consecutive sample of 39 PD patients in several stages of the disease according to Hoehn and Yahr scale. There were 22 men, and the mean age was 74.5 years (SD 7.5). Disease severity was measured with the Unified Parkinson Disease Rating Scale (UPDRS). All of them underwent 1 H MRS in basal ganglia and the anterior cingulate area, as well as DTI in bilateral substantia nigra. Correlation was made between radiological findings and UPDRS.
Results
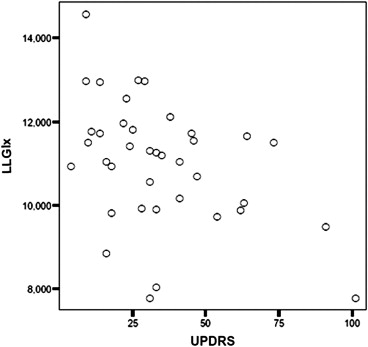
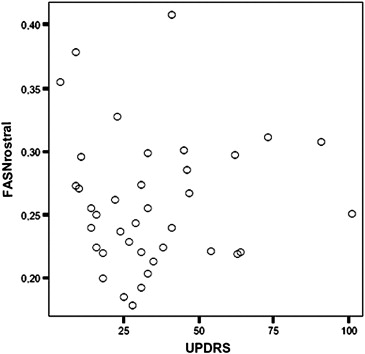
We found significant negative correlation between UPDRS scores and the Glx (glutamate+glutamine) levels in the right ( r = −0.35; P = .03) and the left ( r = −0.44; P = .006) lentiform nucleus; as well as with glutamate ( r = −0.43; P = .008), the Glx/Cr ratio in the right ( r = −0.41; P = .01), and in the left lentiform nucleus ( r = −0.36; P = .02). We also found positive correlation between UPDRS scores and DTI in right rostral substantia nigra ( r = 0.36; P = .02). Glx was increased in lentiform nucleus and fractional anisotropy was reduced in the rostral SN of subjects with PD in early stages.
Conclusions
The results are consistent with the view that more than half the dopaminergic neurons in the nigrostriatal projection are lost before the onset of PD.
Parkinson disease (PD) is a frequent disease in the elderly. To date and with exception of positron emission tomography there is no specific radiological marker of the disease. However a marker should be useful to monitor progression and response to treatment.
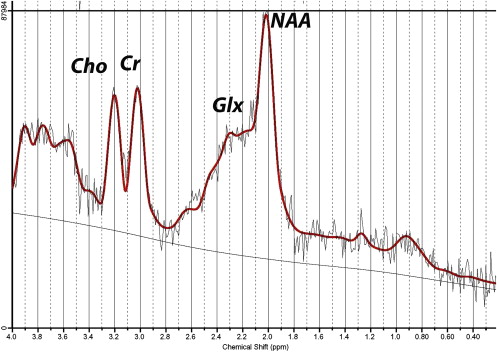
Magnetic resonance spectroscopy (MRS) provides a noninvasive method for characterizing chemical and cellular features in vivo. MRS can be used to measure the chemical composition of tissues, characterize certain tissue metabolic processes, and identify unanticipated chemical or metabolic relationships with disease. In brain tissue, the concentrations and mobility of MRS-visible, low-molecular-weight chemicals are measured as spectral peaks and can be used to detect abnormalities in brain regions that seem normal in magnetic resonance imaging (MRI) and to elucidate the pathology underlying MRI-visible abnormalities .
Get Radiology Tree app to read full this article<
Get Radiology Tree app to read full this article<
Get Radiology Tree app to read full this article<
Get Radiology Tree app to read full this article<
Get Radiology Tree app to read full this article<
Patients and methods
Get Radiology Tree app to read full this article<
Get Radiology Tree app to read full this article<
Get Radiology Tree app to read full this article<
Get Radiology Tree app to read full this article<
Get Radiology Tree app to read full this article<
Get Radiology Tree app to read full this article<
Get Radiology Tree app to read full this article<
Get Radiology Tree app to read full this article<
Get Radiology Tree app to read full this article<
Get Radiology Tree app to read full this article<
Get Radiology Tree app to read full this article<
Get Radiology Tree app to read full this article<
Get Radiology Tree app to read full this article<
Get Radiology Tree app to read full this article<
Get Radiology Tree app to read full this article<
Get Radiology Tree app to read full this article<
Get Radiology Tree app to read full this article<
Ethical Aspects
Get Radiology Tree app to read full this article<
Results
Get Radiology Tree app to read full this article<
Get Radiology Tree app to read full this article<
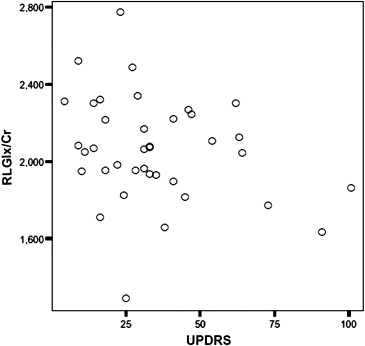
Table 1
Values of Fractional Anisotropy
Explored ROI Means and SD (Left) Means and SD (Right) Rostral SN 0.259 (0.05) 0.242 (0.04) Medial SN 0.339 (0.055) 0.345 (0.07) Caudal SN 0.239 (0.058) 0.276 (0.05) Cerebral peduncle 0.344 (0.06) 0.382 (0.06)
ROI, region of interest; SD, standard deviation; SN, substantia nigra.
Get Radiology Tree app to read full this article<
Get Radiology Tree app to read full this article<
Table 2
Metabolite Values (ppm) and Ratios to Creatine by Every Area of Exploration
Metabolite Anterior Cingulate Area Right Lentiform Nucleus Left Lentiform Nucleus Creatine 5.25 (1.3) 5.52 (0.6) 5.28 (0.68) Glutamate 7.22 (2.1) 6.98 (0.99) 7.29 (1.01) Glutamate/Cr 1.37 (0.38) 1.27 (0.18) 1.4 (0.2) mI 5.15 (1.86) 4.39 (0.83) 4.08 (0.81) mI/Cr 0.99 (0.28) 0.80 (0.12) 0.78 (0.13) NAA 5.15 (1.27) 5.23 (0.92) 5.43 (0.96) NAA/Cr 0.99 (0.23) 0.95 (0.17) 1.03 (0.17) Choline 1.45 (0.41) 1.51 (0.17) 1.4 (0.2) Choline/Cr 0.27 (0.48) 0.27 (0.24) 0.27 (0.31) Glx 11.06 (3.51) 11.32 (1.2) 10.98 (1.47) Glx/Cr 2.13 (0.64) 2.05 (0.27) 2.1 (0.34)
Cr, total creatine; Glx, glutamate+glutamine; mI, myo-inositol; NAA, N-acetyl-aspartate.
Get Radiology Tree app to read full this article<
Get Radiology Tree app to read full this article<
Discussion
Get Radiology Tree app to read full this article<
Get Radiology Tree app to read full this article<
Get Radiology Tree app to read full this article<
Get Radiology Tree app to read full this article<
Get Radiology Tree app to read full this article<
Get Radiology Tree app to read full this article<
Get Radiology Tree app to read full this article<
Get Radiology Tree app to read full this article<
Correlations between Brain Metabolites and Variables
Get Radiology Tree app to read full this article<
Get Radiology Tree app to read full this article<
Get Radiology Tree app to read full this article<
Get Radiology Tree app to read full this article<
References
1. Fayed N., Olmos S., Morales H., et. al.: Physical basis of magnetic resonance spectroscopy and its application to central nervous system diseases. Am J Appl Sci 2006; 3: pp. 1836-1845.
2. Holshouser B.A., Komu M., Moller H.E., et. al.: Localized proton NMR spectroscopy in the striatum of patients with idiopathic Parkinson’s disease: a multicenter pilot study. Magn Reson Med 1995; 33: pp. 589-594.
3. Camicioli R.M., Hanstock C.C., Bouchard T.P., et. al.: Magnetic resonance spectroscopic evidence for presupplementary motor area neuronal dysfunction in Parkinson’s disease. Mov Disord 2007; 22: pp. 382-386.
4. Firbank M.J., Harrison R.M., O’Brian J.T.: A comprehensive review of proton magnetic resonance spectroscopy studies in dementia and Parkinson’s disease. Dement Geriatr Cogn Disord 2002; 14: pp. 64-76.
5. Taylor-Robinson S.D., Turjanski N., Bhattacharya S., et. al.: A proton magnetic resonance spectroscopy study of the striatum and cerebral cortex in Parkinson’s disease. Metab Brain Dis 1999; 14: pp. 45-55.
6. Davie C.A., Wenning G.K., Barker G.J., et. al.: Differentiation of multiple system atrophy from idiopathic Parkinson’s disease using proton magnetic resonance spectroscopy. Ann Neurol 1995; 37: pp. 204-210.
7. Tedeschi G., Litvan I., Bonavita S., et. al.: Proton magnetic resonance spectroscopic imaging in progressive supranuclear palsy, Parkinson’s disease and corticobasal degeneration. Brain 1997; 120: pp. 1541-1552.
8. O’Neil J., Schuff N., Marks W.J., et. al.: Quantitative 1H magnetic resonance spectroscopy and MRI of Parkinson’s disease. Movement Disord 2002; 17: pp. 917-927.
9. Summerfield C., Gómez-Ansón B., Tolosa E., et. al.: Dementia in Parkinson disease: a proton magnetic resonance spectroscopy study. Neurol Arch 2002; 59: pp. 1415-1420.
10. Jones D.K., Williams S.C., Gasston D., et. al.: Isotropic resolution diffusion tensor imaging with whole brain acquisition in a clinically acceptable time. Hum Brain Mapp 2002; 15: pp. 216-230.
11. Karagulle Kendi A.T., Lehericy S., Luciana M., et. al.: Altered diffusion in the frontal lobe in Parkinson disease. AJNR Am J Neuroradiol 2008; 29: pp. 501-505.
12. Chan L.L., Rumpel H., Yap K., et. al.: Case control study of diffusion tensor imaging in Parkinson’s disease. J Neurol Neurosurg Psychiatry 2007; 78: pp. 1383-1386.
13. Boska M.D., Hasan K.M., Kibuule D., et. al.: Quantitative diffusion tensor imaging detects dopaminergic neuronal degeneration in a murine model of Parkinson’s disease. Neurobiol Dis 2007; 26: pp. 590-596.
14. Fearnley J.M., Lees A.J.: Ageing and Parkinson’s disease: substantia nigra regional selectivity. Brain 1991; 114: pp. 2283-2301.
15. Martin W.R., Wieler M., Gee M.: Midbrain iron content in early Parkinson disease: a potential biomarker of disease status. Neurology 2008; 70: pp. 1411-1417.
16. Gelb D.J., Oliver E., Gilman S.: Diagnostic criteria for Parkinson’s disease. Arch Neurol 1999; 56: pp. 33-39.
17. Provencher S.W.: Estimation of metabolite concentrations from localised in vivo proton NMR spectra. Magn Reson Med 1993; 30: pp. 672-679.
18. Fayed N., Modrego P.J., Medrano J.: Comparative test-retest reliability of metabolite values assessed with magnetic resonance spectroscopy of the brain. The LCModel versus the manufacturer software. Neurol Res 2009; 31: pp. 472-477.
19. Basser P.J., Pierpaoli C.: Microstructural and physiological features of tissues elucidated by quantitative-diffusion-tensor MRI. J Magn Reson B 1996; 111: pp. 209-219.
20. Oikawa H., Sasaki M., Tamakawa Y., et. al.: The substantia nigra in Parkinson disease: proton density weighted spin-echo and fast short inversion time inversion recovery MR findings. AJNR Am J Neuroradiol 2002; 23: pp. 1747-1756.
21. Vaillancourt D.E., Spraker M.B., Prodoehl J., et. al.: High-resolution diffusion tensor imaging in the substantia nigra of de novo Parkinson disease. Neurology 2009; 72: pp. 1378-1384.
22. Abe O., Aoki S., Hayashi N., et. al.: Normal aging in the central nervous system: quantitative MR diffusion-tensor analysis. Neurobiol Aging 2002; 23: pp. 433-441.
23. Tievsky A.L., Ptak T., Farkas J.: Investigation of apparent diffusion coefficient and diffusion tensor anisotropy in acute and chronic multiple sclerosis lesions. Am J Neuroradiol 1999; 20: pp. 1491-1499.
24. Yoshikawa K., Nakata Y., Yamada K., et. al.: Early pathological changes in the parkinsonian brain demonstrated by diffusion tensor MRI. J Neurol Neurosurg Psychiatry 2004; 75: pp. 481-484.
25. Griffith H.R., Okonkwo O.C., O’Brien T., et. al.: Reduced brain glutamate in patients with Parkinson’s disease. NMR Biomed 2008; 21: pp. 381-387.
26. Oz G., Terpstra M., Tkác I., et. al.: Proton MRS of the unilateral substantia nigra in the human brain at 4 tesla: detection of high GABA concentrations. Magn Reson Med 2006; 55: pp. 296-301.
27. Kickler N., Krack P., Fraix V., et. al.: Glutamate measurement in Parkinson’s disease using MRS at 3 T field strength. NMR Biomed 2007; 20: pp. 757-762.
28. Taylor-Robinson S.D., Turjanski N., Bhattacharya S., et. al.: A proton magnetic resonance spectroscopy study of the striatum and cerebral cortex in Parkinson’s disease. Metab Brain Dis 1999; 14: pp. 45-55.
29. Clarke C.E., Lowry M., Horsman A.: Unchanged basal ganglia N-acetylaspartate and glutamate in idiopathic Parkinson’s disease measured by proton magnetic resonance spectroscopy. Mov Disord 1997; 12: pp. 297-301.
30. Clarke C.E., Lowry M.: Basal ganglia metabolite concentrations in idiopathic Parkinson’s disease and multiple system atrophy measured by proton magnetic resonance spectroscopy. Eur J Neurol 2000; 7: pp. 661-665.
31. Gruetter R., Weisdorf S.A., Rajanayagan V., et. al.: Resolution improvements in in vivo 1H NMR spectra with increased magnetic field strength. J Magn Reson 1998; 135: pp. 260-264.
32. Di Costanzo A., Trojsi F., Tosetti M., et. al.: High-field proton MRS of human brain. Eur J Radiol 2003; 48: pp. 146-153.
33. Kickler N., Krack P., Fraix V., et. al.: Glutamate measurement in Parkinson’s disease using MRS at 3 T field strength. NMR Biomed 2007; 20: pp. 757-762.
34. Schubert F., Gallinat J., Seifert F., et. al.: Glutamate concentrations in human brain using single voxel proton magnetic resonance spectroscopy at 3 Tesla. Neuroimage 2004; 21: pp. 1762-1771.
35. Coyle J.T., Bird S.J., Evans R.H., et. al.: Excitatory amino acid neurotoxins: selectively and mechanisms of action. Neurosci Res Prog 1981; 19: pp. 331-427.
36. Bosman D.K., Deutz N.E., De Graaf A.A., et. al.: Changes in brain metabolism during hyperammonemia and acute liver failure: Results of a comparative 1H NMR spectroscopy and biochemical investigation. Hepatology 1990; 12: pp. 281-290.
37. Häussinger D., Kircheis G., Fischer R., et. al.: Hepatic encephalopathy in chronic liver disease: a clinical manifestation of astrocyte swelling and low-grade cerebral edema?. J Hepatol 2000; 32: pp. 1035-1038.
38. Duchesne S., Rolland Y., Vérin M.: Automated computer differential classification in parkinsonian syndromes via pattern analysis on MRI. Acad Radiol 2009; 16: pp. 61-70.
39. Raff U., Hutchinson M., Rojas G.M., et. al.: Inversion recovery MRI in idiopathic Parkinson disease is a very sensitive tool to assess neurodegeneration in the substantia nigra: preliminary investigation. Acad Radiol 2006; 13: pp. 721-727.