
Rationale and Objectives
To compare differences in Medicare costs 1 year after initial computed tomographic colonography (CTC) or initial optical colonoscopy (OC).
Materials and Methods
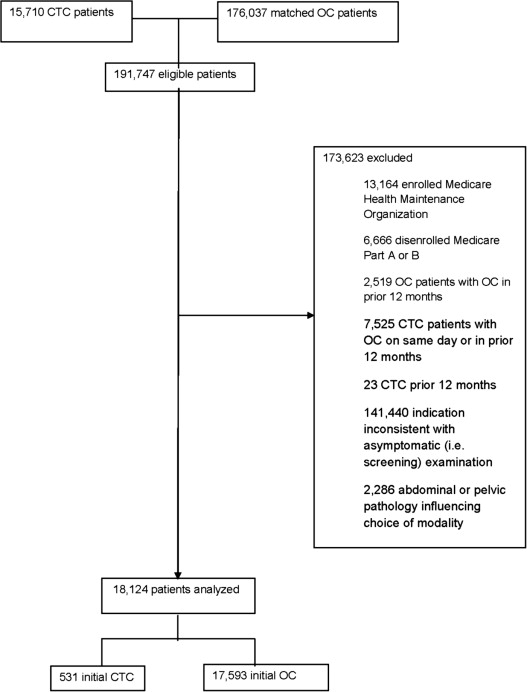
We performed a retrospective cohort study of asymptomatic Medicare outpatients aged ≥66 years who received initial CTC ( n = 531) or OC ( n = 17,593) between January 2007 and December 2008; initial OC patients were matched on county of residence and year of screening. Outcomes included differences in total inpatient and outpatient Medicare costs 1 year after initial CTC or OC and differences in outpatient testing of potential findings in the colon, abdomen, pelvis, and lungs.
Results
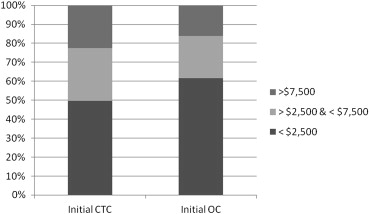
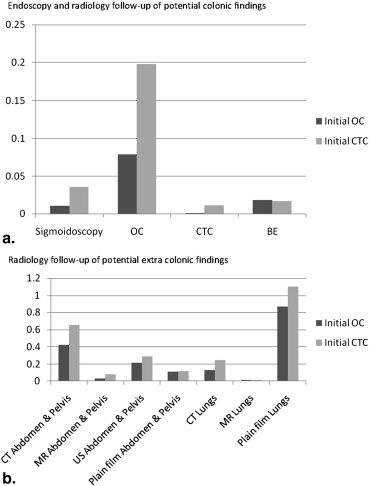
Higher adjusted costs per patient were revealed in the year after initial CTC compared to initial OC for outpatient testing related to potential colonic ($50; 95% confidence interval [CI], $12–$88; P = .010) and extracolonic findings ($64; 95% CI, $23–$106; P = .002). However, there were no differences in adjusted total costs per patient in the year after either modality ($2065; 95% CI, $1672–$5803; P = .28). Similarly, adjusted costs did not differ between cohorts for inpatient ($267; 95% CI, $1017–$1550; P = .68) or outpatient care ($2828; 95% CI, $311–$5966; P = .08).
Conclusions
Despite higher adjusted costs of outpatient testing potentially related to colonic and extracolonic findings among asymptomatic elderly patients 1 year after initial CTC compared to OC, we found no differences in adjusted total, inpatient, or outpatient costs between cohorts. Although Medicare does not cover screening CTC, our results suggest that these modalities generate comparable downstream costs to payers.
Computerized tomographic colonography (CTC) is an accurate and safe alternative to traditional or optical colonoscopy (OC) for colorectal cancer screening . CTC has the potential to reach the 40%–50% of the unscreened US population because patient preference and medical conditions have limited the uptake of OC in this population . However, in March 2009, the Centers for Medicare and Medicaid Services (CMS) decided against coverage for screening CTC among asymptomatic individuals. This decision was based, in part, on the scarcity of observed data regarding differences in outcomes and costs between patients who receive CTC and OC, in particular, differences related to follow-up testing of colonic and extracolonic findings on CTC . Current estimates of testing rates and costs related to the follow-up of colonic and extracolonic findings are derived from chart review. Moreover, these studies have not included control groups of patients who receive OC or who have no additional findings at the time of CTC to assess the incremental costs of these findings. Thus, our objective was to compare total, inpatient, and outpatient Medicare costs among asymptomatic elderly patients in the year after either initial CTC or OC (ie, screening population) between January 2007 and December 2008, in other words, the two years preceding the CMS decision about coverage for screening CTC. We additionally examined differences in costs attributable to testing plausibly related to colonic or extracolonic findings because of the impact of these findings on CTC.
Methods
Design Overview
We performed a retrospective cohort study using 100% Medicare fee-for-service claims files. All Medicare beneficiaries aged ≥66 years in the United States who received CTC between January 2007 and December 2008 were evaluated; an age cutoff of 66 years was selected to adjust for care in the preceding year. The CTC cohort was compared to a group of patients who received OC, randomly matched by county of residence and year of screening. CTC was not covered for routine screening during this time interval and was performed predominantly among patients at risk for OC due to existing medical conditions. Therefore, we approximated the screening population by selecting asymptomatic patients, defined as patients with no symptoms of colorectal cancer, and patients undergoing initial OC or CTC, defined as no CTC or OC in the preceding year. Claims were used to identify total, outpatient, and inpatient Medicare costs and testing and costs potentially related to outpatient colonic and extracolonic follow-up. We focused on costs to Medicare rather than costs to the patient (eg, copayment), the physician or the facility. Nearly, all potentially clinically significant colonic and extracolonic findings are evaluated within 1 year of detection . Therefore, we followed all patients for 1-year window from the date of either procedure.
Setting and Participants
Get Radiology Tree app to read full this article<
Outcomes and Follow-up Costs
Get Radiology Tree app to read full this article<
Get Radiology Tree app to read full this article<
Covariates
Get Radiology Tree app to read full this article<
Statistical Analysis
Get Radiology Tree app to read full this article<
Results
Get Radiology Tree app to read full this article<
Table 1
Patient Characteristics
Characteristic Initial CTC ( n = 531) Initial OC ( n = 17,593)P Value Demographic characteristics Gender Females 320 (60.3) 1,0493 (59.6) .770 Age (years) 66–74 315 (59.3) 12,189 (69.3) <.001 75–84 182 (34.3) 4986 (28.3) >85 34 (6.4) 418 (2.4) Race White 504 (94.9) 15,211 (86.5) <.001 Black 16 (3.0) 1277 (7.3) Other 11 (2.1) 1105 (6.3) Common elixhauser comorbidities Coronary artery disease 34 (6.4) 474 (2.7) <.001 Hypertension 55 (10.4) 1299 (7.4) .01 Chronic lung disease 20 (3.8) 314 (1.8) .001 Diabetes mellitus w/o complications 16 (3.0) 384 (2.2) .200 Hypothyroidism 14 (2.6) 246 (1.4) .02 Fluid and electrolyte disorders 13 (2.4) 413 (2.3) .880 Deficiency anemia 15 (2.8) 244 (1.4) .006 Socioeconomic characteristics Mean % of persons with college-level education by county of residence 32.43 (±11.3) 30.25 (±11.0) <.001 Mean household income by county of residence $51,796.34 (±$12,889.5) $50,615.20 (±$12,933.7) 0.04 Health care access Mean total Medicare Part A and B reimbursements by county of residence (2010) $8876.95 (±$1486.7) $9035.00 (±$1466.0) .014 Metropolitan/rural Rural 86 (16.2) 2566 (14.7) .320 Metropolitan 444 (83.8) 14,928 (85.3) Census region Northeast 101 (19.3) 3670 (21.1) .490 Midwest 117 (22.4) 3550 (20.4) South 184 (35.2) 6390 (36.7) West 121 (23.1) 3805 (21.8)
CTC, computed tomographic colonography; OC, optical colonoscopy.
Get Radiology Tree app to read full this article<
Get Radiology Tree app to read full this article<
Table 2
Unadjusted Median Total Costs in the Year Before or After Colorectal Evaluation by Type of Colorectal Evaluation (95% CI)
Time Period and Type of Colorectal Evaluation Total (95% CI) Difference_P_ Value ∗ 12 Months before CTC first line $1826 ($1592–$2076) $589 <.0001 OC first line $1237 ($1208–$1267) 12 Months after CTC first line $2264 ($2000–$2558) $764 <.0001 OC first line $1500 ($1466–$1531)
CI, confidence interval; CTC, computed tomographic colonography; OC, optical colonoscopy.
Get Radiology Tree app to read full this article<
Table 3
Adjusted Total, Inpatient and Outpatient Costs by Type of Colorectal Evaluation (95% CI) ∗
Care Setting Adjusted Costs Difference_P_ Value Total CTC first line $16,355 ($5661 to $27,048) $2065 (−$1672 to $5803) .280 OC first line $14,289 ($5369 to $23,209) Inpatient CTC first line $3117 ($1725 to $4509) $267 (−$1017 to $1550) .680 OC first line $2850 ($2254 to $3447) Outpatient Overall CTC first line $20,646 ($5688 to $32,603) $2828 (−$311 to $5966) .080 OC first line $17,818 ($7665 to $27,971) Evaluation CTC first line $10,637 ($4386 to $16,888) $1319 (−$100 to $2739) .070 OC first line $9317 ($3879 to $17,456) Anesthesiology CTC first line $58 ($45 to $71) $9 (−$5 to $22) .200 OC first line $49 ($47 to $51) Surgery CTC first line $1022 ($729 to $1314) $75 (−$119 to $270) .450 OC first line $946 ($736 to $1157) Radiology CTC first line $15,570 (−$11,421 to $42,561) $1433 (−$2545 to $5411) .480 OC first line $14,137 (−$10,264 to $38,539) Pathology CTC first line $5119 ($1539 to $8699) $667 (−$89 to $1423) .080 OC first line $4452 ($1362 to $7542) Medicine CTC first line $183,954 (−$45,651 to $413,559) $12,921 (−$20,355 to $46,197) .480 OC first line $171,033 (−$42,274 to $384,341)
CI, confidence interval; CTC, computed tomographic colonography; OC, optical colonoscopy.
Get Radiology Tree app to read full this article<
Get Radiology Tree app to read full this article<
Get Radiology Tree app to read full this article<
Get Radiology Tree app to read full this article<
Get Radiology Tree app to read full this article<
Get Radiology Tree app to read full this article<
Get Radiology Tree app to read full this article<
Table 4
Adjusted outpatient Colonic and Extracolonic Costs by Type of Colorectal Evaluation (95% CI) ∗
Type of Testing and of Colorectal Evaluation Adjusted Costs Difference_P_ Value Outpatient colonic testing CTC first line $71 ($33–$109) $50 ($12–$88) .010 OC first line $21 ($19–$24) Outpatient extracolonic testing CTC first line $182 ($139–$225) $64 ($23–$106) .002 OC first line $118 ($107–$128)
CI, confidence interval; CTC, computed tomographic colonography; OC, optical colonoscopy.
Get Radiology Tree app to read full this article<
Get Radiology Tree app to read full this article<
Discussion
Get Radiology Tree app to read full this article<
Get Radiology Tree app to read full this article<
Get Radiology Tree app to read full this article<
Get Radiology Tree app to read full this article<
Get Radiology Tree app to read full this article<
Get Radiology Tree app to read full this article<
Supplementary Data
Get Radiology Tree app to read full this article<
Supplementary Table 1
Get Radiology Tree app to read full this article<
Get Radiology Tree app to read full this article<
Get Radiology Tree app to read full this article<
References
1. Pickhardt P.J., Choi J.R., Hwang I., et. al.: Computed tomographic virtual colonoscopy to screen for colorectal neoplasia in asymptomatic adults. N Engl J Med 2003; 349: pp. 2191-2200.
2. Johnson C.D., Chen M.H., Toledano A.Y., et. al.: Accuracy of CT colonography for detection of large adenomas and cancers. N Engl J Med 2008; 359: pp. 1207-1217.
3. Kim D.H., Pickhardt P.J., Taylor A.J., et. al.: CT colonography versus colonoscopy for the detection of advanced neoplasia. N Engl J Med 2007; 357: pp. 1403-1412.
4. Kim D.H., Pickhardt P.J., Hanson M.E., et. al.: CT colonography: performance and program outcome measures in an older screening population. Radiology 2010; 254: pp. 493-500.
5. Gluecker T.M., Johnson C.D., Wilson L.A., et. al.: Extracolonic findings at CT colonography: evaluation of prevalence and cost in a screening population. Gastroenterology 2003; 124: pp. 911-916.
6. CDC. Percentage of adults aged 50–75 years who reported being up-to-date* with colorectal test screening, by State Behavioral Risk Factor Surveillance System, United States, 2010. 2010; http://www.cdc.gov/cancer/colorectal/statistics/screening_rates.htm . Accessed January 20 2015.
7. Cancer screening—United States, 2010. MMWR Morb Mortal Wkly Rep 2012; 61: pp. 41-45.
8. Schwartz D.C., Dasher K.J., Said A., et. al.: Impact of a CT colonography screening program on endoscopic colonoscopy in clinical practice. Am J Gastroenterol 2008; 103: pp. 346-351.
9. Svensson M.H., Svensson E., Lasson A., et. al.: Patient acceptance of CT colonography and conventional colonoscopy: prospective comparative study in patients with or suspected of having colorectal disease. Radiology 2002; 222: pp. 337-345.
10. Taylor S.A., Halligan S., Saunders B.P., et. al.: Acceptance by patients of multidetector CT colonography compared with barium enema examinations, flexible sigmoidoscopy, and colonoscopy. AJR Am J Roentgenol 2003; 181: pp. 913-921.
11. Cotton P.B., Durkalski V.L., Pineau B.C., et. al.: Computed tomographic colonography (virtual colonoscopy): a multicenter comparison with standard colonoscopy for detection of colorectal neoplasia. JAMA 2004; 291: pp. 1713-1719.
12. Pooler B.D., Baumel M.J., Cash B.D., et. al.: Screening CT colonography: multicenter survey of patient experience, preference, and potential impact on adherence. AJR Am J Roentgenol 2012; 198: pp. 1361-1366.
13. Knudsen A.B., Lansdorp-Vogelaar I., Rutter C.M., et. al.: Cost-effectiveness of computed tomographic colonography screening for colorectal cancer in the medicare population. Journal of the National Cancer Institute 2010; 102: pp. 1238-1252.
14. MEDCAC transcript computed tomography colonography. 2008; http://www.cms.gov/medicare-coverage-database/details/medcac-meetingdetilas.aspx?MEDCACId=45&year=All&bc=AAAIAAAAAAAAAA%3d%3d& . Accessed November 20 2013.
15. Berland L.L., Silverman S.G., Gore R.M., et. al.: Managing incidental findings on abdominal CT: white paper of the ACR incidental findings committee. J Am Coll Radiol 2010; 7: pp. 754-773.
16. MacMahon H., Austin J.H., Gamsu G., et. al.: Guidelines for management of small pulmonary nodules detected on CT scans: a statement from the Fleischner Society. Radiology 2005; 237: pp. 395-400.
17. Dachman A.H., Yee J.: The challenges of CT colonography reimbursement. J Am Coll Radiol 2013; 10: pp. 937-942.
18. Ko C.W., Dominitz J.A., Neradilek M., et. al.: Determination of colonoscopy indication from administrative claims data. Med Care 2012; 52: pp. e21-e29.
19. Zafar H.M., Yang J., Harhay M., et. al.: Predictors of CT colonography utilization among asymptomatic medicare beneficiaries. J Gen Intern Med 2013; 28: pp. 1208-1214.
20. Elixhauser A., Steiner C., Harris D.R., et. al.: Comorbidity measures for use with administrative data. Med Care 1998; 36: pp. 8-27.
21. Devoe J.E., Baez A., Angier H., et. al.: Insurance + access not equal to health care: typology of barriers to health care access for low-income families. Annals of family medicine 2007; 5: pp. 511-518.
22. Zuvekas S.H., Taliaferro G.S.: Pathways to access: health insurance, the health care delivery system, and racial/ethnic disparities, 1996-1999. Health affairs 2003; 22: pp. 139-153.
23. Grant E.N., Lyttle C.S., Weiss K.B.: The relation of socioeconomic factors and racial/ethnic differences in US asthma mortality. American journal of public health 2000; 90: pp. 1923-1925.
24. Larson S.L., Fleishman J.A.: Rural-urban differences in usual source of care and ambulatory service use: analyses of national data using Urban Influence Codes. Med Care 2003; 41: pp. III65-III74.
25. Duszak R., Kim D.H., Pickhardt P.J.: Expanding utilization and regional coverage of diagnostic CT colonography: early Medicare claims experience. J Am Coll Radiol 2011; 8: pp. 235-241.
26. Cooper G.S., Koroukian S.M.: Geographic variation among Medicare beneficiaries in the use of colorectal carcinoma screening procedures. Am J Gastroenterol 2004; 99: pp. 1544-1550.
27. Fisher E.S., Wennberg D.E., Stukel T.A., et. al.: The implications of regional variations in Medicare spending. Part 2: health outcomes and satisfaction with care. Ann Intern Med 2003; 138: pp. 288-298.
28. Fisher E.S., Wennberg D.E., Stukel T.A., et. al.: The implications of regional variations in Medicare spending. Part 1: the content, quality, and accessibility of care. Ann Intern Med 2003; 138: pp. 273-287.
29. Dartmouth Atlas of Health Care. http://www.dartmouthatlas.org/tools/downloads.aspx . Accessed January 20 2015.
30. Manning W.G., Mullahy J.: Estimating log models: to transform or not to transform?. Journal of health economics 2001; 20: pp. 461-494.
31. Kleinman L.C., Norton E.C.: What’s the Risk? A simple approach for estimating adjusted risk measures from nonlinear models including logistic regression. Health services research 2009; 44: pp. 288-302.
32. Pickhardt P.J., Hanson M.E., Vanness D.J., et. al.: Unsuspected extracolonic findings at screening CT colonography: clinical and economic impact. Radiology 2008; 249: pp. 151-159.
33. Chin M., Mendelson R., Edwards J., et. al.: Computed tomographic colonography: prevalence, nature, and clinical significance of extracolonic findings in a community screening program. Am J Gastroenterol 2005; 100: pp. 2771-2776.
34. Hara A.K., Johnson C.D., MacCarty R.L., et. al.: Incidental extracolonic findings at CT colonography. Radiology 2000; 215: pp. 353-357.
35. Kimberly J.R., Phillips K.C., Santago P., et. al.: Extracolonic findings at virtual colonoscopy: an important consideration in asymptomatic colorectal cancer screening. J Gen Intern Med 2009; 24: pp. 69-73.
36. Yee J., Kumar N.N., Godara S., et. al.: Extracolonic abnormalities discovered incidentally at CT colonography in a male population. Radiology 2005; 236: pp. 519-526.
37. Tolan D.J., Armstrong E.M., Chapman A.H.: Replacing barium enema with CT colonography in patients older than 70 years: the importance of detecting extracolonic abnormalities. AJR Am J Roentgenol 2007; 189: pp. 1104-1111.
38. Veerappan G.R., Ally M.R., Choi J.H., et. al.: Extracolonic findings on CT colonography increases yield of colorectal cancer screening. AJR Am J Roentgenol 2010; 195: pp. 677-686.
39. Atkin W., Dadswell E., Wooldrage K., et. al.: Computed tomographic colonography versus colonoscopy for investigation of patients with symptoms suggestive of colorectal cancer (SIGGAR): a multicentre randomised trial. Lancet 2013; 381: pp. 1194-1202.
40. Halligan S.: CT colonography for investigation of patients with symptoms potentially suggestive of colorectal cancer: a review of the UK SIGGAR trials. The British journal of radiology 2013; 86: pp. 20130137.
41. Heresbach D., Chauvin P., Hess-Migliorretti A., et. al.: Cost-effectiveness of colorectal cancer screening with computed tomography colonography according to a polyp size threshold for polypectomy. European journal of gastroenterology & hepatology 2010; 22: pp. 716-723.
42. Pickhardt P.J., Hassan C., Laghi A., et. al.: Cost-effectiveness of colorectal cancer screening with computed tomography colonography: the impact of not reporting diminutive lesions. Cancer 2007; 109: pp. 2213-2221.
43. Heitman S.J., Manns B.J., Hilsden R.J., et. al.: Cost-effectiveness of computerized tomographic colonography versus colonoscopy for colorectal cancer screening. CMAJ 2005; 173: pp. 877-881.
44. Ladabaum U., Song K., Fendrick A.M.: Colorectal neoplasia screening with virtual colonoscopy: when, at what cost, and with what national impact?. Clin Gastroenterol Hepatol 2004; 2: pp. 554-563.
45. Sonnenberg F.A., Gregory P., Yomtovian R., et. al.: The cost-effectiveness of autologous transfusion revisited: implications of an increased risk of bacterial infection with allogeneic transfusion. Transfusion 1999; 39: pp. 808-817.
46. Vijan S., Hwang I., Inadomi J., et. al.: The cost-effectiveness of CT colonography in screening for colorectal neoplasia. Am J Gastroenterol 2007; 102: pp. 380-390.
47. Hassan C., Pickhardt P.J., Laghi A., et. al.: Computed tomographic colonography to screen for colorectal cancer, extracolonic cancer, and aortic aneurysm: model simulation with cost-effectiveness analysis. Arch Intern Med 2008; 168: pp. 696-705.