
Rationale and Objectives
We investigated the effects of small focal spot (SFS) imaging and iterative model reconstruction (IMR) on the image quality of computed tomography angiographs (CTA) in patients with peripheral arterial disease.
Materials and Methods
We divided 60 consecutive patients with suspected or confirmed peripheral artery disease into two equal groups. One group underwent large focal spot scanning under our standard CTA protocol with hybrid iterative reconstruction (iDose 4 ) (protocol 1), and the other underwent scanning with the SFS protocol and IMR (protocol 2). Quantitative image quality parameters, ie, arterial computed tomography attenuation, image noise, and the contrast-to-noise ratio, were compared and the visual image quality (depiction of each vessel) was scored on a 5-point scale.
Results
There was no significant difference in the arterial attenuation among all evaluated slice levels. The mean image noise was significantly lower under protocol 2 and the contrast-to-noise ratio was significantly higher at all slice levels. The visual scores assigned to the two protocols for the depiction of large vessels, such as the abdominal aorta and iliac artery, were comparable. However, the mean visual scores for small vessels in the lower extremities were significantly higher under protocol 2.
Conclusion
CTA with SFS and IMR yielded significantly better qualitative and quantitative image quality especially for small vessels.
Introduction
Peripheral artery disease (PAD) is a common, chronic, progressive health problem . It affects up to 8.5 million (7.2%) Americans in their 40s and is associated with significant morbidity and mortality . The 5-, 10-, and 15-year morbidity and mortality rates from all causes in patients with PAD are approximately 30%, 50%, and 70%, respectively. Coronary artery disease is the most common cause of death amongpatients with PAD (40%–60%); cerebral artery disease accounts for 10%–20% of deaths . Early diagnosis and appropriate medical intervention can mitigate limb-specific symptoms, improve the quality of life, and decrease systemic cardiovascular risks .
Digital subtraction angiography (DSA) is considered the reference standard for diagnosing PAD. However, it is invasive and carries limitations and risks . Computed tomography angiography (CTA), a less invasive and safer examination, is an alternative to DSA and has gained widespread clinical acceptance for diagnosing PAD . Although CTA of lower extremities is more sensitive, specific, and accurate for assessing the location and extent of peripheral artery stenosis than DSA , its spatial resolution is inferior to DSA, and the visualization of small vessels, such as the peripheral small artery and collateral vessels, is suboptimal.
Get Radiology Tree app to read full this article<
Get Radiology Tree app to read full this article<
Get Radiology Tree app to read full this article<
Materials and Methods
Get Radiology Tree app to read full this article<
Study Population
Get Radiology Tree app to read full this article<
Table 1
Patient Demographics
LFS Protocol ( n = 30) (Protocol 1) SFS Protocol ( n = 30) (Protocol 2)P Value Sex (male/female) 21/9 20/10 0.72 Age (y) 72.8 ± 8.6 74.1 ± 9.3 0.55 Body height (cm) 157.6 ± 7.9 158.9 ± 8.3 0.53 Body weight (kg) 61.2 ± 13.0 59.7 ± 15.9 0.70 Body mass index (kg/m 2 ) 24.5 ± 4.3 23.4 ± 4.6 0.34 eGFR (mL/min/1.73 m 2 ) 33.1 ± 30.4 32.5 ± 30.8 0.94
eGFR, estimated glomerular filtration rate; LFS, large focal spot; SFS, small focal spot.
Note: Data are mean ± standard deviation.
Get Radiology Tree app to read full this article<
CT Scanning and Contrast Infusion Protocols
Get Radiology Tree app to read full this article<
Table 2
Imaging and Contrast Material Parameters of the LFS and the SFS Protocols
LFS Protocol (Protocol 1) SFS Protocol (Protocol 2) CT scanner 256-slice CT (Brilliance iCT, Philips Healthcare) Collimation 128 × 0.625 mm Tube voltage 100 kVp Effective tube current 231 eff. mAs (reference) with auto-modulation Rotation time 0.75 s/rot Helical pitch 0.585 Total amount of contrast medium 500 mgI/mL Injection duration 25 s Bolus tracking trigger 150 HU (abdominal aorta) Scan delay 15 s Image reconstruction iDose 4 IMR Section thickness/interval 1.0/0.5 mm
CT, computed tomography; IMR, iterative model reconstruction; LFS, large focal spot; SFS, small focal spot.
Get Radiology Tree app to read full this article<
CT Image Reconstruction
Get Radiology Tree app to read full this article<
Quantitative Image Quality Analysis
Get Radiology Tree app to read full this article<
CNR=(HUA−HUM)/image noise, CNR
=
(
HU
A
−
HU
M
)
/
image noise
,
where HU A and HU M are the CT attenuation in the artery and muscle, respectively, and HU M is the CT attenuation in the muscle. These parameters were compared in protocols 1 and 2.
Get Radiology Tree app to read full this article<
Qualitative Image Quality Analysis
Get Radiology Tree app to read full this article<

Get Radiology Tree app to read full this article<
CT Radiation Dose
Get Radiology Tree app to read full this article<
Statistical Analysis
Get Radiology Tree app to read full this article<
Results
Quantitative Image Quality Analysis
Get Radiology Tree app to read full this article<

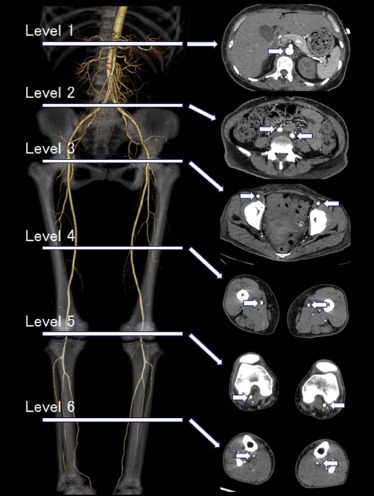
![Figure 4, A 66-year-old man with a body mass index (BMI) of 25.9 kg/m 2 (a) and a 61-year-old woman with a BMI of 25.7 kg/m 2 (b) with peripheral artery disease. Transverse computed tomography images obtained at six slice levels for quantitative image quality analysis under standard large focal spot (LFS) protocol (a) and the small focal spot (SFS) protocol with iterative model reconstruction (IMR) (b) in a optimized window setting (width, 850 HU; level, 250 HU). On computed tomography angiographic images acquired with the SFS protocol with IMR, image noise was reduced compared to images obtained with the standard LFS protocol (11.4 HU and 25.1 HU, respectively, at the abdominal aorta level [level 1]).](https://storage.googleapis.com/dl.dentistrykey.com/clinical/CTAngiographyinPatientswithPeripheralArterialDisease/3_1s20S1076633216300903.jpg)
Get Radiology Tree app to read full this article<
Qualitative Image Quality Analysis
Get Radiology Tree app to read full this article<
Table 3
Qualitative Assessment of Image Quality
LFS Protocol (Protocol 1) SFS Protocol (Protocol 2)P Value Abdominal aorta 4.9 ± 0.3 5.0 ± 0.0 0.51 Renal artery 4.4 ± 0.8 4.7 ± 0.6 0.08 Common-external iliac artery 4.7 ± 0.5 4.9 ± 0.2 0.08 Internal iliac artery 4.2 ± 0.6 4.7 ± 0.5 <0.01 Superior-inferior gluteal artery 3.4 ± 0.6 4.2 ± 0.7 <0.01 Superficial femoral artery-popliteal artery 4.3 ± 0.5 4.8 ± 0.4 <0.01 Deep femoral artery 4.2 ± 0.6 4.8 ± 0.4 <0.01 Descending branch of the lateral femoral circumflex artery 3.7 ± 0.4 4.4 ± 0.7 <0.01 Descending genicular artery 3.6 ± 0.6 4.5 ± 0.7 <0.01 Tibial artery 3.8 ± 0.7 4.3 ± 0.8 <0.01 Dorsalis pedis artery 3.5 ± 0.7 4.2 ± 0.7 <0.01
LFS, large focal spot; SFS, small focal spot.
Data are mean ± standard deviation.
Get Radiology Tree app to read full this article<
CT Radiation Dose
Get Radiology Tree app to read full this article<
Discussion
Get Radiology Tree app to read full this article<
Get Radiology Tree app to read full this article<
Get Radiology Tree app to read full this article<
Get Radiology Tree app to read full this article<
Get Radiology Tree app to read full this article<
Get Radiology Tree app to read full this article<
References
1. Dhaliwal G., Mukherjee D.: Peripheral arterial disease: epidemiology, natural history, diagnosis and treatment. Int J Angiol 2007; 16: pp. 36-44.
2. Allison M.A., Ho E., Denenberg J.O., et. al.: Ethnic-specific prevalence of peripheral arterial disease in the United States. Am J Prev Med 2007; 32: pp. 328-333.
3. Norgren L., Hiatt W.R., Dormandy J.A., et. al.: Inter-society consensus for the management of peripheral arterial disease (TASC II). J Vasc Surg 2007; 45: pp. S5-S67.
4. Hirsch A.T., Criqui M.H., Treat-Jacobson D., et. al.: Peripheral arterial disease detection, awareness, and treatment in primary care. JAMA 2001; 286: pp. 1317-1324.
5. Pollak A.W., Norton P.T., Kramer C.M.: Multimodality imaging of lower extremity peripheral arterial disease: current role and future directions. Circ Cardiovasc Imaging 2012; 5: pp. 797-807.
6. Heijenbrok-Kal M.H., Kock M.C., Hunink M.G.: Lower extremity arterial disease: multidetector CT angiography meta-analysis. Radiology 2007; 245: pp. 433-439.
7. Haidekker M.A.: Medical imaging technology.1st ed.2013.SpringerNew York
8. Oda S., Utsunomiya D., Funama Y., et. al.: A knowledge-based iterative model reconstruction algorithm: can super-low-dose cardiac CT be applicable in clinical settings?. Acad Radiol 2014; 21: pp. 104-110.
9. Brown K.M., Zabic S., Koehler T.: Acceleration of ML iterative algorithms for CT by the use of fast start images. Proc SPIE 2012; 8313: pp. 831339.
10. Oda S., Weissman G., Vembar M., et. al.: Iterative model reconstruction: improved image quality of low-tube-voltage prospective ECG-gated coronary CT angiography images at 256-slice CT. Eur J Radiol 2014; 83: pp. 1408-1415.
11. Oh L.C., Lau K.K., Devapalasundaram A., et. al.: Efficacy of “fine” focal spot imaging in CT abdominal angiography. Eur Radiol 2014; 24: pp. 3010-3016.
12. Geyer L.L., Schoepf U.J., Meinel F.G., et. al.: State of the art: iterative CT reconstruction techniques. Radiology 2015; 276: pp. 339-357.
13. Oda S., Utsunomiya D., Funama Y., et. al.: A hybrid iterative reconstruction algorithm that improves the image quality of low-tube-voltage coronary CT angiography. AJR Am J Roentgenol 2012; 198: pp. 1126-1131.
14. Itatani R., Oda S., Utsunomiya D., et. al.: Reduction in radiation and contrast medium dose via optimization of low-kilovoltage CT protocols using a hybrid iterative reconstruction algorithm at 256-slice body CT: phantom study and clinical correlation. Clin Radiol 2013; 68: pp. e128-e135.
15. Oda S., Weissman G., Vembar M., et. al.: Cardiac CT for planning redo cardiac surgery: effect of knowledge-based iterative model reconstruction on image quality. Eur Radiol 2015; 25: pp. 58-64.
16. Uchida M.: High-quality three-dimensional computed tomography angiography of abdominal viscera with small focal spot, low tube voltage, and iterative model reconstruction technique. O J Rad 2015; 5: pp. 8-12.