
Rationale and Objectives
Pulmonary hypertension (PH) is a complex and fatal disease that is difficult to diagnose noninvasively. This study evaluated previously published computed tomography–based vessel measurement criteria and investigated the predictive power and diagnostic ability of the main pulmonary artery diameter (MPAD) and the ratio of MPAD to aorta diameter (rPA).
Materials and Methods
The database for this study consisted of 175 PH patients (for whom mean pulmonary artery pressure [mPAP] was known), 16 patients without PH but with known mPAP (non-PH patients), and 114 “normal” patients without known mPAP. The performance of previously published criteria, MPAD > 29 mm and rPA > 1, was determined. The relationship between vessel measurements and mPAP was evaluated through correlation and linear regression analysis. The ability of these measurements to discriminate between patients with and without PH was determined by receiver operating characteristic analysis.
Results
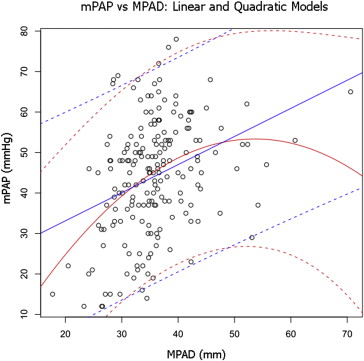
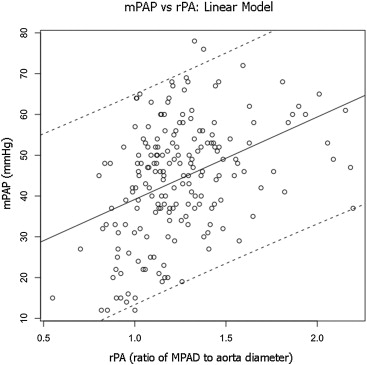
For discriminating between PH and “normal” patients, the sensitivity and specificity of the criterion MPAD > 29 mm were 0.89 (0.84–0.93) and 0.83 (0.76–0.90), respectively, and the sensitivity and specificity of the criterion rPA > 1 were 0.89 (0.85–0.94) and 0.82 (0.74–0.89), respectively. At a specificity of 0.95 in the task of separating PH and “normal” patients, the sensitivity of MPAD was 0.81 (0.72–0.90) and the sensitivity of rPA was 0.76 (0.66–0.85), but the specificity for both decreased when non-PH patients were included. For the combined PH and non-PH patient groups, the correlation between the vessel measurements and mPAP was significant but low, and the ability of the vessel measurements to predict mPAP was limited.
Conclusion
This study found that the sensitivity of previously published vessel criteria for identifying PH patients is high, but the specificity may not be high enough for routine use in a clinical patient population.
Pulmonary hypertension (PH) is a fatal disease that is not diagnosed early because patients typically present to their doctor with symptoms associated with advanced disease . PH has a wide range of etiologies and requires a complex clinical classification scheme . PH is classified into five groups. PH group 1, which is known as pulmonary arterial hypertension (PAH), includes idiopathic PAH and heritable PAH among others, and PH groups 2–5 include PH resulting from left heart disease, lung diseases and/or hypoxia, chronic thromboembolic disease, or unclear multifactorial mechanisms, respectively. A mean arterial pulmonary pressure (mPAP) > 25 mm Hg at rest or > 30 mm Hg with exercise as determined by right heart catheterization (RHC) is required but not sufficient to be diagnosed with PH because additional criteria must be met .
PH has nonspecific symptoms that make it difficult to diagnose noninvasively. Consequently, patient evaluation normally requires numerous diagnostic tests. The diagnostic evaluation of PH includes physical examination, electrocardiography, pulmonary function tests, blood gas analysis, ventilation/perfusion scan, echocardiography, and RHC with vasodilatory testing. Although RHC is the gold standard for the diagnosis of PH , it is an invasive procedure. Echocardiography is a noninvasive means to assess heart function and blood pressures, but the accuracy of the pressure measurements obtained through echocardiography is suboptimal because of differences when compared with RHC .
Get Radiology Tree app to read full this article<
Get Radiology Tree app to read full this article<
Materials and methods
Get Radiology Tree app to read full this article<
Get Radiology Tree app to read full this article<
Get Radiology Tree app to read full this article<
![Figure 1, Vessel measurements obtained from computed tomography scans. (a) The diameter of an enlarged pulmonary artery (PA) from an idiopathic pulmonary arterial hypertension patient (compare with the aorta [A] diameter). (b) An A and PA diameter from a “normal” patient.](https://storage.googleapis.com/dl.dentistrykey.com/clinical/CTBasedPulmonaryArteryMeasurementsfortheAssessmentofPulmonaryHypertension/0_1s20S1076633213005941.jpg)
Get Radiology Tree app to read full this article<
Statistics
Get Radiology Tree app to read full this article<
Get Radiology Tree app to read full this article<
Get Radiology Tree app to read full this article<
Results
Get Radiology Tree app to read full this article<
Table 1
Summary of Patient Demographic and Clinical Information
Patient Group Total Male/Female Mean Age (Range) (y) CT Scan Infused/Noninfused Mean mPAP (Range) (mm Hg) Mean PCWP (Range) (mm Hg) Mean BSA (m 2 ) PH 175 42/133 54 (14–86) 125/50 46 (15–78) 13 (1–45) 1.9 (1.3–2.6) Non-PH 16 5/11 57 (27–79) 11/5 18 (12–37) 10 (5–32) 1.9 (1.5–2.4) “Normal” 114 49/65 47 (13–83) 114/0 N/A N/A N/A
BSA, body surface area; CT, computed tomography; mPAP, mean pulmonary artery pressure; PCWP, pulmonary capillary wedge pressure; PH, pulmonary hypertension.
Table 2
Distribution of PH Patients ( n = 175) by Clinical Classification
Total Clinical Classification of PH 89 1. PAH IPAH/HPAH_n_ = 28 Associated with CTD_n_ = 36 Associated with portal hypertension_n_ = 13 Associated with congenital heart_n_ = 6 Other within PAH_n_ = 6 5 1′. PVOD and/or PCH 33 2. PHLHD 10 3. PH owing to lung diseases and/or hypoxia 19 4. CTEPH 19 5. PH with unclear multifactorial mechanisms Sarcoidosis_n_ = 17 Other_n_ = 2
CTD, connective tissue disease; CTEPH, chronic thromboembolic pulmonary hypertension; HPAH, heritable PAH; IPAH, idiopathic PAH; PAH, pulmonary arterial hypertension; PCH, pulmonary capillary hemangiomatosis; PHLHD, PH owing to left heart disease; PVOD, pulmonary veno-occlusive disease.
Get Radiology Tree app to read full this article<
Demographics
Get Radiology Tree app to read full this article<
Table 3
Vessel Measurements by Patient Group
Patient Group Total MPAD (mm) Mean ± SD (Range)P ∗ rPA Mean ± SD (Range)P ∗ Aorta (mm) Mean ± SD (Range)P ∗ PH 175 36.4 ± 6.68 (24.2–70.6) < .05 1.27 ± 0.28 (0.70–2.20) < .05 29.3 ± 4.37 (18.8–39.9) .2 Non-PH 16 28.6 ± 5.48 (17.7–35.6) 0.98 ± 0.17 (0.55–1.26) 29.4 ± 3.44 (22.9–36.1) “Normal” 114 24.9 ± 3.66 (17.7–34.0) 0.87 ± 0.13 (0.56–1.24) 29.0 ± 4.40 (17.3–44.3) “Normal” + non-PH 130 25.4 ± 4.08 (17.7–35.6) 0.88 ± 0.14 (0.55–1.26) 29.1 ± 4.28 (17.3–44.3)
Aorta, diameter of the aorta; MPAD, main pulmonary artery diameter; PH, pulmonary hypertension; rPA, ratio of MPAD to aorta diameter; SD, standard deviation.
MPAD and aorta were measured at the level of the bifurcation of the main pulmonary artery on the same computed tomography section. P values are based on Student t -test.
Get Radiology Tree app to read full this article<
Table 4
Sensitivity or Specificity (with 95% Confidence Intervals) Obtained from Application of the Previously Reported Vessel Measurement Criteria for PH Diagnosis to the Present Patient Cohort
Patient group Vessel Measurement Criteria MPAD > 29 mm rPA > 1 PH (sensitivity) 0.89 (0.84–0.93) 0.89 (0.85–0.94) “Normal” (specificity) 0.83 (0.76–0.90) 0.82 (0.74–0.89) “Normal” + non-PH (specificity) 0.79 (0.71–0.86) 0.79 (0.71–0.86)
MPAD, main pulmonary artery diameter; PH, pulmonary hypertension; rPA, ratio of MPAD to aorta diameter.
Get Radiology Tree app to read full this article<
Correlations and Linear Regression Analyses
Get Radiology Tree app to read full this article<
Table 5
Pearson/Spearman Correlation Coefficients Relating mPAP to Vessel Measurements for the Combined PH and non-PH Patient Groups and for Different PH Subgroups
Patient Group MPAD rPA PH + non-PH 0.34 ∗ /0.35 ∗ 0.40 ∗ /0.40 ∗ IPAH/HPAH 0.093/−0.14 0.034/−0.019 CTD 0.19/0.35 ∗ 0.12/0.20 PHLHD 0.32/0.35 ∗ 0.40 ∗ /0.30 CTEPH 0.43/0.49 ∗ 0.39/0.43
CTD, connective tissue disease; CTEPH, chronic thromboembolic pulmonary hypertension; HPAH, heritable PAH; IPAH, idiopathic PAH; MPAD, main pulmonary artery diameter; PAH, pulmonary arterial hypertension; PH, pulmonary hypertension; PHLHD, PH owing to left heart disease; rPA, ratio of MPAD to aorta diameter.
Get Radiology Tree app to read full this article<
Get Radiology Tree app to read full this article<
Get Radiology Tree app to read full this article<
Get Radiology Tree app to read full this article<
Get Radiology Tree app to read full this article<
Get Radiology Tree app to read full this article<
ROC Analyses
Get Radiology Tree app to read full this article<
Table 6
AUC Values (with 95% Confidence Intervals) Obtained from ROC Analysis Performed to Evaluate the Ability of Vessel Measurements to Distinguish between Different Patient Groups
Classification Task Vessel Measurement MPAD rPA PH versus “normal” 0.96 (0.94–0.98) 0.94 (0.91–0.96) PH versus “normal” + non-PH 0.94 (0.92–0.97) 0.92 (0.90–0.95) IPAH/HPAH versus “normal” 0.98 (0.94–1.00) 0.97 (0.93–1.00) CTD versus “normal” 0.92 (0.87–0.98) 0.88 (0.81–0.96) PHLHD versus “normal” 0.98 (0.95–1.00) 0.92 (0.86–0.98) CTEPH versus “normal” 0.96 (0.91–1.00) 0.95 (0.89–1.00)
AUC, area under the ROC curve; CTD, connective tissue disease; CTEPH, chronic thromboembolic pulmonary hypertension; HPAH, heritable PAH; IPAH, idiopathic PAH; MPAD, main pulmonary artery diameter; PAH, pulmonary arterial hypertension; PH, pulmonary hypertension; PHLHD, PH owing to left heart disease; ROC, receiver operating characteristic; rPA, ratio of MPAD to aorta diameter.
![Figure 5, Empirical and proper binormal model (PBM) receiver operating characteristic curves for the ability of main pulmonary artery diameter (MPAD) ( top left : pulmonary hypertension [PH] vs “normal;” top right : PH vs “normal” + non-PH) and measured main pulmonary artery diameter to the diameter of the aorta (rPA) ( bottom left : PH vs “normal;” bottom right : PH vs “normal” + non-PH) to individually classify patients into two groups (those with PH and those without PH). AUC, area under the receiver operating characteristic curve; FPF, false-positive fraction (1-specificity); TPF, true-positive fraction (sensitivity).](https://storage.googleapis.com/dl.dentistrykey.com/clinical/CTBasedPulmonaryArteryMeasurementsfortheAssessmentofPulmonaryHypertension/4_1s20S1076633213005941.jpg)
Get Radiology Tree app to read full this article<
Get Radiology Tree app to read full this article<
Table 7
Sensitivities (with 95% CI) Obtained at Specificities of 0.95 and 0.90 When MPAD and rPA Are Evaluated in the Task of Separating PH Patients from “Normal” Patients and PH Patients from the Combined Group of “Normal” Patients Plus non-PH Patients as Determined by the Proper Binormal ROC Curves
Classification Task Specificity Vessel Measurement MPAD rPA PH versus “normal” 0.95 0.81 (0.72–0.90) 0.76 (0.66–0.85) 0.90 0.88 (0.83–0.94) 0.83 (0.76–0.90) PH versus “normal” + non-PH 0.95 0.73 (0.62–0.84) 0.70 (0.60–0.80) 0.90 0.83 (0.76–0.91) 0.79 (0.71–0.87)
CI, confidence interval; MPAD, main pulmonary artery diameter; PH, pulmonary hypertension; rPA, ratio of MPAD to aorta diameter.
Table 8
Empirical Sensitivities and Vessel Measurement Thresholds Obtained at Specificities of Approximately 0.95 and 0.90 When MPAD and rPA Are Evaluated in the Task of Separating PH Patients from “Normal” Patients
Vessel Measurement Specificity PH versus “Normal” Sensitivity MPAD 0.95 MPAD > 31.0 mm 0.82 0.90 MPAD > 30.5 mm 0.85 rPA 0.95 rPA > 1.08 0.75 0.90 rPA > 1.04 0.81
MPAD, main pulmonary artery diameter; PH, pulmonary hypertension; rPA, ratio of MPAD to aorta diameter.
Get Radiology Tree app to read full this article<
Discussion
Get Radiology Tree app to read full this article<
Get Radiology Tree app to read full this article<
Get Radiology Tree app to read full this article<
Get Radiology Tree app to read full this article<
Get Radiology Tree app to read full this article<
Limitations
Get Radiology Tree app to read full this article<
Get Radiology Tree app to read full this article<
Conclusion
Get Radiology Tree app to read full this article<
Acknowledgments
Get Radiology Tree app to read full this article<
References
1. Brown L.M., Chen H., Halpern S., et. al.: Delay in recognition of pulmonary arterial hypertension: factors identified from the REVEAL Registry. Chest 2011; 140: pp. 19-26.
2. Thenappan T., Shah S.J., Rich S., et. al.: A USA-based registry for pulmonary arterial hypertension: 1982–2006. Eur Respir J 2007; 30: pp. 1103-1110.
3. Humbert M., Sitbon O., Chaouat A., et. al.: Pulmonary arterial hypertension in France: results from a national registry. Am J Respir Crit Care Med 2006; 173: pp. 1023-1030.
4. Simonneau G., Robbins I.M., Beghetti M., et. al.: Updated clinical classification of pulmonary hypertension. J Am Coll Cardiol 2009; 54: pp. S43-S54.
5. Barst R.J., McGoon M., Torbicki A., et. al.: Diagnosis and differential assessment of pulmonary arterial hypertension. J Am Coll Cardiol 2004; 43: pp. 40S-47S.
6. Badesch D.B., Champion H.C., Sanchez M.A., et. al.: Diagnosis and assessment of pulmonary arterial hypertension. J Am Coll Cardiol 2009; 54: pp. S55-S66.
7. Bossone E., Bodini B.D., Mazza A., et. al.: Pulmonary arterial hypertension: the key role of echocardiography. Chest 2005; 127: pp. 1836-1843.
8. Hsu V.M., Moreyra A.E., Wilson A.C., et. al.: Assessment of pulmonary arterial hypertension in patients with systemic sclerosis: comparison of noninvasive tests with results of right-heart catheterization. J Rheumatol 2008; 35: pp. 458-465.
9. Swanson K.L., Utz J.P., Krowka M.J.: Doppler echocardiography-right heart catheterization relationships in patients with idiopathic pulmonary fibrosis and suspected pulmonary hypertension. Med Sci Monit 2008; 14: pp. CR177-CR182.
10. Kuriyama K., Gamsu G., Stern R.G., et. al.: CT-determined pulmonary artery diameters in predicting pulmonary hypertension. Invest Radiol 1984; 19: pp. 16-22.
11. Edwards P.D., Bull R.K., Coulden R.: CT measurement of main pulmonary artery diameter. Br J Radiol 1998; 71: pp. 1018-1020.
12. Tan R.T., Kuzo R., Goodman L.R., et. al.: Utility of CT scan evaluation for predicting pulmonary hypertension in patients with parenchymal lung disease. Medical College of Wisconsin Lung Transplant Group. Chest 1998; 113: pp. 1250-1256.
13. Sanal S., Aronow W.S., Ravipati G., et. al.: Prediction of moderate or severe pulmonary hypertension by main pulmonary artery diameter and main pulmonary artery diameter/ascending aorta diameter in pulmonary embolism. Cardiol Rev 2006; 14: pp. 213-214.
14. Ng C.S., Wells A.U., Padley S.P.: A CT sign of chronic pulmonary arterial hypertension: the ratio of main pulmonary artery to aortic diameter. J Thorac Imaging 1999; 14: pp. 270-278.
15. Perez-Enguix D., Morales P., Tomas J.M., et. al.: Computed tomographic screening of pulmonary arterial hypertension in candidates for lung transplantation. Transplant Proc 2007; 39: pp. 2405-2408.
16. Zisman D.A., Karlamangla A.S., Ross D.J., et. al.: High-resolution chest CT findings do not predict the presence of pulmonary hypertension in advanced idiopathic pulmonary fibrosis. Chest 2007; 132: pp. 773-779.
17. Moore N.R., Scott J.P., Flower C.D., et. al.: The relationship between pulmonary artery pressure and pulmonary artery diameter in pulmonary hypertension. Clin Radiol 1988; 39: pp. 486-489.
18. Haimovici J.B., Trotman-Dickenson B., Halpern E.F., et. al.: Relationship between pulmonary artery diameter at computed tomography and pulmonary artery pressures at right-sided heart catheterization. Massachusetts General Hospital Lung Transplantation Program. Acad Radiol 1997; 4: pp. 327-334.
19. Froelich J.J., Koenig H., Knaak L., et. al.: Relationship between pulmonary artery volumes at computed tomography and pulmonary artery pressures in patients with- and without pulmonary hypertension. Eur J Radiol 2008; 67: pp. 466-471.
20. Mahammedi A., Oshmyansky A., Hassoun P.M., et. al.: Pulmonary artery measurements in pulmonary hypertension: the role of computed tomography. J Thorac Imaging 2013; 28: pp. 96-103.
21. Condliffe R., Radon M., Hurdman J., et. al.: CT pulmonary angiography combined with echocardiography in suspected systemic sclerosis-associated pulmonary arterial hypertension. Rheumatology (Oxford) 2011; 50: pp. 1480-1486.
22. Devaraj A., Wells A.U., Meister M.G., et. al.: Detection of pulmonary hypertension with multidetector CT and echocardiography alone and in combination. Radiology 2010; 254: pp. 609-616.
23. Karazincir S., Balci A., Seyfeli E., et. al.: CT assessment of main pulmonary artery diameter. Diagn Interv Radiol 2008; 14: pp. 72-74.
24. Akaike H.: A new look at the statistical model identification. IEEE Trans Automat Contr 1974; 19: pp. 716-723.
25. Metz C.E., Pan X.: “Proper” binormal ROC curves: theory and maximum-likelihood estimation. J Math Psychol 1999; 43: pp. 1-33.