
Rationale and Objectives
To determine whether the display of computer-aided detection (CAD) marks on individual polyps on both the supine and prone scans leads to improved polyp detection by radiologists compared to the display of CAD marks on individual polyps on either the supine or the prone scan, but not both.
Materials and Methods
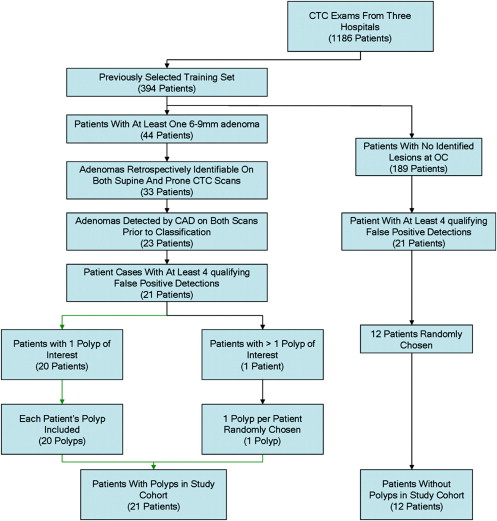
The acquisition of patient data for this study was approved by the Institutional Review Board and was Health Insurance Portability and Accountability Act–compliant. Subsequently, the use of the data was declared exempt from further institutional review board review. Four radiologists interpreted 33 computed tomography colonography cases, 21 of which had one adenoma 6–9 mm in size, with the assistance of a CAD system in the first reader mode (ie, the radiologists reviewed only the CAD marks). The radiologists were shown each case twice, with different sets of CAD marks for each of the two readings. In one reading, a true-positive CAD mark for the same polyp was displayed on both the supine and prone scans (a double-mark reading). In the other reading, a true-positive CAD mark was displayed either on the supine or prone scan, but not both (a single-mark reading). True-positive marks were randomized between readings and there was at least a 1-month delay between readings to minimize recall bias. Sensitivity and specificity were determined and receiver operating characteristic (ROC) and multiple-reader multiple-case analyses were performed.
Results
The average per polyp sensitivities were 60% (38%–81%) versus 71% (52%–91%) ( P = .03) for single-mark and double-mark readings, respectively. The areas (95% confidence intervals) under the ROC curves were 0.76 (0.62–0.88) and 0.79 (0.58–0.96), respectively ( P = NS). Specificities were similar for the single-mark compared with the double-mark readings.
Conclusion
The display of CAD marks on a polyp on both the supine and prone scans led to more frequent detection of polyps by radiologists without adversely affecting specificity for detecting 6–9 mm adenomas.
Computed tomography colonography (CTC) computer-aided detection (CAD) of polyps has advanced considerably over the past decade . Several recent studies have found that radiologists’ performance at polyp detection improves significantly with the aid of CAD . There is the prospect that, in the near future, both CTC and CAD will be widely used for colorectal cancer screening.
The successful clinical implementation of CAD depends on a number of factors, both technical and perceptual. The CAD software must locate the polyp and the radiologist must correctly interpret the CAD finding as a polyp. Previous studies have found that radiologists occasionally ignore true-positive CAD findings . Such behavior undermines the potential benefit of CAD. A better understanding of the causes of such errors could lead to improved radiologist performance.
Get Radiology Tree app to read full this article<
Get Radiology Tree app to read full this article<
Get Radiology Tree app to read full this article<
Materials and methods
Get Radiology Tree app to read full this article<
Patient Population
Get Radiology Tree app to read full this article<
Get Radiology Tree app to read full this article<
Bowel Preparation
Get Radiology Tree app to read full this article<
Computed Tomography Scanning
Get Radiology Tree app to read full this article<
Optical Colonoscopy
Get Radiology Tree app to read full this article<
Polyp Identification
Get Radiology Tree app to read full this article<
CAD System
Get Radiology Tree app to read full this article<
Get Radiology Tree app to read full this article<
Get Radiology Tree app to read full this article<
Overview of Study Design
Get Radiology Tree app to read full this article<
Get Radiology Tree app to read full this article<
Selection of Abnormal Patients and Detections
Get Radiology Tree app to read full this article<
Get Radiology Tree app to read full this article<
Selection of False-positive Detections
Get Radiology Tree app to read full this article<
Selection of Normal Cases
Get Radiology Tree app to read full this article<
Get Radiology Tree app to read full this article<
Randomization
Get Radiology Tree app to read full this article<
Reader Experience
Get Radiology Tree app to read full this article<
Training
Get Radiology Tree app to read full this article<
Instructions Given to the Radiologist Observers
Get Radiology Tree app to read full this article<
Get Radiology Tree app to read full this article<
Statistical Analysis
Get Radiology Tree app to read full this article<
Get Radiology Tree app to read full this article<
Get Radiology Tree app to read full this article<
Get Radiology Tree app to read full this article<
Get Radiology Tree app to read full this article<
Get Radiology Tree app to read full this article<
Results
Get Radiology Tree app to read full this article<
Table 1
Sensitivity per Polyp for Single-mark and Double-mark Computer-aided Detection True-positive Presentation
Sensitivity ( n = 21) Reader Single-mark Double-mark 1 8
38% 12
57% 2 15
71% 19
91% 3 15
71% 19
91% 4 12
57% 10
48% Average 60% (51%–68%) 71% (63%–80%)
Numbers are polyps (%). Patients had at most one polyp. Note that per-patient and per-polyp sensitivities are not necessarily identical because radiologists could miss the true polyp and instead inappropriately mark a false positive as a polyp, leading to a true-positive patient and false-negative polyp. The differences between single-mark and double-mark reads for individual readers (Fisher exact test) were not statistically significant. The differences between single-mark and double-mark reads for the average reader ( P =.03, three-factor analysis of variance) was statistically significant. 95% confidence intervals are given for the sensitivities for the average reader. There was no statistically significant difference among readers for the single-mark reads, but there was a statistically significant difference among readers for the double-mark reads ( P = .002, Cochran’s Q).
Get Radiology Tree app to read full this article<
Get Radiology Tree app to read full this article<
Table 2
Sensitivity and Specificity per Patient for Single-mark and Double-mark Computer-aided Detection True-positive Presentation
Sensitivity ( n = 21) Specificity ( n = 12) Reader Single-mark Double-mark Single-mark Double-mark 1 9
43% 13
62% 11
92% 8
67% 2 17
81% 19
90% 9
75% 10
83% 3 17
81% 19
90% 10
83% 12
100% 4 13
62% 10
48% 11
92% 10
83% Average 56/84
67%
(44%–86%) 61/84
73%
(48%–94%) 41/48
85%
(65%–100%) 40/48
83%
(63%–98%)
Numbers are patients (%). Patients had at most one polyp. Note that per-patient and per-polyp sensitivities are not necessarily identical because radiologists could miss the true polyp and instead inappropriately mark a false positive as a polyp, leading to a true-positive patient and false-negative polyp. The differences between single-mark and double-mark reads for individual readers and for the average reader were not statistically significant using bootstrap analysis. 95% confidence intervals for the average reader are from the multireader multicase analysis. The data for specificity include three normal cases that were identical on two readings; each reading was arbitrarily assigned to either the single-mark or double-mark groups. For the other nine normal cases, a pair of false positives was either matched (double-mark) or unmatched on the supine and prone scans based on location and computer-aided detection score to mimic the situation for the abnormal cases.
Get Radiology Tree app to read full this article<
Get Radiology Tree app to read full this article<
Table 3
Sensitivity for Polyp Detection by Radiologists on Both Supine and Prone Scans for Single-mark and Double-mark Computer-aided Detection True-positive Presentation
Reader Single-mark ( n = 21) Double-mark ( n = 21)P 1 5
24% 12
57% .06 2 5
24% 14
67% .01 3 14
67% 18
86% .3 4 11
52% 9
43% .8 Average 42% (33%–51%) 63% (54%–72%) .002
Numbers are polyps (%) detected by radiologists on both supine and prone scans. P values are from Fisher exact test for the individual readers and three-factor analysis of variance for the average reader. 95% confidence intervals are given for the sensitivities for the average reader.
Get Radiology Tree app to read full this article<
Get Radiology Tree app to read full this article<
Table 4
Reasons for False-negative Polyps
Reason Given by Radiologist for Not Calling Polyp Single-mark Cases ( n = 34) Double-mark Cases ( n = 61) Stool 15 (44.1%) 20 (32.3%) Normal mucosa 8 (23.5%) 14 (22.6%) Fluid 6 (17.6%) 7 (11.3%) Fold 3 (8.8%) 10 (16.1%) Not viewable 2 (5.9%) 5 (8.1%) Scan artifact 0 (0%) 2 (3.2%) Rectal tube 0 (0%) 1 (1.6%) Air bubble 0 (0%) 1 (1.6%) Other 0 (0%) 1 (1.6%)
Data are numbers of false-negative polyps (%) according to the reasons the radiologists gave for not calling the computer-aided detection (CAD) finding a polyp. These are CAD marks on polyps that were mischaracterized by the radiologists. “Not viewable” means CAD mark was not visible on colonic surface when radiologist clicked on that entry in list of CAD marks.
Get Radiology Tree app to read full this article<
Get Radiology Tree app to read full this article<
Table 5
False-positive Radiologist Findings According to Whether the Computer-aided Detection Marks were Intentionally Spatially Colocated on Supine and Prone Scans
Reader Non-matched FPs Matched FPs 1 12 1 2 28 0 3 14 0 4 10 1 Average 64/1788 ∗
3.6% 2/72
2.8%
Data are numbers (%) of false-positive radiologist diagnoses according to whether the false positive was intentionally matched by the experimenters with a false positive in the same approximate location of the colon on the other scan. Multiple counts for some of the same false positives for readers and readings were included. The 72 matched false positives consist of a pair of false positives in each of 9 normal patients interpreted by each of four readers.
Get Radiology Tree app to read full this article<
Get Radiology Tree app to read full this article<
Get Radiology Tree app to read full this article<
Get Radiology Tree app to read full this article<
Get Radiology Tree app to read full this article<
Discussion
Get Radiology Tree app to read full this article<
Get Radiology Tree app to read full this article<
Get Radiology Tree app to read full this article<
Get Radiology Tree app to read full this article<
Get Radiology Tree app to read full this article<
Get Radiology Tree app to read full this article<
Get Radiology Tree app to read full this article<
Get Radiology Tree app to read full this article<
Get Radiology Tree app to read full this article<
Get Radiology Tree app to read full this article<
Get Radiology Tree app to read full this article<
Get Radiology Tree app to read full this article<
Get Radiology Tree app to read full this article<
Acknowledgments
Get Radiology Tree app to read full this article<
Get Radiology Tree app to read full this article<
Get Radiology Tree app to read full this article<
References
1. Yoshida H., Dachman A.H.: Computer-aided diagnosis for CT colonography. Semin Ultrasound CT MR 2004; 25: pp. 419-431.
2. Halligan S., Altman D.G., Mallett S., et. al.: Computed tomographic colonography: assessment of radiologist performance with and without computer-aided detection. Gastroenterology 2006; 131: pp. 1690-1699.
3. Baker M.E., Bogoni L., Obuchowski N.A., et. al.: Computer-aided detection of colorectal polyps: can it improve sensitivity of less-experienced readers? Preliminary findings. Radiology 2007; 245: pp. 140-149.
4. Taylor S.A., Charman S.C., Lefere P., et. al.: CT Colonography (CTC): investigation of the Optimum Reader Paradigm Using Computer Aided Detection Software. Radiology 2008; 246: pp. 463-471.
5. Petrick N., Haider M., Summers R.M., et. al.: CT colonography and computer-aided detection as a second reader: observer performance study. Radiology 2008; 246: pp. 148-156.
6. Mang T., Peloschek P., Plank C., et. al.: Effect of computer-aided detection as a second reader in multidetector-row CT colonography. Eur Radiol 2007; 17: pp. 2598-2607.
7. Chen S.C., Lu D.S., Hecht J.R., et. al.: CT colonography: value of scanning in both the supine and prone positions. AJR Am J Roentgenol 1999; 172: pp. 595-599.
8. Fletcher J.G., Johnson C.D., MacCarty R.L., Welch T.J., Reed J.E., Ahlquist D.A.: CT colonography in 180 patients: the benefit of prone imaging. Gastroenterology 1999; 116: pp. G1770.
9. Yong A.A., Harris J.E., Shorvon P.J.: The value of prone imaging in CT pneumocolon. Clin Radiol 2000; 55: pp. 959-963.
10. Pickhardt P.J., Choi J.R., Hwang I., et. al.: Computed tomographic virtual colonoscopy to screen for colorectal neoplasia in asymptomatic adults. N Engl J Med 2003; 349: pp. 2191-2200.
11. Summers R.M., Yao J., Pickhardt P.J., et. al.: Computed tomographic virtual colonoscopy computer-aided polyp detection in a screening population. Gastroenterology 2005; 129: pp. 1832-1844.
12. Summers R.M., Jerebko A.K., Franaszek M., et. al.: Colonic polyps: complementary role of computer-aided detection in CT colonography. Radiology 2002; 225: pp. 391-399.
13. Jerebko A.K., Malley J.D., Franaszek M., et. al.: Support vector machines committee classification method for computer-aided polyp detection in CT colonography. Acad Radiol 2005; 12: pp. 479-486.
14. Li J., Huang A., Yao J., et. al.: Optimizing computer-aided colonic polyp detection for CT colonography by evolving the Pareto front. Med Phys 2009; 36: pp. 201-212.
15. Dorfman D.D., Berbaum K.S., Lenth R.V.: Multireader, multicase receiver operating characteristic methodology: a bootstrap analysis. Acad Radiol 1995; 2: pp. 626-633.
16. Langsrud O. Fisher’s exact test. Available at: http://www.langsrud.com/fisher.htm .
17. Siegel S., Castellan N.J.: Nonparametric statistics for the behavioral sciences.2nd ed.1988.McGraw-HillNew York
18. Mani A., Napel S., Paik D.S., et. al.: Computed tomography colonography–feasibility of computer-aided polyp detection in a “First reader” paradigm. J Comput Assist Tomogr 2004; 28: pp. 318-326.
19. Gur D., Bandos A.I., Cohen C.S., et. al.: The “laboratory” effect: comparing radiologists’ performance and variability during prospective clinical and laboratory mammography interpretations. Radiology 2008; 249: pp. 47-53.
20. Shiraishi J., Abe H., Engelmann R., et. al.: Effect of high sensitivity in a computerized scheme for detecting extremely subtle solitary pulmonary nodules in chest radiographs: observer performance study. Acad Radiol 2003; 10: pp. 1302-1311.
21. Obuchowski N.A.: Sample size tables for receiver operating characteristic studies. AJR Am J Roentgenol 2000; 175: pp. 603-608.
22. Zheng B., Leader J.K., Abrams G.S., et. al.: Multiview-based computer-aided detection scheme for breast masses. Med Phys 2006; 33: pp. 3135-3143.
23. Van Engeland S., Timp S., Karssemeijer N.: Finding corresponding regions of interest in mediolateral oblique and craniocaudal mammographic views. Med Phys 2006; 33: pp. 3203-3212.
24. Sahiner B., Chan H.P., Hadjiiski L.M., et. al.: Joint two-view information for computerized detection of microcalcifications on mammograms. Med Phys 2006; 33: pp. 2574-2585.
25. Gupta S., Markey M.K.: Correspondence in texture features between two mammographic views. Med Phys 2005; 32: pp. 1598-1606.
26. Acar B., Napel S., Paik D.S., et. al.: Registration of supine and prone CT colonography data: Method and evaluation. Radiology 2001; 221: 332:332
27. Nappi J., Okamura A., Frimmel H., et. al.: Region-based supine-prone correspondence for the reduction of false-positive CAD polyp candidates in CT colonography. Acad Radiol 2005; 12: pp. 695-707.
28. Huang A., Roy D., Franaszek M., et. al.: Teniae coli guided navigation and registration for virtual colonoscopy. Pro IEEE Visualization Conf 2005; pp. 279-285.
29. Wang S, Van Uitert RL, Summers RM. Automated matching of supine and prone colonic polyps based on PCA and SVMs. In: Prog Biomed Optics Imaging Proceed SPIE 2008; 6915.
30. Huang A, Summers RM, Roy D. Synchronous navigation for CT colonography. In: Prog Biomed Optics Imaging Proceed SPIE 2006; 6143.
31. Zalis M.E., Barish M.A., Choi J.R., et. al.: CT colonography reporting and data system: a consensus proposal. Radiology 2005; 236: pp. 3-9.