
Rationale and Objectives
The progressive changes in lung morphology observed in cystic fibrosis (CF) can potentially affect the statistical distribution of computed tomography (CT) density values. This study aimed to characterize the lung CT density distributions by quantifying indices of the kurtosis and skewness of the lung density distribution and to compare these indices to radiologic scores and lung function parameters in children and young adults with CF.
Materials and Methods
CT scans and lung function of 26 patients with CF were retrospectively examined. The Bhalla radiologic scoring was performed separately, in random order, by two expert radiologists, blinded to the patient’s identity, age, clinical status, results of lung function tests, and the other paired observer’s score.
Results
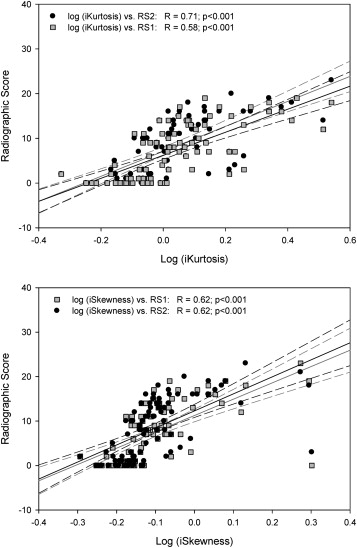
Positive relations were evidenced between the log indices of lung density distribution kurtosis (iKurtosis) and the overall radiologic scores (RS) of both observers (R = 0.58; P < .001 vs RS1 and R = 0.71; P < .001 vs RS2). A similar relationship was evidenced with the log index of the degree of distribution asymmetry (iSkewness; R = 0.62; P < .001 vs RS1 and R = 0.62; P < .001 vs RS2). Log-iKurtosis and log-iSkewness were related to FEV1 (R = −0.56; P < 10 −5 and R = −0.55; P < 10 −5 ) and to residual volume (R = 0.40; P < .001 and R = 0.45; P < .001, respectively). Both radiologic scores showed significant relation with lung function. The correlation between RS1 and RS2 was excellent (R = 0.93), with a Cohen weighted kappa of 0.43.
Conclusions
Characteristic indices of lung CT density distribution are correlated to lung function and radiologic scores in patients with CF and merit further evaluation as part of more comprehensive automated methods for quantifying CF lung CT data.
Advances in Knowledge
Automatically calculated indices used to quantify the sharpness of the lung computed tomography density distribution peak (kurtosis) and the degree of distribution asymmetry (skewness) show significant relations with both lung function and the radiologic score of Bhalla et al. (eg, log kurtosis index: R = 0.56; P < 10 −5 vs 1-second forced expiratory volume; R = 0.58; P < .001 vs total score of observer 1; R = 0.71; P < .001 vs observer 2) in patients with cystic fibrosis.
Introduction
Cystic fibrosis (CF), the most frequent autosomal recessive disease in Caucasians, leads to inflammatory changes in the airways and lung parenchyma due to chronic bacterial infection. Life expectancy in this disease remains severely compromised due to respiratory complications. Lung function tests (LFTs) remain the gold standard for monitoring the progression of respiratory disease in children with CF. High-resolution computed tomography (CT) is also used on a periodic basis in some centers to follow-up the progression of structural changes due to CF lung disease. Previous investigations have demonstrated that radiologic scores allowing semiquantitative assessment of various structural lung changes are significantly correlated to lung functional parameters . Some studies have suggested that changes in CT radiologic scores may be detected earlier than those in LFTs as they provide a more sensitive outcome measurement in patients with CF . However, the routine use of CT scoring has some drawbacks as it is time consuming and observer dependent . Moreover, interobserver agreement is often poor and, at best, moderate .
Get Radiology Tree app to read full this article<
Get Radiology Tree app to read full this article<
Subjects and methods
Study Population
Get Radiology Tree app to read full this article<
Table 1
Patient Characteristics, Mean Values of Lung Function, and Radiologic Parameters and Scores
CT1 CT2 CT3 CT4P Value age (mean), years 9.9 10.6 12.3 12.9 range (minimum–maximum) 4.0–16.5 5.0–17.5 6.6–18.5 6.9–19.5 N 19 26 23 23 Gender (M/F) (7/14) (11/15) (11/13) (10/13) Time from CT1, years 0 1.0 ± 0.2 1.9 ± 0.4 2.9 ± 0.4 FEV1 (% pred) 88.3 ± 28.7 88.9 ± 28.1 83.9 ± 27.1 81.8 ± 26.8 .040 FVC (% pred) 89.6 ± 24.0 91.3 ± 23.5 90.6 ± 21.9 89.4 ± 22.5 .869 FEV1/FVC (% pred) 98.1 ± 10.3 95.9 ± 10.8 91.7 ± 12.1 89.7 ± 13.8 .011 PEF (% pred) 89.8 ± 22.6 86.4 ± 23.3 82.4 ± 30.1 82.4 ± 27.6 .253 FEF25–75 (% pred) 77.7 ± 38.1 74.7 ± 40.8 64.3 ± 42.3 63.2 ± 38.1 .003 Raw (% pred) 178.4 ± 63.7 225.3 ± 89.1 232.0 ± 123.9 230.2 ± 119.8 .005 RV (% pred) 123.0 ± 60.4 154.3 ± 62.1 164.7 ± 61.4 137.8 ± 64.0 .001 TLC (% pred) 99.3 ± 23.1 101.2 ± 18.9 99.9 ± 20.3 98.4 ± 15.3 .714 TcSaO 2 (%) 97.0 ± 1.6 97.0 ± 1.3 97.6 ± 1.5 97.6 ± 1.3 .062 RS1 6.8 ± 5.4 7.2 ± 6.7 7.8 ± 6.63 8.2 ± 6.5 .036 RS2 7.8 ± 6.2 8.0 ± 6.6 8.8 ± 7.03 9.2 ± 6.67 .030 MLA (HU) −787.7 ± 95.7 −808.4 ± 70.8 −818.6 ± 57.8 −809.2 ± 71.4 .326 iSkewness 0.79 ± 0.19 0.83 ± 0.27 0.83 ± 0.26 0.79 ± 0.18 .403 iKurtosis 1.21 ± 0.67 1.42 ± 1.37 1.41 ± 1.27 1.20 ± 0.66 .135
CT, computed tomography; FEF25–75, mean forced expiratory flow between 25% and 75% of forced vital capacity; FEV1, forced expiratory volume in 1 second (expressed as percent predicted value [% pred]); FVC, forced vital capacity; HU, Hounsfield units; iKurtosis, index of the lung density distribution kurtosis; iSkewness, index of the lung density distribution skewness; MLA, mean lung attenuation in Hounsfield units; PEF, peak expiratory flow; Raw, airway resistance; RS1, RS2, total radiologic scores provided by each observer; RV, residual volume; TcSaO 2 , transcutaneous oxygen saturation; TLC, total lung capacity.
Data are mean ± standard deviation.
Get Radiology Tree app to read full this article<
CT Imaging
Get Radiology Tree app to read full this article<
Radiologic Evaluation
Get Radiology Tree app to read full this article<
CT Density Distribution Analysis
Get Radiology Tree app to read full this article<
1/(e4σ2+2e3σ2+3e2σ2−6) 1
/
(
e
4
σ
2
+
2
e
3
σ
2
+
3
e
2
σ
2
−
6
)
where σ is the SD extracted from the fitted function. An index of the degree of distribution asymmetry (iSkewness) was computed as follows:
1/[(eσ2+2)eσ2−1−−−−−−√] 1
/
[
(
e
σ
2
+
2
)
e
σ
2
−
1
]
Get Radiology Tree app to read full this article<
Get Radiology Tree app to read full this article<
Lung Function
Get Radiology Tree app to read full this article<
Statistical Analysis
Get Radiology Tree app to read full this article<
Results
Study Population
Get Radiology Tree app to read full this article<
Lung Function, Radiologic Score, and Indices of Lung Density Distribution Skewness and Kurtosis
Get Radiology Tree app to read full this article<
Get Radiology Tree app to read full this article<
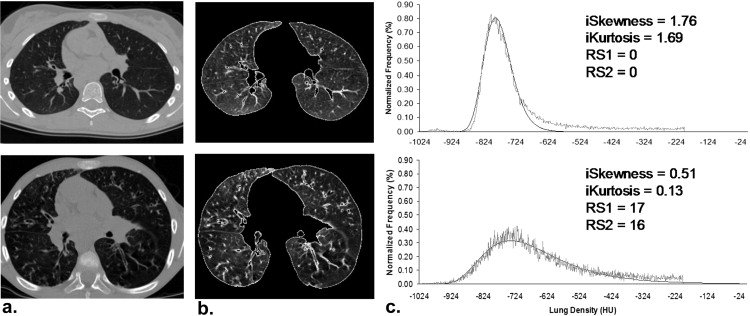
Table 2
Correlation Between Total Radiologic Scores and Indices of the Lung Density Distribution Versus Lung Function Parameters
FEV1 FVC FEV1/FVC PEF FEF25–75 RV TLC TcSaO 2 RS1 R −0.64 −0.56 −0.52 −0.36 −0.50 0.31 −0.24 −0.44 CI (−0.75 to −0.48) (−0.69 to −0.39) (−0.66 to −0.33) (−0.54 to −0.15) (−0.65 to −0.32) (0.08 to 0.50) (−0.45 to −0.01) (−0.62 to −0.21)P value <10 −5 <10 −5 <10 −5 <0.01 <10 −5 .009 .039 <.001 RS2 R −0.70 −0.64 −0.52 −0.41 −0.57 0.39 −0.28 −0.44 CI (−0.80 to −0.57) (−0.75 to −0.48) (−0.67 to −0.34) (−0.58 to −0.21) (−0.70 to −0.40) (0.18 to 0.57) (−0.48 to −0.06) (−0.62 to −0.21)P value <10 −12 <10 −8 <10 −5 <.001 <10 −5 <.001 .016 <.001 Log (iSkewness) R −0.55 −0.53 −0.43 −0.49 −0.46 0.45 −0.21 −0.33 CI (−0.69 to −0.37) (−0.67 to −0.35) (−0.60 to −0.23) (−0.64 to −0.30) (−0.61 to −0.26) (0.24 to 0.62) (−0.42 to 0.03) (−0.54 to −0.08)P value <10 −5 <10 −5 <.001 <10 −4 <10 −4 <.001 .081 .01 Log (iKurtosis) R −0.56 −0.55 −0.42 −0.46 −0.45 0.40 −0.24 −0.46 CI (−0.70 to −0.39) (−0.68 to −0.37) (−0.59 to −0.22) (−0.62 to −0.27) (−0.61 to −0.26) (0.18 to 0.58) (−0.45 to 0.01) (−0.62 to −0.25)P value <10 −5 <10 −5 <.001 <10 −4 <10 −4 <.001 .044 <.001
CI, confidence interval; FEF25–75, mean forced expiratory flow between 25% and 75% of forced vital capacity; FEV1, forced expiratory volume in 1 second (expressed as percent predicted value [% pred]); FVC, forced vital capacity; iKurtosis, index of the lung density distribution kurtosis; iSkewness, index of the lung density distribution skewness; PEF, peak expiratory flow; R, Pearson correlation coefficient; RS1, RS2, overall radiologic scores provided by each observer; RV, residual volume; TcSaO 2 , transcutaneous oxygen saturation; TLC, total lung capacity.
Pearson correlation coefficients and significance ( P value) between overall radiologic scores from each observer (RS1, RS2, respectively), log-transformed indices of the lung density distribution skewness and kurtosis (iSkewness and iKurtosis, respectively) versus lung function parameters.
Get Radiology Tree app to read full this article<
Get Radiology Tree app to read full this article<
Get Radiology Tree app to read full this article<
Interobserver Agreement
Get Radiology Tree app to read full this article<
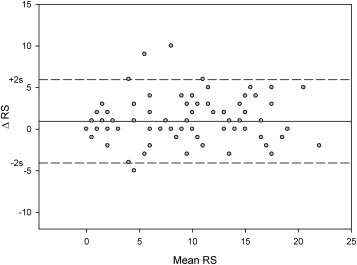
Table 3
Cohen Weighted Kappa of Individual Score Criteria and of the Overall Score
Individual Score Criteria Cohen Weighted Kappa_n_ 94 Severity of bronchiectasis 0.66 Extent of bronchiectasis 0.74 Peribronchial thickening 0.34 Extent of mucous plugging 0.68 Sacculation or abscesses 0.41 Generations of bronchial divisions involved 0.87 Number of bullae 0.51 Air trapping 0.43 Collapse/consolidation 0.56 Total score 0.45
Get Radiology Tree app to read full this article<
Discussion
Get Radiology Tree app to read full this article<
Get Radiology Tree app to read full this article<
Get Radiology Tree app to read full this article<
Get Radiology Tree app to read full this article<
Get Radiology Tree app to read full this article<
Get Radiology Tree app to read full this article<
Get Radiology Tree app to read full this article<
Acknowledgments
Get Radiology Tree app to read full this article<
Get Radiology Tree app to read full this article<
References
1. Bhalla M., Turcios N., Aponte V., et. al.: Cystic fibrosis: scoring system with thin-section CT. Radiology 1991; 179: pp. 783-788.
2. Helbich T.H., Heinz-Peer G., Eichler I., et. al.: Cystic fibrosis: CT assessment of lung involvement in children and adults. Radiology 1999; 213: pp. 537-544.
3. Demirkazik F.B., Ariyurek O.M., Ozcelik U., et. al.: High resolution CT in children with cystic fibrosis: correlation with pulmonary functions and radiographic scores. Eur J Radiol 2001; 37: pp. 54-59.
4. Brody A.S., Klein J.S., Molina P.L., et. al.: High-resolution computed tomography in young patients with cystic fibrosis: distribution of abnormalities and correlation with pulmonary function tests. The Journal of pediatrics 2004; 145: pp. 32-38.
5. de Jong P.A., Nakano Y., Lequin M.H., et. al.: Progressive damage on high resolution computed tomography despite stable lung function in cystic fibrosis. Eur Respir J 2004; 23: pp. 93-97.
6. Collins C.D., Wells A.U., Hansell D.M., et. al.: Observer variation in pattern type and extent of disease in fibrosing alveolitis on thin section computed tomography and chest radiography. Clinical radiology 1994; 49: pp. 236-240.
7. Johkoh T., Muller N.L., Colby T.V., et. al.: Nonspecific interstitial pneumonia: correlation between thin-section CT findings and pathologic subgroups in 55 patients. Radiology 2002; 225: pp. 199-204.
8. Lynch D.A.: Quantitative CT of fibrotic interstitial lung disease. Chest 2007; 131: pp. 643-644.
9. Aitchison J., Brown J.A.C.: The lognormal distribution: with special reference to its uses in economics.1966.University Press
10. Zapletal A., Šamánek M., Paul T.: Lung function in children and adolescents: methods, reference values.1987.Karger
11. Bland Jm Fau - Altman DG, Altman DG. Statistical methods for assessing agreement between two methods of clinical measurement. (0140–6736 (Print)).
12. Tiddens H.A.: Chest computed tomography scans should be considered as a routine investigation in cystic fibrosis. Paediatr Respir Rev 2006; 7: pp. 202-208.
13. Brody A.S., Molina P.L., Klein J.S., et. al.: High-resolution computed tomography of the chest in children with cystic fibrosis: support for use as an outcome surrogate. Pediatric radiology 1999; 29: pp. 731-735.
14. Santamaria F., Grillo G., Guidi G., et. al.: Cystic fibrosis: when should high-resolution computed tomography of the chest be obtained?. Pediatrics 1998; 101: pp. 908-913.
15. Camiciottoli G., Orlandi I., Bartolucci M., et. al.: Lung CT densitometry in systemic sclerosis: correlation with lung function, exercise testing, and quality of life. Chest 2007; 131: pp. 672-681.
16. Nasr S.Z., Kuhns L.R., Brown R.W., et. al.: Use of computerized tomography and chest x-rays in evaluating efficacy of aerosolized recombinant human DNase in cystic fibrosis patients younger than age 5 years: a preliminary study. Pediatr Pulmonol 2001; 31: pp. 377-382.
17. Robinson T.E., Leung A.N., Northway W.H., et. al.: Composite spirometric-computed tomography outcome measure in early cystic fibrosis lung disease. Am J Respir Crit Care Med 2003; 168: pp. 588-593.
18. Beigelman-Aubry C., Capderou A., Grenier P.A., et. al.: Mild intermittent asthma: CT assessment of bronchial cross-sectional area and lung attenuation at controlled lung volume. Radiology 2002; 223: pp. 181-187.