
Rationale and Objective
The computed tomography (CT) features of hepatic veno-occlusive disease (HVOD) could play a role in its diagnosis. We aimed to perform a meta-analysis of studies examining the CT features of HVOD.
Methods
Relevant studies published up to May 3, 2017 were searched in major electronic databases. The extracted data included the proportion of various CT features in patients with HVOD. The meta-analysis was conducted using R 3.3.3 with the “meta” package.
Results
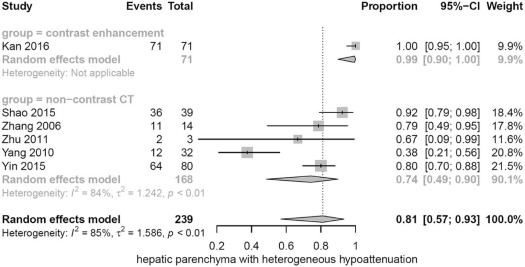
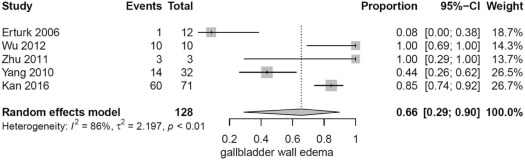
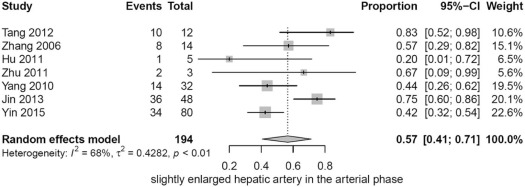
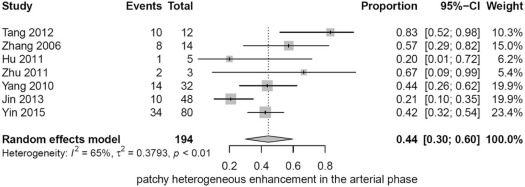
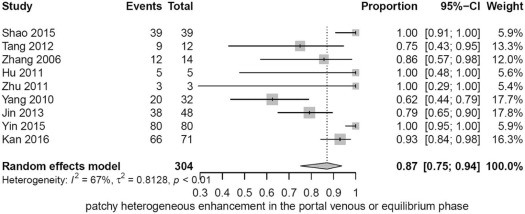
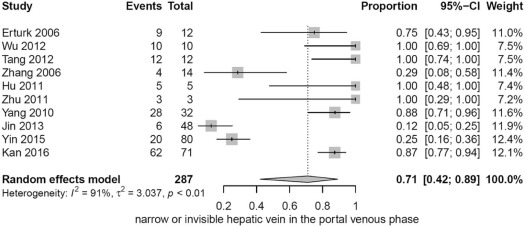
Eleven studies were included. The studies involved 326 patients with a mean age range of 50.2–58.9 years, and the proportion of female patients ranged from 20% to 57.5%. The meta-analysis showed the pooled proportion of CT features: hepatic parenchyma with heterogeneous hypoattenuation (81.05%, 95% confidence interval [CI]: 56.97%–93.25%), patchy enhancement in the portal venous phase (87.09%, 95% CI: 75.15%–93.77%) with or without a narrow or invisible hepatic vein (71.02% 95% CI: 42.09%–89.20%), gallbladder wall edema (65.51%, 95% CI: 28.98%–89.84%), and patchy heterogeneous enhancement in the arterial phase (44.36%, 95% CI: 29.98%–59.76%) with or without slightly enlarged hepatic artery (56.61%, 95% CI: 40.62%–71.33%).
Conclusion
Hepatic parenchyma with heterogeneous hypoattenuation and patchy enhancement with or without narrowing or an invisible hepatic vein in the portal venous or equilibrium phase may be the most important CT feature for diagnosing HVOD.
Introduction
In 1954, Jelliffe reported on hepatic veno-occlusive disease (HVOD), which is also known as hepatic sinusoidal obstruction syndrome (HSOS) . This disease is defined as an obstruction of the sublobular veins or the central veins of hepatic lobules, which results in intrahepatic or postsinusoidal portal hypertension .
The clinical manifestation of HVOD is characterized by upper right abdominal pain, hepatomegaly, ascites, weight gain, jaundice, malaise, vomiting, and other digestive dysfunctions . The clinical manifestation of HVOD has been divided into three stages: acute, subacute, and chronic . The pathology of HVOD is centered around injury to the hepatic sinusoids or venules, with eventual infiltration by collagen and fibrous proteins leading to obliteration, and portal hypertension .
Get Radiology Tree app to read full this article<
Get Radiology Tree app to read full this article<
Get Radiology Tree app to read full this article<
TABLE 1
The Seattle and Baltimore Criteria
The Seattle Criteria The Baltimore Criteria Major criteria Within 20 days of HSCT Total serum bilirubin ≥2 mg/dL within 21 days of HSCT At least two of the following criteria Total serum bilirubin ≥2 mg/dL Painful hepatomegaly Painful hepatomegaly Ascites Sudden weight gain (>2%) Sudden weight gain (>5%)
HSCT, hematopoietic stem cell transplantation.
Get Radiology Tree app to read full this article<
Get Radiology Tree app to read full this article<
Get Radiology Tree app to read full this article<
Materials and Methods
Data Sources and Search Strategy
Get Radiology Tree app to read full this article<
Inclusion and Exclusion Criteria
Get Radiology Tree app to read full this article<
Data Extraction
Get Radiology Tree app to read full this article<
Quality Assessment
Get Radiology Tree app to read full this article<
Get Radiology Tree app to read full this article<
Get Radiology Tree app to read full this article<
Get Radiology Tree app to read full this article<
TABLE 2
Methodological Quality Assessment
Study \* Study Design Assessment Method Quality Score Overall Methodological Quality Shao 2015 Cross-sectional study AHRQ-Quality checklist 8 High Erturk 2006 Case-control study NOS checklist 6 Stars High Wu 2012 Cross-sectional study AHRQ-Quality checklist 8 High Tang 2012 Cross-sectional study AHRQ-Quality checklist 7 Moderate Zhang 2006 Cross-sectional study AHRQ-Quality checklist 9 High Hu 2011 Cross-sectional study AHRQ-Quality checklist 6 Moderate Zhu 2011 Cross-sectional study AHRQ-Quality checklist 6 Moderate Yang 2010 Cross-sectional study AHRQ-Quality checklist 7 Moderate Jin 2013 Cross-sectional study AHRQ-Quality checklist 7 Moderate Yin 2015 Cross-sectional study AHRQ-Quality checklist 8 High Kan 2016 Case-control study NOS checklist 6 Stars High
AHRQ-Quality checklist, quality checklist recommended by the Agency for Healthcare Research and Quality; NOS, Newcastle-Ottawa Scale.
Get Radiology Tree app to read full this article<
Get Radiology Tree app to read full this article<
Statistical Analysis
Get Radiology Tree app to read full this article<
Get Radiology Tree app to read full this article<
Get Radiology Tree app to read full this article<
Get Radiology Tree app to read full this article<
Get Radiology Tree app to read full this article<
Get Radiology Tree app to read full this article<
Get Radiology Tree app to read full this article<
Results
Data Selection and Study Characteristics
Get Radiology Tree app to read full this article<
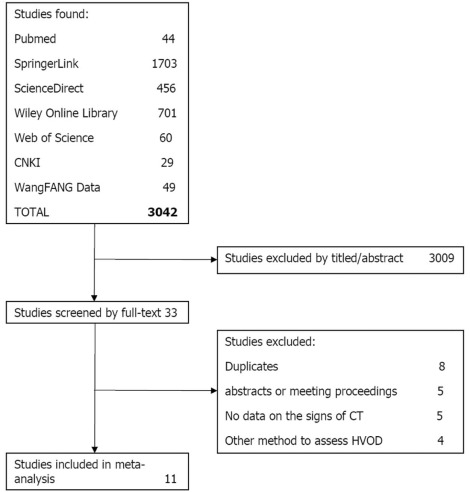
TABLE 3
Characteristics of the Included Studies
Study \* Location_n_ † Age in Years Male (%) Female (%) Stage of HVOD Causes of HVOD Shao 2015 China 39 55 (range: 33–73) 46.2% 53.8% Acute or subacute_Sedum aizoon_ Erturk 2006 United States 12 42.4 (range: 24–61) 55.6% 44.4% Acute or subacute GVHD Wu 2012 China 10 58.9 (range: 53–82) 50% 50% Acute or subacute_Gynura segetum_ Tang 2012 China 12 50.2 (range: 49–67) 66.7% 33.3% Acute_G. segetum_ Zhang 2006 China 14 56 (range: 41–73) 42.9% 57.1% Acute_G. segetum_ Hu 2011 China 5 Range: 40–60 80% 20% Subacute_S. aizoon_ Zhu 2011 China 3 Range: 50–57 66.7% 33.3% Acute or subacute_S. aizoon_ Yang 2010 China 32 50.2 (range: 22–71) 78.1% 21.9% 16 Acute;
10 Subacute
6 Chronic_S. aizoon_ Jin 2013 China 48 53.6 (range: 48–68) 62.5% 37.5% Acute NG Yin 2015 China 80 56.2 (range: 41–73) 42.5% 57.5% Acute or subacute_S. aizoon_ Kan 2016 China 71 56.48 ± 11.84 ‡ 67.6% 32.4% Acute or subacute PAs
GVHD, graft-versus-host disease; HVOD, hepatic veno-occlusive disease; NG, not given; PA, pyrrolizidine alkaloid; SD, standard deviation.
Get Radiology Tree app to read full this article<
Get Radiology Tree app to read full this article<
Get Radiology Tree app to read full this article<
Get Radiology Tree app to read full this article<
Methodological Quality Assessment
Get Radiology Tree app to read full this article<
Publication Bias
Get Radiology Tree app to read full this article<
Meta-analysis Outcomes
Get Radiology Tree app to read full this article<
TABLE 4
CT Features of HVOD
Study \* Reference No.n † Hepatomegaly Ascites Gallbladder Wall Edema Heterogeneous Hypoattenuation In the Arterial Phase In the Portal Venous Phase Slightly Enlarged Hepatic Artery Patchy Heterogeneous Enhancement Narrow or Invisible Hepatic vein Patchy Heterogeneous Enhancement Shao 2015 39 100% 100% NG 92.31% NG NG NG 100% Erturk 2006 12 100% 83.33% 8.33% NG NG NG 75% NG Wu 2012 10 100% 100% 100% NG NG NG 100% NG Tang 2012 12 100% 100% NG NG 83.33% 83.33% 100% 75% Zhang 2006 14 100% 100% NG 78.57% 57.14% 57.14% 28.57% 85.71% Hu 2011 5 100% 100% NG NG 20% 20% 100% 100% Zhu 2011 3 100% 100% 100% 66.7% 66.67% 66.67% 100% 100% Yang 2010 32 81.25% 100% 43.75% 37.5% 43.75% 43.75% 87.5% 62.5% Jin 2013 48 100% NG NG NG 75.0% 20.83% 12.5% 79.17% Yin 2015 80 100% NG NG 80% 42.5% 42.5% 25% 100% Kan 2016 71 78.87% 100% 84.51% 100% ‡ NG NG 87.32% 92.96%
CT, computed tomography; HVOD, hepatic veno-occlusive disease; NG, not given.
Get Radiology Tree app to read full this article<
Get Radiology Tree app to read full this article<
Get Radiology Tree app to read full this article<
Get Radiology Tree app to read full this article<
Get Radiology Tree app to read full this article<
Get Radiology Tree app to read full this article<
Get Radiology Tree app to read full this article<
Get Radiology Tree app to read full this article<
Get Radiology Tree app to read full this article<
Get Radiology Tree app to read full this article<
Get Radiology Tree app to read full this article<
Get Radiology Tree app to read full this article<
Get Radiology Tree app to read full this article<
Other Radiological Findings
Get Radiology Tree app to read full this article<
Discussion
Get Radiology Tree app to read full this article<
Get Radiology Tree app to read full this article<
Get Radiology Tree app to read full this article<
Get Radiology Tree app to read full this article<
CT Scanning
Get Radiology Tree app to read full this article<
Get Radiology Tree app to read full this article<
Get Radiology Tree app to read full this article<
Get Radiology Tree app to read full this article<
Get Radiology Tree app to read full this article<
Get Radiology Tree app to read full this article<
Get Radiology Tree app to read full this article<
Get Radiology Tree app to read full this article<
Differential Diagnosis
Get Radiology Tree app to read full this article<
Get Radiology Tree app to read full this article<
Get Radiology Tree app to read full this article<
CT Features and Diagnosis
Get Radiology Tree app to read full this article<
Get Radiology Tree app to read full this article<
Limitations
Get Radiology Tree app to read full this article<
Conclusion
Get Radiology Tree app to read full this article<
References
1. Jelliffe D.B., Bras G., Stuart K.L.: Veno-occlusive disease of the liver. Pediatrics 1954; 14: pp. 334-339. Available at: http://www.ncbi.nlm.nih.gov/pubmed/13204101
2. Plessier A., Rautou P.-E., Valla D.-C.: Management of hepatic vascular diseases. J Hepatol 2012; 56: pp. S25-S38.
3. DeLeve L.D., Valla D.-C., Garcia-Tsao G.: Vascular disorders of the liver. Hepatology 2009; 49: pp. 1729-1764.
4. Senzolo M., Germani G., Cholongitas E., et. al.: Veno occlusive disease: update on clinical management. World J Gastroenterol 2007; 13: pp. 3918-3924. doi:17663504
5. Shao H., Chen H.Z., Zhu J.S., et. al.: Computed tomography findings of hepatic veno-occlusive disease caused by Sedum aizoon with histopathological correlation. Braz J Med Biol Res 2015; 48: pp. 1145-1150.
6. Wu X.W., Wang W.Q., Liu B., et. al.: Hepatic veno-occlusive disease after taking Gynura rhizome: the value of multidetector computed tomography in diagnosing the disease and evaluating the clinical therapeutic effect. Hepatol Res 2012; 42: pp. 304-309.
7. Bras G., Hill K.R.: Veno-occlusive disease of the liver; essential pathology. Lancet 1956; 271: pp. 161-163. Available at: http://www.ncbi.nlm.nih.gov/pubmed/13347104
8. Stein H., Isaacson C.: Veno-occlusive disease of the liver. Br Med J 1962; 1: pp. 372-374. Available at: http://www.ncbi.nlm.nih.gov/pubmed/13916613
9. Jelliffe D.B., Bras G., Mukherjee K.L.: Veno-occlusive disease of the liver and Indian childhood cirrhosis. Arch Dis Child 1957; 32: pp. 369-385.
10. Rollins B.J.: Hepatic veno-occlusive disease. Am J Med 1986; 81: pp. 297-306. Available at: http://www.ncbi.nlm.nih.gov/pubmed/3526887
11. Richardson P., Guinan E.: The pathology, diagnosis, and treatment of hepatic veno-occlusive disease: current status and novel approaches. Br J Haematol 1999; 107: pp. 485-493. Available at: http://www.ncbi.nlm.nih.gov/pubmed/10583247
12. Lin G., Wang J.Y., Li N., et. al.: Hepatic sinusoidal obstruction syndrome associated with consumption of Gynura segetum. J Hepatol 2011; 54: pp. 666-673.
13. Dai H.-F., Gao Y., Yang M., et. al.: Hepatic veno-occlusive disease induced by Gymura segetum : report of two cases. Hepatobiliary Pancreat Dis Int 2006; 5: pp. 406-408. Available at: http://www.ncbi.nlm.nih.gov/pubmed/16911940
14. Chen Z., Huo J.R.: Hepatic veno-occlusive disease associated with toxicity of pyrrolizidine alkaloids in herbal preparations. Neth J Med 2010; 68: pp. 252-260.
15. Wu G.-L., Yu G.-Y., Chen J.: [Clinical analysis of hepatic veno-occlusive disease induced by Sedum aizoon ]. Zhongguo Zhong Yao Za Zhi 2008; 33: pp. 2402-2404. Available at: http://www.ncbi.nlm.nih.gov/pubmed/19157138
16. Chojkier M.: Hepatic sinusoidal-obstruction syndrome: toxicity of pyrrolizidine alkaloids. J Hepatol 2003; 39: pp. 437-446.
17. Gao H., Li N., Wang J.Y., et. al.: Definitive diagnosis of hepatic sinusoidal obstruction syndrome induced by pyrrolizidine alkaloids. J Dig Dis 2012; 13: pp. 33-39.
18. Tang W.J., Shi H.S., Liang B.: Dynamic contrast-enhanced CT in diagnosis of hepatic veno-occlusive disease. Radiol Pract 2012; 27: pp. 1235-1237.
19. Zhang G.H., Kong A.Z., Fang J.W., et. al.: CT imaging of hepatic veno-occlusive disease (an analysis 14 cases). Chin J Radiol 2006; 40: pp. 250-254. Available at: https://www.researchgate.net/publication/288568477_CT_imaging_of_hepatic_veno-occlusive_disease_an_analysis_14_cases
20. Hu Z.B., Yao H.Q., Zhang P.: The value of CT and low field MRI in the diagnosis of hepatic veno-occlusive disease (5 cases report and literature review). Chin J 2011; 9: pp. 11-12. 24
21. Zhu X.J., Wang W.: CT imaging of hepatic veno-occlusive disease caused by Gynura segetum. J Clin Radiol 2011; 30: pp. 595-597.
22. Yang J.J., Hu C.H., He J.: The contrast of ultrasond and CT in diagnosis of hepatic veno-occlusive disease. J Med Imaging 2010; 20: pp. 1381-1385. Available at: http://en.cnki.com.cn/Article_en/CJFDTOTAL-XYXZ201009047.htm
23. Yin Z., Geng R., Li Y.: CT clinical manifestations in the diagnosis of hepatic veno-occlusive disease. Chin J 2015; 13: pp. 61-62. 69
24. Kan X., Ye J., Rong X., et. al.: Diagnostic performance of contrast-enhanced CT in pyrrolizidine alkaloids-induced hepatic sinusoidal obstructive syndrome. Nat Publ Gr 2016; 6: pp. 1-8.
25. Arai S., Lee L.A., Vogelsang G.B.: A systematic approach to hepatic complications in hematopoietic stem cell transplantation. J Hematother Stem Cell Res 2002; 11: pp. 215-229. Available at: http://www.ncbi.nlm.nih.gov/entrez/query.fcgi?db=pubmed&cmd=Retrieve&dopt=AbstractPlus&list_uids=11983095
26. Alpert L.I.: Veno-occlusive disease of the liver associated with oral contraceptives: case report and review of literature. Hum Pathol 1976; 7: pp. 709-718. Available at: http://www.ncbi.nlm.nih.gov/pubmed/992650
27. Fajardo L.F., Colby T.V.: Pathogenesis of veno-occlusive liver disease after radiation. Arch Pathol Lab Med 1980; 104: pp. 584-588.
28. Jones R.J., Lee K.S., Beschorner W.E., et. al.: Venoocclusive disease of the liver following bone marrow transplantation. Transplantation 1987; 44: pp. 778-783.
29. McDonald G.B., Sharma P., Matthews D.E., et. al.: Venocclusive disease of the liver after bone marrow transplantation: diagnosis, incidence, and predisposing factors. Hepatology 1984; 4: pp. 116-122.
30. Erturk S.M., Mortelé K.J., Binkert C.A., et. al.: CT features of hepatic venoocclusive disease and hepatic graft-versus-host disease in patients after hematopoietic stem cell transplantation. AJR Am J Roentgenol 2006; 186: pp. 1497-1501.
31. Jin X., Zhang K., Jin G.: Diagnostic value of dynamic contrast-enhanced CT on hepatic veno-occlusive disease. Clin Med Eng 2013; 20: pp. 519-520.
32. Zhou H., Wang Y.X., Lou H.Y., et. al.: Hepatic sinusoidal obstruction syndrome caused by herbal medicine: CT and MRI features. Korean J Radiol 2014; 15: pp. 218-225.
33. Lee W., Chung J.W., Kim H.B., et. al.: Acute hepatic vein occlusion: spiral CT findings in an experimental study. Abdom Imaging 2002; 27: pp. 527-535.
34. Zeng X., Zhang Y., Kwong J.S.W., et. al.: The methodological quality assessment tools for preclinical and clinical studies, systematic review and meta-analysis, and clinical practice guideline: a systematic review. J Evid Based Med 2015; 8: pp. 2-10.
35. Rostom A., Dubé C., Cranney A., et. al.: Celiac disease. Rockville (MD): Agency for Healthcare Research and Quality (US); 2004 September (Evidence Reports/Technology Assessments, No. 104.) Appendix D. Quality Assessment Forms; Available at: https://www.ncbi.nlm.nih.gov/books/NBK35156/ Accessed August 28, 2017
36. Hu J., Dong Y., Chen X., et. al.: Prevalence of suicide attempts among Chinese adolescents: a meta-analysis of cross-sectional studies. Compr Psychiatry 2015; 61: pp. 78-89.
37. Stang A.: Critical evaluation of the Newcastle-Ottawa scale for the assessment of the quality of nonrandomized studies in meta-analyses. Eur J Epidemiol 2010; 25: pp. 603-605.
38. Aziz O., Constantinides V., Tekkis P.P., et. al.: Laparoscopic versus open surgery for rectal cancer: a meta-analysis. Ann Surg Oncol 2006; 13: pp. 413-424.
39. Miller J.J.: The inverse of the Freeman-Tukey double arcsine transformation. Am Stat 1978; 32: pp. 138.
40. Devillé W.L., Buntinx F., Bouter L.M., et. al.: Conducting systematic reviews of diagnostic studies: didactic guidelines. BMC Med Res Methodol 2002; 2: pp. 9.
41. Higgins J.P.T., Thompson S.G., Deeks J.J., et. al.: Measuring inconsistency in meta-analyses. BMJ 2003; 327: pp. 557-560.
42. Egger M., Davey Smith G., Schneider M., et. al.: Bias in meta-analysis detected by a simple, graphical test. Br Med J (Clin Res Ed) 1997; 315: pp. 629-634.
43. Schwarzer G.: Meta: an R package for meta-analysis. R News 2007; 7: pp. 40-45. Available at: https://www.researchgate.net/publication/285729385_meta_An_R_Package_for_Meta-Analysis
44. Helmy A.: Review article: updates in the pathogenesis and therapy of hepatic sinusoidal obstruction syndrome. Aliment Pharmacol Ther 2006; pp. 11-25.
45. Gaba R.C., Grace Knuttinen M., Brodsky T.R., et. al.: Hepatic steatosis: correlations of body mass index, CT fat measurements, and liver density with biopsy results. Diagn Interv Radiol 2012; 18: pp. 282-287.
46. Janssen H.L.A., Garcia-Pagan J.-C., Elias E., et. al.: Budd-Chiari syndrome: a review by an expert panel. J Hepatol 2003; 38: pp. 364-371. Available at: http://www.ncbi.nlm.nih.gov/pubmed/12586305
47. Arai K., Kawai K., Kohda W., et. al.: Dynamic CT of acute cholangitis: early inhomogeneous enhancement of the liver. Am J Roentgenol 2003; 181: pp. 115-118.
48. Gish R.G., Basit S.A., Stone C.D.: Portal vein thrombosis. Clin Liver Dis 2015; 19: pp. 199-221.
49. Seijo-Rios S., Garcia-Pagan J.C.: Portal vein thrombosis. Gastroenterol Hepatol 2010; pp. 179-190.