
Rationale and Objectives
This study aimed to provide decision support for the human expert, to categorize liver metastases into their primary cancer sites. Currently, once a liver metastasis is detected, the process of finding the primary site is challenging, time-consuming, and requires multiple examinations. The proposed system can support the human expert in localizing the search for the cancer source by prioritizing the examinations to probable cancer sites.
Materials and Methods
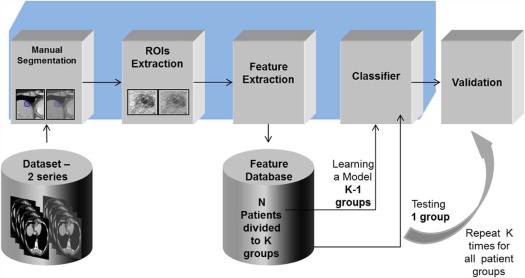
The suggested method is a learning-based approach, using computed tomography (CT) data as the input source. Each metastasis is circumscribed by a radiologist in portal phase and in non-contrast CT images. Visual features are computed from these images, combined into feature vectors, and classified using support vector machine classification. A variety of different features were explored and tested. A leave-one-out cross-validation technique was conducted for classification evaluation. The methods were developed on a set of 50 lesion cases taken from 29 patients.
Results
Experiments were conducted on a separate set of 142 lesion cases taken from 71 patients with four different primary sites. Multiclass categorization results (four classes) achieved low accuracy results. However, the proposed system was found to provide promising results of 83% and 99% for top-2 and top-3 classification tasks, respectively. Moreover, when compared to the experts’ ability to distinguish the different metastases, the system shows improved results.
Conclusions
Automated systems, such as the one proposed, show promising new results and demonstrate new capabilities that, in the future, will be able to provide decision and treatment support for radiologists and oncologists, toward more efficient detection and treatment of cancer.
Introduction
Computed tomography (CT) is one of the most common modalities used for the detection, diagnosis, and follow-up of liver lesions , with the images acquired before and after intravenous injection of a contrast agent (Iohexol 350 mg/mL up to 2 mL/kg) and oral contrast agent (Iohexol 350 mg/mL 52 mL diluted in 2 L water). Radiologists usually detect and diagnose liver lesions based on the different density of the lesions at different time points in the scan.
The liver is one of the most common organs to develop metastases. Metastatic liver lesions can be derived from different primary cancer types, including melanoma, breast cancer, colon cancer, neuroendocrine, pancreatic cancer, and others. Not infrequently when liver metastases are detected, the radiologists do not know the location of the primary site of cancer. In these cases, a broad search for the source of the primary tumor is performed. In some cases, the source of the cancer remains unknown, despite a thorough physical examination including breast, pelvic and rectal examination, basic laboratory tests, urinalysis, X-rays, CT scans, and other imaging studies. Knowing the source of the primary tumor is important to help localize the search, for example, colonoscopy for colon carcinoma, gastroscopy for gastric carcinoma, etc, and to treat it accordingly.
Get Radiology Tree app to read full this article<
Get Radiology Tree app to read full this article<
Methods
Data Description
Get Radiology Tree app to read full this article<
Get Radiology Tree app to read full this article<
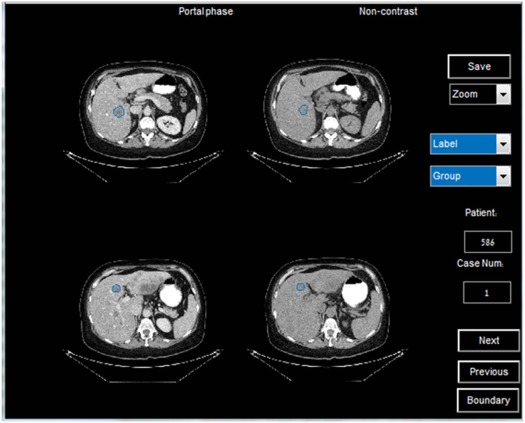
from 2009 to 2014. Different CT scanners were used with 0.7090- to 1.1719-mm pixel spacing, 1.25- to 5-mm slice thickness, 120 kVp, and different convolution kernels (GE—standard/CHST, Siemens—B31s, Phillips—B/C). The scans were selected and marked by a radiologist. They include 100 patients with 192 lesions. A development set was used to establish the proposed system, and a separate evaluation set was used so we could test our system on a new dataset. The data were divided as follows: 29 patients with 50 lesions in the development set and 71 patients with 142 lesion cases in the evaluation set. Only initial CT examinations were used for each patient to make sure no treatment was provided as different treatments can affect the lesion’s appearance on the CT scans. The data include various liver metastatic lesions derived from different primary sites showing melanoma, breast cancer, colorectal cancer, and pancreatic cancer. Examples of different metastases (portal phase and non-contrast [NC]) derived from various primary sites are presented in Figure 1 . The examples in Figure 1 show the visual similarity between metastases from different primary sites. Although in some cases lesions can be distinguished using texture features or Hounsfield unit levels, such features cannot be used in other cases because the intraclass variability is high. In addition, the lesion’s boundary in the NC CT images is obscure and very difficult to segment. These factors provide insights into the difficulty of the task. The number of lesions and patients per category is summarized in Table 1 for the evaluation and the development set.
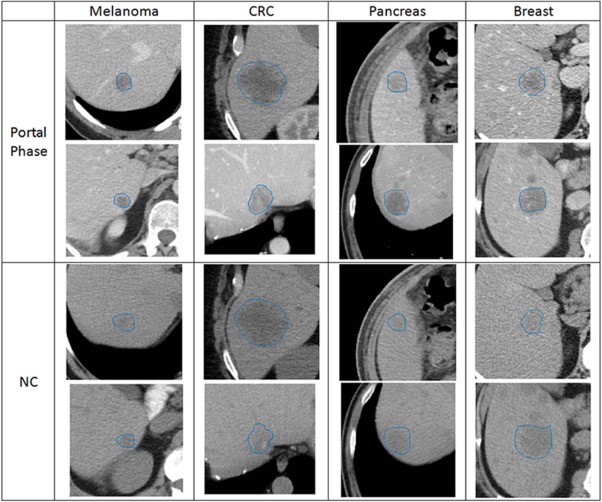
TABLE 1
Evaluation and Development Datasets
Primary Melanoma CRC Pancreas Breast Total Evaluation Lesions 31 43 33 35 142 Patients 17 21 17 16 71 Development Lesions 9 15 12 14 50 Patients 6 8 7 8 29
CRC, colorectal cancer.
Get Radiology Tree app to read full this article<
General Framework
Get Radiology Tree app to read full this article<
Get Radiology Tree app to read full this article<
Feature Extraction
Get Radiology Tree app to read full this article<
Hand-crafted Features
Get Radiology Tree app to read full this article<
Get Radiology Tree app to read full this article<
Get Radiology Tree app to read full this article<
Get Radiology Tree app to read full this article<
Get Radiology Tree app to read full this article<
Get Radiology Tree app to read full this article<
Get Radiology Tree app to read full this article<
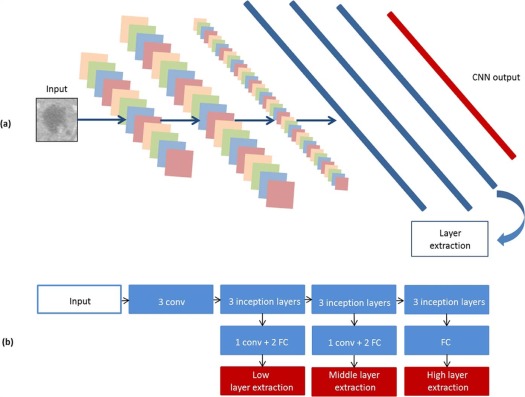
Convolutional Neural Networks Features
Get Radiology Tree app to read full this article<
Get Radiology Tree app to read full this article<
Get Radiology Tree app to read full this article<
Get Radiology Tree app to read full this article<
Classification
Class Balancing
Get Radiology Tree app to read full this article<
Support Vector Machine (SVM)
Get Radiology Tree app to read full this article<
k(x,xi)=e−γ∥x−xi∥ k
(
x
,
x
i
)
=
e
−
γ
‖
x
−
x
i
‖
Get Radiology Tree app to read full this article<
Get Radiology Tree app to read full this article<
Get Radiology Tree app to read full this article<
Validation
Get Radiology Tree app to read full this article<
Experiments and Results
Get Radiology Tree app to read full this article<
Experts Performance
Get Radiology Tree app to read full this article<
Get Radiology Tree app to read full this article<
Get Radiology Tree app to read full this article<
Get Radiology Tree app to read full this article<
Discriminative Features Analysis
Get Radiology Tree app to read full this article<
Get Radiology Tree app to read full this article<
TABLE 2
Top-1, Top-2, and Top-3 Accuracy Results Using Different Sets of Hand-crafted Features, CNN Features with and without Feature Selection, and Selected Features Using NC, Portal Phase, or Both on the Development Set
Features Top-1 ACC Top-2 ACC Top-3 ACC Hand crafted Texture 0.52 0.76 0.97 All hand crafted 0.52 0.72 0.93 Relative measures 0.45 0.72 0.79 Gray levels 0.41 0.69 0.90 Shape 0.41 0.62 0.83 CNN features CNN low selection0.620.83 0.97 CNN middle selection 0.58 0.76 0.93 CNN high selection 0.48 0.66 0.79 CNN avg. selection 0.55 0.72 0.86 CNN all selection0.62 0.79 0.97 CNN low 0.48 0.66 0.79 CNN middle 0.58 0.79 0.83 CNN high 0.48 0.66 0.83 CNN avg. 0.48 0.66 0.83 CNN all 0.48 0.72 0.86 NC and Portal Texture—portal 0.48 0.72 0.97 Texture—NC 0.52 0.72 0.90 Texture—both 0.52 0.76 0.97 CNN low selection—portal0.62 0.791.0 CNN low selection—NC 0.52 0.76 0.97 CNN low selection—both0.620.83 0.97
ACC, accuracy; CNN, convolutional neural networks; NC, non-contrast.
Get Radiology Tree app to read full this article<
Get Radiology Tree app to read full this article<
Get Radiology Tree app to read full this article<
Get Radiology Tree app to read full this article<
Automated System Performance
Get Radiology Tree app to read full this article<
Get Radiology Tree app to read full this article<
TABLE 3
Top-1, Top-2, and Top-3 Accuracy Results on the Evaluation Set Using Texture Features and Features Extracted From the CNN
Features Top-1 ACC Top-2 ACC Top-3 ACC Texture 0.56 0.66 0.90 CNN low-layer selection 0.50 0.66 0.90
ACC, accuracy; CNN, convolutional neural networks.
Get Radiology Tree app to read full this article<
Get Radiology Tree app to read full this article<
Get Radiology Tree app to read full this article<
TABLE 4
Top-1, Top-2, and Top-3 Accuracy Results Comparison on the Evaluation Set Using Texture Features, Features Extracted From the CNN, and Age and Gender Information
Features Top-1 ACC Top-2 ACC Top-3 ACC Age and gender 0.54 0.76 0.94 Texture, age, and gender 0.61 0.81 0.94 CNN low selection and age and gender 0.56 0.83 0.99
Get Radiology Tree app to read full this article<
Discussion
Get Radiology Tree app to read full this article<
Get Radiology Tree app to read full this article<
Get Radiology Tree app to read full this article<
Get Radiology Tree app to read full this article<
Get Radiology Tree app to read full this article<
Conclusions
Get Radiology Tree app to read full this article<
Get Radiology Tree app to read full this article<
Acknowledgment
Get Radiology Tree app to read full this article<
Get Radiology Tree app to read full this article<
Get Radiology Tree app to read full this article<
Get Radiology Tree app to read full this article<
References
1. Hopper K.D., Singapuri K., Finkel A.: Body CT and oncologic imaging 1. Radiology 2000; 215: pp. 27-40.
2. Hainsworth J.D., Rubin M.S., Spigel D.R., et. al.: Molecular gene expression profiling to predict the tissue of origin and direct site-specific therapy in patients with carcinoma of unknown primary site: a prospective trial of the Sarah Cannon Research Institute. J Clin Oncol 2013; 31: pp. 217-223.
3. Handorf C.R., Kulkarni A., Grenert J.P., et. al.: A multicenter study directly comparing the diagnostic accuracy of gene expression profiling and immunohistochemistry for primary site identification in metastatic tumors. Am J Surg Pathol 2013; 37: pp. 1067-1075.
4. Weiss L.M., Chu P., Schroeder B.E., et. al.: Blinded comparator study of immunohistochemical analysis versus a 92-gene cancer classifier in the diagnosis of the primary site in metastatic tumors. J Mol Diagn 2013; 15: pp. 263-269.
5. Segal E., Sirlin C.B., Ooi C., et. al.: Decoding global gene expression programs in liver cancer by noninvasive imaging. Nat Biotechnol 2007; 25: pp. 675-680.
6. Napel S.A., Beaulieu C.F., Rodriguez C., et. al.: Automated retrieval of CT images of liver lesions on the basis of image similarity: method and preliminary results 1. Radiology 2010; 256: pp. 243-252.
7. Quatrehomme A., Millet I., Hoa D., et. al.: Assessing the classification of liver focal lesions by using multi-phase computer tomography scans.Medical content-based retrieval for clinical decision support.2013.Springerpp. 80-91.
8. Duda D., Kretowski M., Bezy-Wendling J.: Computer-aided diagnosis of liver tumors based on multi-image texture analysis of contrast-enhanced CT selection of the most appropriate texture features. Stud Log Grammar Rhetor 2013; 35: pp. 49-70.
9. Ojala T., Pietikäinen M., Harwood D.: A comparative study of texture measures with classification based on featured distributions. Pattern Recognit 1996; 29: pp. 51-59.
10. Jain A.K., Farrokhnia F.: Unsupervised texture segmentation using Gabor filters.IEEE International Conference on Systems, Man and Cybernetics, 1990. Conference proceedings.1990.IEEEpp. 14-19.
11. Rangayyan R.M., El-Faramawy N.M., Desautels J.L., et. al.: Measures of acutance and shape for classification of breast tumors. IEEE Trans Med Imaging 1997; 16: pp. 799-810.
12. Cheng Y.: Mean shift, mode seeking, and clustering. IEEE Trans Pattern Anal Mach Intell 1995; 17: pp. 790-799.
13. LeCun Y., Bottou L., Bengio Y., et. al.: Gradient-based learning applied to document recognition. P IEEE 1998; 86: pp. 2278-2324.
14. Bar Y., Diamant I., Wolf L., et. al.: Chest pathology detection using deep learning with non-medical training.2015 IEEE 12th International Symposium on Biomedical Imaging (ISBI).2015.IEEEpp. 294-297.
15. Szegedy C., Liu W., Jia Y., et. al.: Going deeper with convolutions.Proceedings of the IEEE conference on computer vision and pattern recognition.2015.IEEEpp. 1-9.
16. Bishop C.M.: Neural networks for pattern recognition.1995.Oxford University Press
17. He H., Garcia E.A.: Learning from imbalanced data. IEEE Trans Knowl Data Eng 2009; 21: pp. 1263-1284.
18. Lian C., Ruan S., Denœux T., et. al.: Robust cancer treatment outcome prediction dealing with small-sized and imbalanced data from FDG-PET images.International Conference on medical image computing and computer-assisted intervention.2016.Springerpp. 61-69.
19. Foody G.M., Mathur A.: A relative evaluation of multiclass image classification by support vector machines. IEEE Trans Geosci Remote Sens 2004; 42: pp. 1335-1343.
20. Chang C.-C., Lin C.-J.: LIBSVM: a library for support vector machines. ACM Trans Intell Syst Technol 2011; 2: pp. 27:1-27:27.
21. Platt J.: Fast training of support vector machines using sequential minimal optimization.Schölkopf B.Burges C.J.C.Smola A.J.Advances in kernel methods support vector learning.1999.MIT PressCambridge, MA:pp. 185-208.
22. Ozel B., Pickhardt P.J., Kim D.H., et. al.: Accuracy of routine nontargeted CT without colonography technique for the detection of large colorectal polyps and cancer. Dis Colon Rectum 2010; 53: pp. 911-918.