
Rationale and Objectives
To identify micro–computed tomography (CT) imaging biomarkers for evaluating the effects of emodin, a potential drug to treat osteoporosis, in the mouse model of lipopolysaccharide (LPS)-mediated osteoporosis.
Materials and Methods
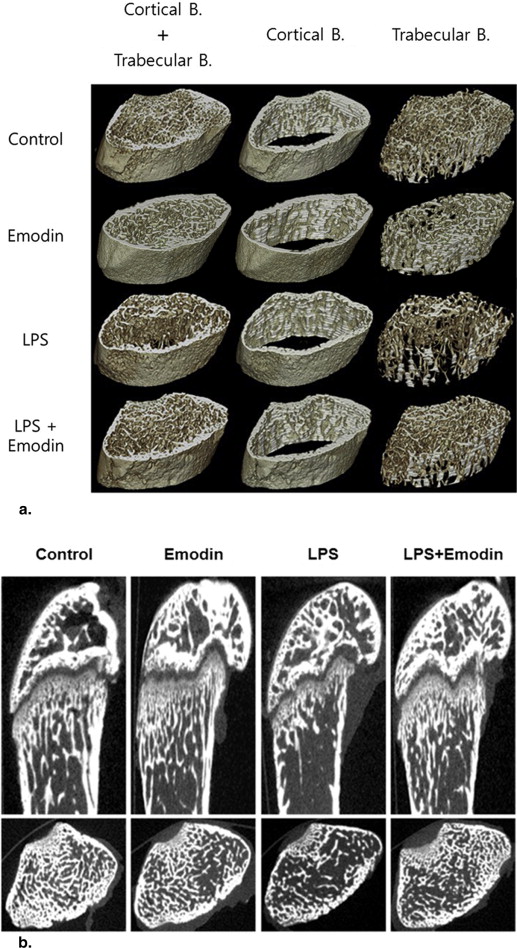
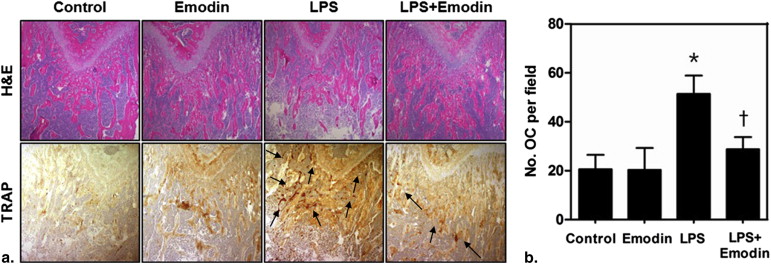
Forty male imprinting control region (ICR) mice with LPS-induced bone resorption were equally divided into four experimental groups: phosphate-buffered saline–treated (control), emodin-treated, LPS-treated, and LPS + emodin–treated groups. Emodin (50 mg/kg) was administered orally on alternate days for 8 days, and LPS (5 mg/kg) was injected intraperitoneally on days 1 and 4. After 8 days, the mice were sacrificed, and micro-CT images of the left proximal femurs were obtained. Three-dimensional images were analyzed by using commercial software to measure the bone volume to total volume fraction (BV/TV), trabecular number (Tb-N), trabecular thickness (Tb-Th), and trabecular separation (Tb-Sp) as CT imaging biomarkers. Histologic analyses of the femurs were performed using hematoxylin and eosin and tartrate-resistant acid phosphatase (TRAP) immunohistochemical staining.
Results
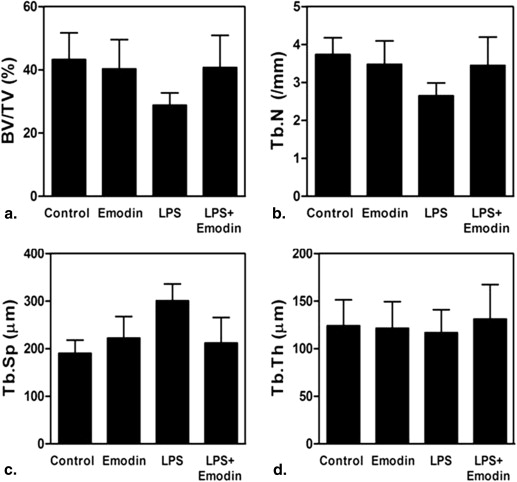
The LPS + emodin–treated group demonstrated marked suppression of LPS-induced bone resorption compared to the LPS-treated group (BV/TV, 28.84% vs. 40.76%; Tb-N, 2.65 vs. 3.45 mm −1 ; Tb-Sp, 300.81 vs. 212.31 μm; Tb-Th, 116.94 vs. 131.25 μm). TRAP immunohistochemical analysis showed fewer osteoclasts per field of tissue in the LPS + emodin–treated group than in the LPS-treated group (27.8 vs. 41.8). The BV/TV, Tb-N, and Tb-Sp data correlated well with the histomorphometric findings.
Conclusions
The findings reveal a novel effect of emodin on bone remodeling in the LPS-mediated osteoporotic mouse model. The ex vivo micro-CT imaging is a promising tool for assessing the therapeutic effects of potential drugs on osteoporosis.
Osteoporosis is a bone disorder characterized by bone mass decline and trabecular architecture deterioration, leading to increased bone fragility and risk of spontaneous fracture . An imbalance in bone remodeling, a physiological process characterized by bone formation by osteoblasts and bone resorption by osteoclasts, causes most of the adult skeletal diseases including osteoporosis . The literature includes many studies of bone remodeling to prevent and overcome osteoporosis.
Emodin (3-methyl-1,6,8-trihydroxyanthraquinone) is a natural compound present in the roots and bark of numerous plants of the genus Rhamnus , a herb widely used as a laxative in traditional Chinese medicine . It reportedly has a variety of biological activities, such as anticancer, vasorelaxative, immunosuppressive, anti-inflammatory, and wound-healing properties . The effect of emodin on bone remodeling has been studied in vitro: it was found to have a beneficial effect on bone health with anabolic activity to prevent osteoporosis . However, no study on the pharmacologic role or biologic effects of emodin has been performed in an animal model until now.
Get Radiology Tree app to read full this article<
Get Radiology Tree app to read full this article<
Get Radiology Tree app to read full this article<
Materials and methods
Mouse Model and Experimental Groups
Get Radiology Tree app to read full this article<
Micro-CT System
Get Radiology Tree app to read full this article<
Image Analysis
Get Radiology Tree app to read full this article<
Histologic Analysis
Get Radiology Tree app to read full this article<
Statistical Analysis
Get Radiology Tree app to read full this article<
Results
Imaging Findings
Get Radiology Tree app to read full this article<
Table 1
Mean (SD) Values of the Bone Parameters Measured by Micro-CT Analysis
Parameter Control Emodin LPS LPS + Emodin_P_ ∗ BV/TV (%) 43.30 (8.41) 40.33 (9.25) 28.84 (3.87) 40.76 (10.16) .000 Tb-N (mm −1 ) 3.74 (0.44) 3.48 (0.62) 2.65 (0.34) 3.45 (0.75) .005 Tb-Sp (μm) 190.40 (27.60) 222.50 (45.44) 300.81 (35.40) 212.31 (53.37) .000 Tb-Th (μm) 124.19 (27.20) 121.60 (27.81) 116.94 (24.13) 131.25 (36.23) .788
BV/TV, bone volume/total volume fraction; CT, computed tomography; LPS, lipopolysaccharide; SD, standard deviation; Tb-N, trabecular number; Tb-Sp, trabecular separation; Tb-Th, trabecular thickness.
Get Radiology Tree app to read full this article<
Get Radiology Tree app to read full this article<
Get Radiology Tree app to read full this article<
Table 2
Results of the Mann–Whitney Test
Parameter Control versus Emodin Control versus LPS Control versus LPS + Emodin LPS versus LPS + Emodin BV/TV .218 .000 .315 .000 Tb-N .505 .000 .130 .015 Tb-Sp .123 .000 .089 .000
BV/TV, bone volume/total volume fraction; LPS, lipopolysaccharide; Tb-N, trabecular number; Tb-Sp, trabecular separation.
Get Radiology Tree app to read full this article<
Histologic Findings
Get Radiology Tree app to read full this article<
Get Radiology Tree app to read full this article<
Discussion
Get Radiology Tree app to read full this article<
Get Radiology Tree app to read full this article<
Get Radiology Tree app to read full this article<
Get Radiology Tree app to read full this article<
Get Radiology Tree app to read full this article<
Get Radiology Tree app to read full this article<
Acknowledgment
Get Radiology Tree app to read full this article<
References
1. Kanis J.A., Melton L.J., Christiansen C., et. al.: The diagnosis of osteoporosis. J Bone Miner Res 1994; 9: pp. 1137-1141.
2. van der Klift M., de Laet C.D., Pols H.A.: Assessment of fracture risk: who should be treated for osteoporosis?. Best Pract Res Clin Rheumatol 2005; 19: pp. 937-950.
3. Shi Y.Q., Fukai T., Sakagami H., et. al.: Cytotoxic and DNA damage-inducing activities of low molecular weight phenols from rhubarb. Anticancer Res 2001; 21: pp. 2847-2853.
4. Srinivas G., Babykutty S., Sathiadevan P.P., et. al.: Molecular mechanism of emodin action: transition from laxative ingredient to an antitumor agent. Med Res Rev 2007; 27: pp. 591-608.
5. Kuo Y.C., Meng H.C., Tsai W.J.: Regulation of cell proliferation, inflammatory cytokine production and calcium mobilization in primary human T lymphocytes by emodin from Polygonum hypoleucum Ohwi. Inflamm Res 2001; 50: pp. 73-82.
6. Huang H.C., Lee C.R., Chao P.D., et. al.: Vasorelaxant effect of emodin, an anthraquinone from a Chinese herb. Eur J Pharmacol 1991; 205: pp. 289-294.
7. Tang T., Yin L., Yang J., et. al.: Emodin, an anthraquinone derivative from Rheum officinale Baill, enhances cutaneous wound healing in rats. Eur J Pharmacol 2007; 567: pp. 177-185.
8. Lee S.U., Shin H.K., Min Y.K., et. al.: Emodin accelerates osteoblast differentiation through phosphatidylinositol 3-kinase activation and bone morphogenetic protein-2 gene expression. Int Immunopharmacol 2008; 8: pp. 741-747.
9. Barou O., Valentin D., Vico L., et. al.: High-resolution three-dimensional micro-computed tomography detects bone loss and changes in trabecular architecture early: comparison with DEXA and bone histomorphometry in a rat model of disuse osteoporosis. Invest Radiol 2002; 37: pp. 40-46.
10. Waarsing J.H., Day J.S., Weinans H.: Longitudinal micro-CT scans to evaluate bone architecture. J Musculoskelet Neuronal Interact 2005; 5: pp. 310-312.
11. Thomsen J.S., Laib A., Koller B., et. al.: Stereological measures of trabecular bone structure: comparison of 3D micro computed tomography with 2D histological sections in human proximal tibial bone biopsies. J Microsc 2005; 218: pp. 171-179.
12. Recker R., Masarachia P., Santora A., et. al.: Trabecular bone microarchitecture after alendronate treatment of osteoporotic women. Curr Med Res Opin 2005; 21: pp. 185-194.
13. Lee Y.S., Heo E.A., Jun H.Y., et. al.: Articular cartilage imaging by the use of phase-contrast tomography in a collagen-induced arthritis mouse model. Acad Radiol 2010; 17: pp. 244-250.
14. Miyaura C., Inada M., Matsumoto C., et. al.: An essential role of cytosolic phospholipase A2alpha in prostaglandin E2-mediated bone resorption associated with inflammation. J Exp Med 2003; 197: pp. 1303-1310.
15. Campbell G.M., Buie H.R., Boyd S.K.: Signs of irreversible architectural changes occur early in the development of experimental osteoporosis as assessed by in vivo micro-CT. Osteoporos Int 2008; 19: pp. 1409-1419.
16. Hildebrand T., Laib A., Muller R., et. al.: Direct three-dimensional morphometric analysis of human cancellous bone: microstructural data from spine, femur, iliac crest, and calcaneus. J Bone Miner Res 1999; 14: pp. 1167-1174.
17. Khajuria D.K., Razdan R., Mahapatra D.R.: Drugs for the management of osteoporosis: a review. Rev Bras Reumatol 2011; 51: pp. 365-371. 379-382
18. Hohenhaus M.H., McGarry K.A., Col N.F.: Hormone therapy for the prevention of bone loss in menopausal women with osteopenia: is it a viable option?. Drugs 2007; 67: pp. 2311-2321.
19. Reginster J.Y., Burlet N.: Osteoporosis: a still increasing prevalence. Bone 2006; 38: pp. S4-S9.
20. Lems W.F., den Heijer M.: Established and forthcoming drugs for the treatment of osteoporosis. Neth J Med 2013; 71: pp. 188-193.