
Rationale and Objectives
This study aimed to determine the appropriate body mass index (BMI)-dependent noise index (NI) setting in computed tomography pulmonary angiography (CTPA) with automatic tube current modulation with adaptive statistical iterative reconstruction (ASiR).
Materials and Methods
A total of 480 patients who had a CTPA were divided into group A (18.5 kg/m 2 ≤ BMI < 25 kg/m 2 ), group B (25 kg/m 2 ≤ BMI < 30 kg/m 2 ), and group C (BMI ≥ 30 kg/m 2 ), according to their BMI values; each group had 160 patients. The three groups were further randomly divided into four subgroups: A1, A2, A3, A4; B1, B2, B3, B4; and C1, C2, C3, C4, with corresponding NI values of 26, 36, 40, and 46, respectively. All images were restructured with the ASiR algorithm, and the images with the lowest NI (26 Hounsfield units) in each group were used as reference standard. The signal-to-noise ratio (SNR) and contrast-to-noise ratio (CNR) for the pulmonary artery of each group were calculated. Subjective image quality was evaluated using a five-score method by two independent radiologists. The CT dose index of volume and dose-length product were recorded and were converted to effective dose (ED). SNR and CNR in the group A, B, and C subgroups were compared to repeated measures analysis of variance, and the subjective score, Volumetric CT dose index of volume, dose-length product, and ED were compared to one-way analysis of variance.
Results
For groups A and B, the SNR, CNR, and subjective scores of the images in their subgroups showed no statistical differences ( P > .05). The ED in subgroups A4 and B4 was significantly lower than that in subgroups A1 (by 33.24%) and B1 (by 34.47%) ( P < .01). For group C, there was no significant difference in the SNR, CNR, and the subjective image scores between subgroups C3 and C1 ( P > .05). The ED in subgroup C3 was significantly lower than the ED in subgroup C1 (by 47.75%) ( P < .01)
Conclusions
Patient BMI-dependent NI settings that are higher than the recommended value may be used in CTPA with automatic tube current modulation and ASiR to effectively reduce radiation dose while maintaining diagnostic image quality.
Introduction
Computed tomography pulmonary angiography (CTPA) is currently a widely accessible and quick to perform technique for patients suspected of having pulmonary embolism (PE) in clinic , and it has a high sensitivity (94%–100%) and specificity (89%–100%) for the diagnosis of acute PE . However, the amount of radiation exposure to the patient population in CTPA and its risks have also increased concerns regarding potential radiation damage . Thus, reducing the radiation dose on CTPAstudies has become a priority for radiologists. For clinical populations in particular, it is important to reduce radiation dose by reducing the tube current . The automatic tube current modulation (ATCM) technique selects the optimal tube current in an automated manner by using the attenuation values on anteroposterior and lateral scanogram, and it is an important method to reduce radiation dose. In one implementation of ATCM technique, the noise index (NI) value can be used to control the output of the tube current, so the NI is used as an indirect representation of image quality. However, reducing the tube current can increase image noise and adversely affect image quality. Higher image noise can be reduced by different advanced reconstruction algorithms in maintaining low radiation doses; adaptive statistical iterative reconstruction (ASiR) is a widely used and effective way to reduce noise and maintain image quality .
To our knowledge, no one has compared image quality and radiation dose in CTPA for the combination of different NI settings and different body mass index (BMI) values. The purpose of our study was to determine the appropriate BMI-dependent noise NI setting in CTPA with ATCM and ASiR algorithm by comparing radiation dose and image quality to the combination of different NI values and BMI values to maximize dose reduction while maintaining image quality.
Materials and Methods
Patient Population
Get Radiology Tree app to read full this article<
Table 1
Patient Characteristics
Parameter Group A (n = 160) Group B (n = 160) Group C (n = 160)P Value Patient characteristic Age (y) \* 56.5 ± 17.8 57.7 ± 18.2 55.9 ± 17.6 .6567 Weight (kg) \* 62.5 ± 8.1 67.7 ± 7.8 79.5 ± 7.4 .0971 Height (cm) \* 169 ± 12.7 168 ± 13.2 160 ± 14.5 .4157 F/M 81/79 77/83 74/86 .7344 Axial length (mm) \* 313 316 310 .551
Get Radiology Tree app to read full this article<
Get Radiology Tree app to read full this article<
CT Scan Protocols and Radiation Dose Estimation
Get Radiology Tree app to read full this article<
Get Radiology Tree app to read full this article<
Objective Evaluation of Image Quality
Get Radiology Tree app to read full this article<
Get Radiology Tree app to read full this article<
Get Radiology Tree app to read full this article<
Subjective Evaluation of Image Quality
Get Radiology Tree app to read full this article<
Statistical Analysis
Get Radiology Tree app to read full this article<
Results
Patient Demographics
Get Radiology Tree app to read full this article<
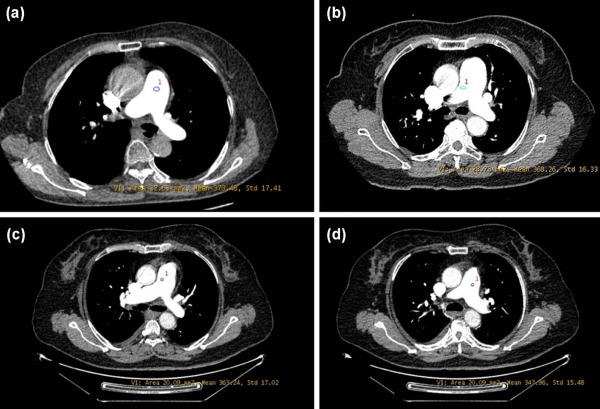
Quantitative and Qualitative Image Analysis
Get Radiology Tree app to read full this article<
Table 2
Objective Image Quality and Subjective Image Quality with ATCM Combination of Different NI Setting
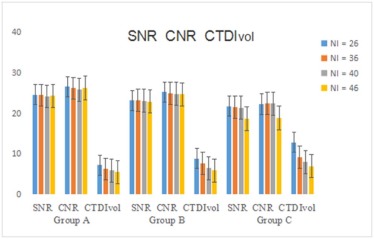
Mean Signal Intensity (HU) Mean Image Noise (HU) SNR CNR Subjective Image Scores Group A (18.5 kg/m 2 ≤ BMI < 25 kg/m 2 ) A1 385.7 ± 132.3 15.8 ± 3.2 24.6 ± 2.4 26.6 ± 2.6 4.54 ± 0.61 A2 382.7 ± 135.5 15.6 ± 3.3 24.5 ± 2.6 26.2 ± 2.4 4.55 ± 0.65 A3 378.6 ± 123.7 15.4 ± 3.1 24.2 ± 1.8 25.9 ± 3.5 4.53 ± 0.62 A4 379.6 ± 115.3 15.5 ± 3.7 24.3 ± 2.8 26.3 ± 2.3 4.52 ± 0.59P value all: n/s all: n/s all: n/s all: n/s all: n/s Group B (25 kg/m 2 ≤ BMI < 30 kg/m 2 ) B1 373.6 ± 123.7 16.2 ± 3.5 23.2 ± 2.3 25.3 ± 2.5 4.53 ± 0.58 B2 370.3 ± 122.3 16.1 ± 2.7 23.3 ± 2.6 24.9 ± 2.1 4.49 ± 0.60 B3 369.6 ± 127.6 16.3 ± 3.2 23.1 ± 2.1 24.8 ± 2.2 4.50 ± 0.53 B4 370.5 ± 125.8 16.5 ± 31 22.9 ± 1.6 24.7 ± 1.9 4.52 ± 0.48P value all: n/s all: n/s all: n/s all: n/s all: n/s Group C (BMI ≥ 30 kg/m 2 ) C1 364.6 ± 123.7 16.3 ± 3.5 22.1 ± 2.3 22.8 ± 2.5 4.53 ± 0.58 C2 365.3 ± 122.3 16.6 ± 2.7 21.6 ± 2.6 22.5 ± 2.1 4.49 ± 0.60 C3 364.6 ± 123.7 16.8 ± 3.3 21.7 ± 2.4 22.4 ± 2.4 4.48 ± 0.53 C4 349.5 ± 116.8 18.9 ± 3.6 18.7 ± 1.6 18.9 ± 1.9 4.12 ± 0.36P value 4vs1: .0082 4vs1: .0065 4vs1: .0038 4vs1: .0043 4vs1: .0016 4vs2: .0076 4vs2: .0057 4vs2: .0031 4vs2: .0055 4vs2: .0025 4vs3: .0071 4vs3: .0078 4vs3: .0052 4vs3: .0037 4vs3: .0021 rest: n/s rest: n/s rest: n/s rest: n/s rest: n/s
ATCM, automatic tube current modulation; BMI, body mass index; CNR, contrast-to-noise ratio; HU, Hounsfield unit; NI, noise index; SNR, signal-to-noise ratio.
Get Radiology Tree app to read full this article<
Get Radiology Tree app to read full this article<
Radiation Dose
Get Radiology Tree app to read full this article<
Table 3
Radiation Dose with ATCM Combination of Different NI Setting at Different BMI
Different NI Value 18.5 kg/m 2 ≤ BMI < 25 kg/m 2 25 kg/m 2 ≤ BMI < 30 kg/m 2 BMI ≧ 30 kg/m 2 CTDI vol DLP ED CTDI vol DLP ED CTDI vol DLP ED 26 7.21 ± 1.58 245.49 ± 21.68 3.61 ± 0.42 8.89 ± 1.43 266.53 ± 20.79 3.83 ± 0.62 12.88 ± 2.28 386.69 ± 29.68 6.22 ± 1.36 36 6.25 ± 1.42 185.33 ± 20.16 2.58 ± 0.31 7.63 ± 1.51 231.47 ± 19.58 2.93 ± 0.51 9.16 ± 1.63 255.23 ± 21.62 3.96 ± 0.48 40 5.91 ± 1.31 173.21 ± 19.86 2.49 ± 0.24 6.45 ± 1.44 202.73 ± 20.76 2.68 ± 0.44 8.02 ± 1.28 223 ± 20.32 3.25 ± 0.39 46 5.56 ± 1.22 160.08 ± 19.67 2.41 ± 0.18 5.93 ± 1.36 178.21 ± 20.26 2.51 ± 0.23 6.96 ± 1.22 190.08 ± 19.67 2.54 ± 0.33P value 46vs26: .00 46vs26: .00 46vs26: .00 46vs26: .00 46vs26: .00 46vs26: .00 46vs26: .00 46vs26: .00 46vs26: .00 40vs26: .03 40vs26: .00 40vs26: .02 40vs26: .00 40vs26: .00 40vs26: .00 40vs26: .00 40vs26: .00 40vs26: .00 36vs26: .04 36vs26: .02 36vs26: .00 36vs26: .05 36vs26: .01 36vs26: .00 36vs26: .00 36vs26: .00 36vs26: .00 rest:n/s rest:n/s rest:n/s rest:n/s rest:n/s rest:n/s 46vs36: .02 46vs36: .00 46vs36: .03 rest:n/s rest:n/s rest:n/s
ATCM, automatic tube current modulation; BMI, body mass index; CTDI vol , CT dose index of volume; DLP, dose-length product; ED, effective dose; NI, noise index.
Get Radiology Tree app to read full this article<
Discussion
Get Radiology Tree app to read full this article<
Get Radiology Tree app to read full this article<
Get Radiology Tree app to read full this article<
Get Radiology Tree app to read full this article<
Get Radiology Tree app to read full this article<
Get Radiology Tree app to read full this article<
References
1. Kuriakose J., Patel S.: Acute pulmonary embolism. Radiol Clin North Am 2010; 48: pp. 31-50.
2. Heyer C.M., Mohr P.S., Lemburg S.P., et. al.: Image quality and radiation exposure at pulmonary CT angiography with 100- or 120 kVp protocol: prospective randomized study. Radiology 2007; 245: pp. 577-583.
3. Winer-Muram H.T., Rydberg J., Johnson M.S., et. al.: Suspected acute pulmonary embolism: evaluation with multi-detector row CT versus digital subtraction pulmonary angiography. Radiology 2004; 233: pp. 806-815.
4. Wiest P.W., Locken J.A., Heintz P.H., et. al.: CT scanning: a major source of radiation exposure. Semin Ultrasound CT MR 2002; 23: pp. 402-410.
5. Pontana F., Pagniez J., Duhamel A., et. al.: Reduced-dose low-voltage chest CT angiography with sinogram-affirmed iterative reconstruction versus standard-dose filtered back projection. Radiology 2013; 267: pp. 609-618.
6. Singh S., Kalra M.K., Shenoy-Bhangle A.S., et. al.: Radiation dose reduction with hybrid iterative reconstruction for pediatric CT. Radiology 2012; 263: pp. 537-546.
7. Pontana F., Duhamel A., Pagniez J., et. al.: Chest computed tomography using iterative reconstruction vs filtered back projection. II. Image quality of low-dose CT examinations in 80 patients. Eur Radiol 2011; 21: pp. 636-643.
8. Baumueller S., Winklehner A., Karlo C., et. al.: Low-dose CT of the lung: potential value of iterative reconstructions. Eur Radiol 2012; 22: pp. 2597-2606.
9. Jia Y., Yue D., Ning H., et. al.: Low-dose computed tomography with adaptive statistical iterative reconstruction and low tube voltage in craniocervical computed tomographic angiography: impact of body mass index. J Comput Assist Tomogr 2015; 39: pp. 774-780.
10. Prakash P., Kalra M.K., Kambadakone A.K., et. al.: Reducing abdominal CT radiation dose with adaptive statistical iterative reconstruction technique. Invest Radiol 2010; 45: pp. 201-210.
11. Kallen J.A., Coughlin B.F., O’Loughlin M.T., et. al.: Reduced Z-axis coverage multidetector CT angiography for suspected acute pulmonary embolism could decrease dose and maintain diagnostic accuracy. Emerg Radiol 2010; 17: pp. 31-35.
12. Bongartz G., Golding S.J., Jurik A.J.: European guidelines for multi slice computed tomography: report EUR 16262 EN 2004.2004.European CommissionLuxembourg
13. Viteri-Ramírez G., García-Lallana A., Sim-on-Yarza I., et. al.: Low radiation and low-contrast dose pulmonary CT angiography: comparison of 80 kVp/60 ml and 100 kVp/80 ml protocols. Clin Radiol 2012; 67: pp. 833-839.
14. Spielmann A.L., Nelson R.C., Lowry C.R., et. al.: Liver: single breath-hold dynamic subtraction CT with multi-detector row helical technology feasibility study. Radiology 2002; 222: pp. 278-283.
15. Yuan R., Shuman W.P., Earls J.P., et. al.: Reduced iodine load at CT pulmonary angiography with dual-energy monochromatic imaging: comparison with standard CT pulmonary angiography – a prospective randomized trial. Radiology 2012; 262: pp. 290-297.
16. Schueller-Weidekamm C., Schaefer-Prokop C.M., Weber M., et. al.: CT angiography of pulmonary arteries to detect pulmonary embolism: improvement of vascular enhancement with low kilovoltage settings. Radiology 2006; 241: pp. 899-907.
17. Fanous R., Kashani H., Jimenez L., et. al.: Image quality and radiation dose of pulmonary CT angiography performed using 100 and 120 kVp. AJR Am J Roentgenol 2012; 199: pp. 990-996.
18. Behrendt F.F., Schmidt B., Plumhans C., et. al.: Image fusion in dual energy computed tomography: effect on contrast enhance signal-to-noise ratio and image quality in computed angiography. Invest Radiol 2009; 44: pp. l-6.
19. Vollmar S.V., Kalender W.A.: Reduction of dose to the female breast in thoracic CT: a comparison of standard-protocol, bismuth-shielded, partial and tube-current-modulated CT examinations. Eur Radiol 2008; 18: pp. 1674-1682.
20. Khawaja R.D., Singh S., Blake M., et. al.: Ultralow-dose abdominal computed tomography: comparison of 2 iterative reconstruction techniques in a prospective clinical study. J Comput Assist Tomogr 2015; 39: pp. 489-498.
21. Meer A.B., Basu P.A., Baker L.C., et. al.: Exposure to ionizing radiation and estimate of secondary cancers in the era of high-speed CT scanning: projections from the Medicare population. J Am Coll Radiol 2012; 9: pp. 245-250.
22. Lambert J.W., Phelps A.S., Courtier J.L., et. al.: Image quality and dose optimisation for infant CT using a paediatric phantom. Eur Radiol 2015; 26: pp. 1-9.
23. Kubo T., Lin P.J., Stiller W., et. al.: Radiation dose reduction in chest CT: a review. AJR Am J Roentgenol 2008; 190: pp. 335-343.
24. Tack D., Maertelaer V., Petit W., et. al.: Multi-detector row CT pulmonary angiography: comparison of standard-dose and simulated low-dose techniques. Radiology 2005; 236: pp. 318-325.
25. Lee S.H., Kim M.J., Yoon C.S., et. al.: Radiation dose reduction with the adaptive statistical iterative reconstruction (ASIR) technique for chest CT in children: an intra-individual comparison. Eur J Radiol 2012; 81: pp. e938-e943.
26. Vardhanabhuti V., Loader R.J., Mitchell G.R., et. al.: Image quality assessment of standard- and low-dose chest CT using filtered back projection, adaptive statistical iterative reconstruction, and novel model-based iterative reconstruction algorithms. AJR Am J Roentgenol 2013; 200: pp. 545-552.
27. Hague C.J., Krowchuk N., Alhassan D., et. al.: Qualitative and quantitative assessment of smoking-related lung disease: effect of iterative reconstruction on low-dose computed tomographic examinations. J Thorac Imaging 2014; 29: pp. 350-356.
28. Litmanovich D.E., Tack D.M., Shahrzad M., et. al.: Dose reduction in cardiothoracic CT: review of currently available methods. Radiographics 2014; 34: pp. 1469-1489.
29. Heyer C.M., Mohr P.S., Lemburg S.P., et. al.: Image quality and radiation exposure at pulmonary CT angiography with 100- or 120-kVp protocol: prospective randomized study. Radiology 2007; 245: pp. 577-583.
30. Matsuoka S., Hunsaker A., Gill P.R., et. al.: Vascular enhancement and image quality of MDCT pulmonary angiography in 400 cases: comparison of standard and low kilovoltage settings. AJR Am J Roentgenol 2009; 192: pp. 1651-1656.
31. Szucs-Farkas Z., Kurmann L., Strautz T., et. al.: Patient exposure and image quality of low-dose pulmonary computer tomography angiography: comparison of 100- and 80-kVp protocols. Invest Radiol 2008; 43: pp. 871-876.
32. Brenner D.J., Doll R., Goodhead D.T., et. al.: Cancer risks attributable to low doses of ionizing radiation: assessing what we really know. Proc Natl Acad Sci USA 2003; 100: pp. 13761e6.
33. Inada S., Masuda T., Maruyama N., et. al.: Study of CT automatic exposure control system (CT-AEC) optimization in CT angiography of lower extremity artery by considering contrast-to-noise ratio. J Med Imaging Radiat Oncol 2016; 72: pp. 21-30.
34. Boos J., Aissa J., Lanzman R.S., et. al.: CT angiography of the aorta using 80 kVp in combination with sinogram-affirmed iterative reconstruction and automated tube current modulation: effects on image quality andradiation dose. J Med Imaging Radiat Oncol 2016; 62: pp. 187-193.
35. Brenner D.J., Hall E.J.: Computed tomography – an increasing source of radiation exposure. N Engl J Med 2007; 357: pp. 2277e84.
36. Fazel R., Krumholz H.M., Wang Y., et. al.: Exposure to low-dose ionizing radiation from medical imaging procedures. N Engl J Med 2009; 361: pp. 849e57.
37. Bae K.T., Seeck B.A., Hildebolt C.F., et. al.: Contrast enhancement in cardiovascular MDCT: effect of body weight, height, body surface area, body mass index, and obesity. AJR Am J Roentgenol 2008; 190: pp. 777e84.
38. Bae K.T., Tao C., Gurel S., et. al.: Effect of patient weight and scanning duration on contrast enhancement during pulmonary multidetector CT angiography. Radiology 2007; 242: pp. 582e.