
Rationale and Objectives
Computed tomography texture analysis (CTTA) allows quantification of heterogeneity within a region of interest. This study investigates the possibility of distinguishing between several common renal masses using CTTA-derived parameters by developing and validating a predictive model.
Materials and Methods
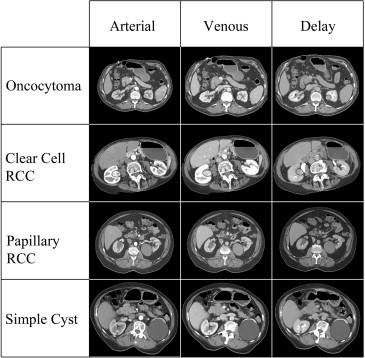
CTTA software was used to analyze 20 clear cell renal cell carcinomas (RCCs), 20 papillary RCCs, 20 oncocytomas, and 20 renal cysts. Regions of interest were drawn around each mass on multiple slices in the arterial, venous, and delayed phases on renal mass protocol CT scans. Unfiltered images and spatial band-pass filtered images were analyzed to quantify heterogeneity. Random forest method was used to construct a predictive model to classify lesions using quantitative parameters. The model was externally validated on a separate set of 19 unknown cases.
Results
The random forest model correctly categorized oncocytomas in 89% of cases (sensitivity = 89%, specificity = 99%), clear cell RCCs in 91% of cases (sensitivity = 91%, specificity = 97%), cysts in 100% of cases (sensitivity = 100%, specificity = 100%), and papillary RCCs in 100% of cases (sensitivity = 100%, specificity = 98%).
Conclusions
CTTA, in conjunction with random forest modeling, demonstrates promise as a tool to characterize lesions. Various renal masses were accurately classified using quantitative information derived from routine scans.
When confronted with an indeterminate renal mass on computed tomography (CT), the ability of a radiologist to accurately differentiate common histologic subtypes (such as clear cell renal cell carcinoma [RCC], papillary RCC, chromophobe RCC, oncocytomas, etc.) is limited to either an analysis of morphologic features or Hounsfield attenuations. Many studies have used some combinations of enhancement characteristics and lesion morphology to differentiate these masses, and although these various tumor types as groups tend to have different appearances and enhancement patterns, there is a significant overlap between lesion categories that prevents prospective prediction of a lesion’s underlying histology with high confidence . As a result, solid renal masses are usually surgically resected unless the patient is a poor surgical candidate or the lesion measures less than 2 cm in size. If more confident prospective characterization were possible, it is conceivable that lesions that were strongly thought to represent more indolent variants of RCC (ie, papillary and chromophobe RCC) or benign oncocytomas could be followed rather than resected.
Computed tomography texture analysis (CTTA) is a quantitative technique that allows users to characterize heterogeneity within a region of interest (ROI) based on the distribution of pixel intensities and gray-level values using both unfiltered and frequency filtered images by deriving quantitative texture parameters based on attributes of the pixel values themselves and the image histogram. This quantitative technique has been primarily used in a number of studies as a means of predicting patient outcomes and prognosis . However, there has been only limited application of this method toward lesion characterization and the differentiation of lesions with similar radiographic appearance (such as various types of solid renal masses), and although the few works that have dealt with this topic have demonstrated quantitative differences in texture variables between different lesions, they have not sought to create true predictive models using texture data .
Get Radiology Tree app to read full this article<
Materials and methods
Patient Selection
Get Radiology Tree app to read full this article<
Get Radiology Tree app to read full this article<
Get Radiology Tree app to read full this article<
Get Radiology Tree app to read full this article<
Get Radiology Tree app to read full this article<
Table 1
Demographic and Patient Information for the 70 Patients (80 Lesions) Used in the Construction of the Random Forest Models and the 18 Patients (19 Lesions) Used for External Validation of the Models
Oncocytoma Clear Cell Papillary Simple Cyst Random Forest Modeled Subset Number of Patients 20 20 18 12 Average Age (y) 66 65 64 65 Female (%) 25% 50% 28% 42% Total Number of Lesions 20 20 20 20 Total Number of Slices 154 160 158 150 Average Number of Slices/Lesion 7.7 8.0 7.9 7.5 Validation Subset Number of Patients 4 4 5 5 Average Age (y) 66 47 65 60 Female (%) 25% 25% 0% 40% Total Number of Lesions 4 5 5 5 Total Number of Slices 21 31 36 25 Average Number of Slices/Lesion 5.3 6.2 7.2 5.0
Get Radiology Tree app to read full this article<
CT Technique
Get Radiology Tree app to read full this article<
Get Radiology Tree app to read full this article<
CT Texture Analysis
Get Radiology Tree app to read full this article<
Get Radiology Tree app to read full this article<
Get Radiology Tree app to read full this article<
Get Radiology Tree app to read full this article<
Get Radiology Tree app to read full this article<
Statistics
Get Radiology Tree app to read full this article<
Get Radiology Tree app to read full this article<
Get Radiology Tree app to read full this article<
Get Radiology Tree app to read full this article<
Get Radiology Tree app to read full this article<
Power Analysis
Get Radiology Tree app to read full this article<
Results
Random Forest Model
Get Radiology Tree app to read full this article<
Table 2
Confusion Matrices for Random Forest Models (Based on the Out-of-Bag Data) Using all Three Contrast Phases in Conjunction and Models Using Only the Arterial, Venous, or Delayed Phases Alone
Lesion Type Oncocytoma Clear Cell RCC Papillary RCC Simple Cyst Sensitivity (%) Specificity (%) Total Class Error (%) 3-Phase Oncocytoma 137 16 1 0 89 99 11.0 Clear Cell RCC 7 146 7 0 91 97 8.8 Papillary RCC 0 0 158 0 100 98 0.0 Simple Cyst 0 0 0 150 100 100 0.0 Arterial Oncocytoma 136 15 3 0 88 98 11.7 Clear Cell RCC 10 145 5 0 91 97 9.4 Papillary RCC 1 0 156 1 99 98 1.3 Simple Cyst 0 0 1 149 99 100 0.7 Venous Oncocytoma 142 12 0 0 92 97 7.8 Clear Cell RCC 16 136 7 1 85 97 15.0 Papillary RCC 0 3 153 2 97 98 3.2 Simple Cyst 0 0 1 149 99 99 0.7 Delayed Oncocytoma 125 23 5 1 81 94 18.8 Clear Cell RCC 24 132 4 0 83 94 17.5 Papillary RCC 2 4 151 1 96 98 4.4 Simple Cyst 0 0 1 149 99 100 0.7
RCC, renal cell carcinoma.
The results are presented on a per-slice basis. The “true” pathologic diagnosis is represented by the heading for each row, whereas the classification provided by the model is represented by the heading for each column.
Get Radiology Tree app to read full this article<
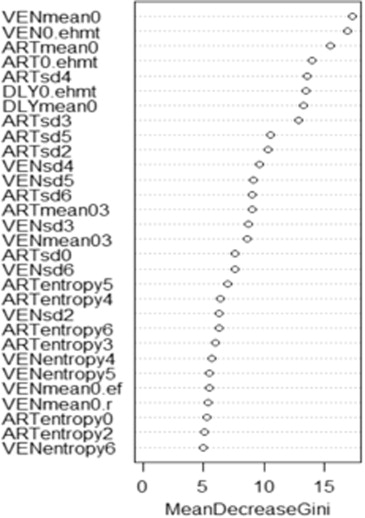
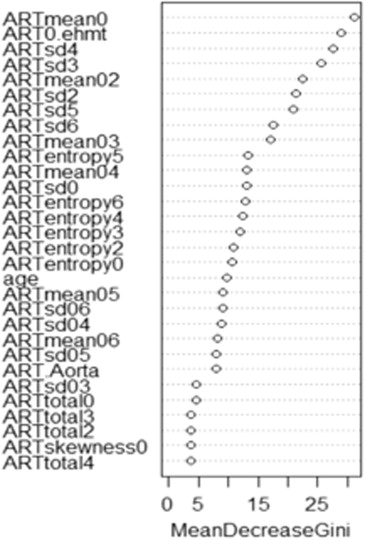
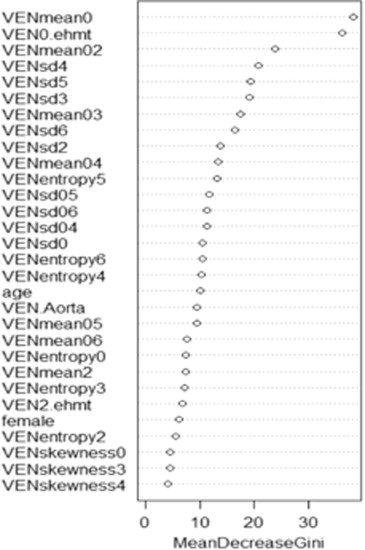
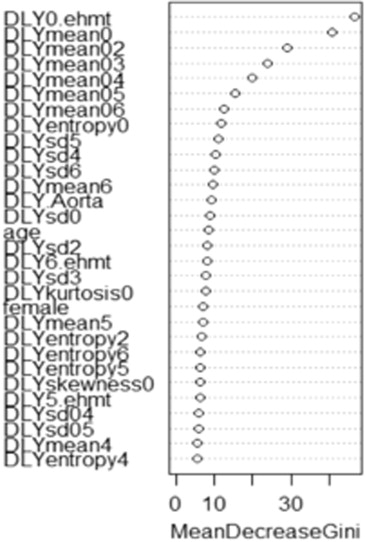
Variable Importance Plots
Get Radiology Tree app to read full this article<
Get Radiology Tree app to read full this article<
Performance of Model Using Validation Data Set
Get Radiology Tree app to read full this article<
Table 3
Confusion Matrices Detailing the Accuracy of the Random Forest Models when Analyzing the 19 Validation Cases
Oncocytoma Clear Cell RCC Papillary RCC Simple Cyst Sensitivity (%) Specificity (%) Total Class Error (%) 3-Phase Oncocytoma 18 3 0 0 85.7 97.8 14.3 Clear Cell RCC 2 29 0 0 93.5 96.3 6.5 Papillary RCC 0 0 36 0 100 100 0.0 Simple Cyst 0 0 0 25 100 100 0.0 Arterial Oncocytoma 17 4 0 0 81.0 97.8 19.0 Clear Cell RCC 2 29 0 0 93.5 95.1 6.5 Papillary RCC 0 0 36 0 100 100 0.0 Simple Cyst 0 0 0 25 100 100 0.0 Venous Oncocytoma 19 2 0 0 90.5 73.9 9.5 Clear Cell RCC 24 7 0 0 22.6 97.6 77.4 Papillary RCC 0 0 36 0 100 97.4 0.0 Simple Cyst 0 0 2 23 92.0 100 8.0 Delayed Oncocytoma 18 3 0 0 85.7 83.7 14.3 Clear Cell RCC 11 15 5 0 48.4 93.9 51.6 Papillary RCC 4 2 30 0 83.3 93.5 16.7 Simple Cyst 0 0 0 25 100 100 0.0
RCC, renal cell carcinoma.
The results are presented on a per-slice basis. The true pathologic diagnosis is represented by the heading for each row, whereas the classification provided by the model is represented by the heading for each column.
Get Radiology Tree app to read full this article<
Get Radiology Tree app to read full this article<
Discussion
Get Radiology Tree app to read full this article<
Get Radiology Tree app to read full this article<
Get Radiology Tree app to read full this article<
Get Radiology Tree app to read full this article<
Get Radiology Tree app to read full this article<
Get Radiology Tree app to read full this article<
Conclusions
Get Radiology Tree app to read full this article<
Acknowledgements
Get Radiology Tree app to read full this article<
Get Radiology Tree app to read full this article<
Get Radiology Tree app to read full this article<
References
1. Sheir K.Z., El-Azab M., Mosbah A., et. al.: Differentiation of renal cell carcinoma subtypes by multislice computerized tomography. J Urol 2005; 174: pp. 451-455.
2. Kim J.H., Bae J.H., Lee K.W., et. al.: Predicting the histology of small renal masses using preoperative dynamic contrast-enhanced magnetic resonance imaging. Urology 2012; 80: pp. 872-876.
3. Jung S.C., Cho J.Y., Kim S.H.: Subtype differentiation of small renal cell carcinomas on three-phase MDCT: usefulness of the measurement of degree and heterogeneity of enhancement. Acta Radiol 2012; 53: pp. 112-118.
4. Zhang J., Lefkowitz R., Ishill N., et. al.: Solid renal cortical tumors: differentiation with CT. Radiology 2007; 244: pp. 494-504.
5. Choi S.K., Jeon S.H., Chang S.G.: Characterization of small renal masses less than 4 cm with quadriphasic multidetector helical computed tomography: differentiation of benign and malignant lesions. Korean J Urol 2012; 53: pp. 159-164.
6. Jinzaki M., Tanimoto A., Mukai M., et. al.: Double-phase helical CT of small renal parenchymal neoplasms: correlation with pathologic findings and tumor angiogenesis. J Comput Assist Tomogr 2000; 24: pp. 835-842.
7. Young J.R., Margolis D., Sauk S., et. al.: Clear cell renal cell carcinoma: discrimination from other renal cell carcinoma subtypes and oncocytoma at multiphasic multidetector CT. Radiology 2013; 267: pp. 444-453.
8. Herts B., Coll D., Novick A., et. al.: Enhancement characteristics of papillary renal neoplasms revealed on triphasic helical CT of the kidneys. AJR Am J Roentgenol 2002; 178: pp. 367-372.
9. Bird V.G., Kanagarajah P., Morillo G., et. al.: Differentiation of oncocytoma and renal cell carcinoma in small renal masses (<4 cm): the role of 4-phase computerized tomography. World J Urol 2011; 29: pp. 787-792.
10. Raman S.P., Johnson P.T., Allaf M.E., et. al.: Chromophobe renal cell carcinoma: multiphase MDCT enhancement patterns and morphologic features. AJR Am J Roentgenol 2013; 201: pp. 1268-1276.
11. Al-Kadi O.S., Watson D.: Texture analysis of aggressive and nonaggressive lung tumor CE CT images. IEEE Trans Biomed Eng 2008; 55: pp. 1822-1830.
12. Davnall F., Yip C.S., Ljungqvist G., et. al.: Assessment of tumor heterogeneity: an emerging imaging tool for clinical practice?. Insights Imaging 2012; 3: pp. 573-589.
13. Ganeshan B., Abaleke S., Young R.C., et. al.: Texture analysis of non-small cell lung cancer on unenhanced computed tomography: initial evidence for a relationship with tumour glucose metabolism and stage. Cancer Imaging 2010; 10: pp. 137-143.
14. Ganeshan B., Miles K.A., Young R.C., et. al.: In search of biologic correlates for liver texture on portal-phase CT. Acad Radiol 2007; 14: pp. 1058-1068.
15. Ganeshan B., Miles K.A., Young R.C., et. al.: Hepatic enhancement in colorectal cancer: texture analysis correlates with hepatic hemodynamics and patient survival. Acad Radiol 2007; 14: pp. 1520-1530.
16. Ganeshan B., Miles K.A., Young R.C., et. al.: Texture analysis in non-contrast enhanced CT: impact of malignancy on texture in apparently disease-free areas of the liver. Eur J Radiol 2009; 70: pp. 101-110.
17. Ganeshan B., Miles K.A., Young R.C., et. al.: Three-dimensional textural analysis of brain images reveals distributed grey-matter abnormalities in schizophrenia. Eur Radiol 2010; 20: pp. 941-948.
18. Ganeshan B., Panayiotou E., Burnand K., et. al.: Tumour heterogeneity in non-small cell lung carcinoma assessed by CT texture analysis: a potential marker of survival. Eur Radiol 2012; 22: pp. 796-802.
19. Ganeshan B., Skogen K., Pressney I., et. al.: Tumour heterogeneity in oesophageal cancer assessed by CT texture analysis: preliminary evidence of an association with tumour metabolism, stage, and survival. Clin Radiol 2012; 67: pp. 157-164.
20. Ganeshan B., Strukowska O., Skogen K., et. al.: Heterogeneity of focal breast lesions and surrounding tissue assessed by mammographic texture analysis: preliminary evidence of an association with tumor invasion and estrogen receptor status. Front Oncol 2011; 1: pp. 33.
21. Goh V., Ganeshan B., Nathan P., et. al.: Assessment of response to tyrosine kinase inhibitors in metastatic renal cell cancer: CT texture as a predictive biomarker. Radiology 2011; 261: pp. 165-171.
22. Miles K.A., Ganeshan B., Griffiths M.R., et. al.: Colorectal cancer: texture analysis of portal phase hepatic CT images as a potential marker of survival. Radiology 2009; 250: pp. 444-452.
23. Ng F., Ganeshan B., Kozarski R., et. al.: Assessment of primary colorectal cancer heterogeneity by using whole-tumor texture analysis: contrast-enhanced CT texture as a biomarker of 5-year survival. Radiology 2013; 266: pp. 177-184.
24. Radulescu E., Ganeshan B., Minati L., et. al.: Gray matter textural heterogeneity as a potential in-vivo biomarker of fine structural abnormalities in Asperger syndrome. Pharmacogenomics J 2013; 13: pp. 70-79.
25. Ravanelli M., Farina D., Morassi M., et. al.: Texture analysis of advanced non-small cell lung cancer (NSCLC) on contrast-enhanced computed tomography: prediction of the response to the first-line chemotherapy. Eur Radiol 2013; 23: pp. 3450-3455.
26. Skogen K., Ganeshan B., Good C., et. al.: Measurements of heterogeneity in gliomas on computed tomography relationship to tumour grade. J Neurooncol 2013; 111: pp. 213-219.
27. Huang Y.L., Chen J.H., Shen W.C.: Diagnosis of hepatic tumors with texture analysis in nonenhanced computed tomography images. Acad Radiol 2006; 13: pp. 713-720.
28. Kido S., Kuriyama K., Higashiyama M., et. al.: Fractal analysis of small peripheral pulmonary nodules in thin-section CT: evaluation of the lung-nodule interfaces. J Comput Assist Tomogr 2002; 26: pp. 573-578.
29. Ba-Ssalamah A., Muin D., Schernthaner R., et. al.: Texture-based classification of different gastric tumors at contrast-enhanced CT. Eur J Radiol 2013; 82: pp. e537-e543.
30. Raman S, Schroeder J, Huang P, et al. Classification of hypervascular liver lesions using CT texture analysis: generation of a predictive model. J Comput Assist Tomogr, in press.
31. Breiman L.: Random forests. Machine Learning 2001; 45: pp. 5-32.
32. Ganeshan B., Burnand K., Young R., et. al.: Dynamic contrast-enhanced texture analysis of the liver: initial assessment in colorectal cancer. Invest Radiol 2011; 46: pp. 160-168.
33. Ho T.K.: The random subspace method for constructing decision forests. IEEE Trans Pattern Anal Mach Intell 1998; 20: pp. 832-844.
34. Kleinberg E.: An overtraining-resistant stochastic modeling method for pattern recognition. Ann Statist 1996; 24: pp. 2319-2349.
35. Kang S.K., Chandarana H.: Contemporary imaging of the renal mass. Urol Clin North Am 2012; 39: pp. 161-170. vi
36. Kim J., Kim T., Ahn H., et. al.: Differentiation of subtypes of renal cell carcinoma on helical CT scans. AJR Am J Roentgenol 2002; 178: pp. 1499-1506.
37. Sauk S.C., Hsu M.S., Margolis D.J., et. al.: Clear cell renal cell carcinoma: multiphasic multidetector CT imaging features help predict genetic karyotypes. Radiology 2011; 261: pp. 854-862.
38. Shebel H., Elsayes K., Sheir K.Z., et. al.: Quantitative enhancement washout analysis of solid cortical renal masses using multidetector computed tomography. J Comput Assist Tomogr 2011; 35: pp. 337-342.
39. Takagi T., Kondo T., Tanabe K.: Impact of the tumor enhancement pattern in computed tomography for the differential diagnosis of renal cell carcinoma and benign renal tumor. Int J Urol 2011; 18: pp. 866-867.
40. Zhang C., Li X., Hao H., et. al.: The correlation between size of renal cell carcinoma and its histopathological characteristics: a single center study of 1867 renal cell carcinoma cases. BJU Int 2012; 110: pp. E481-E485.
41. Amit Y., Geman D.: Shape quantization and recognition with randomized trees. Neural Comput 1997; 9: pp. 1545-1588.