
Rationale and Objectives
Determine inter- and intraobserver variability of computed tomography (CT) tumor volume measurements in advanced non-small-cell lung cancer (NSCLC) patients treated in a Phase II clinical trial using chest CT.
Materials and Methods
Twenty-three advanced NSCLC patients with a total of 53 measurable lung lesions enrolled in a Phase II, multicenter, open-label clinical trial of erlotinib were retrospectively studied with institutional review board approval. Two radiologists independently measured the tumor size, volume, and CT attenuation coefficient using commercially available volume analysis software. Concordance correlation coefficients (CCCs) and Bland-Altman plots were used to assess inter- and intraobserver agreement.
Results
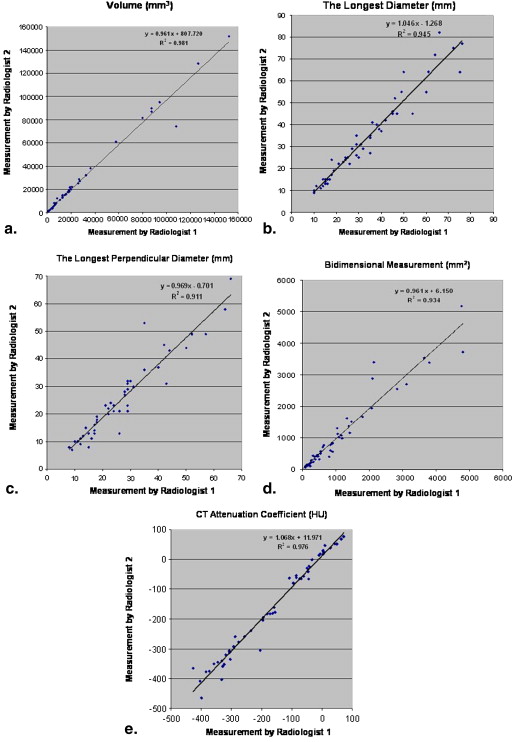
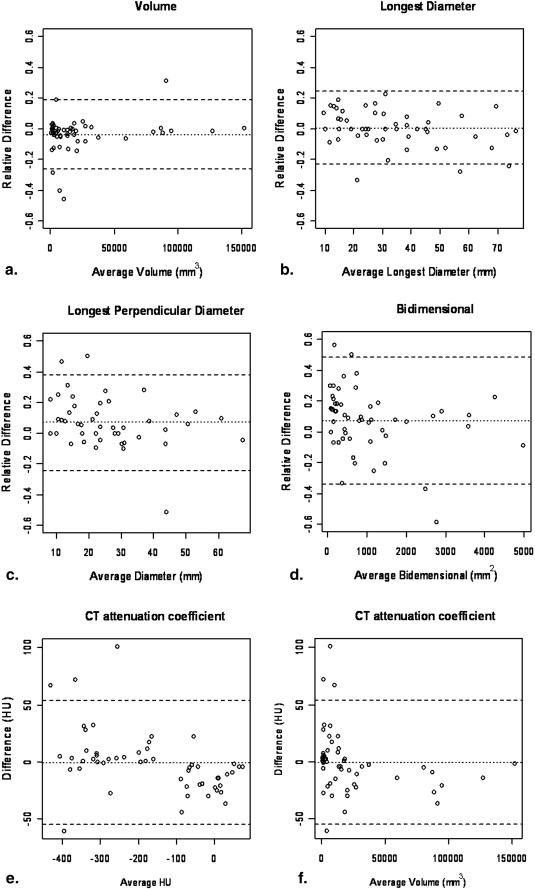
High CCCs (0.949–0.990) were observed in all types of measurements for interobserver agreement. The 95% limits of agreements for volume, unidimensional, and bidimensional measurements were (−26.0%, 18.6%), (−23.1%, 24.4%), and (−34.0%, 48.6%), respectively. Volume measurement had slightly higher CCC and narrower 95% limits of agreement compared to uni- and bidimensional measurements. CCCs for intraobserver agreement were high (range, 0.946–0.996) with CCC for volume being slightly higher than CCCs of uni- and bidimensional measurements. The smaller the tumor volume was, the larger the interobserver difference of CT attenuation. Location, morphology, or adjacent atelectasis had no significant impact on inter- or intraobserver variability.
Conclusion
CT tumor volume measurement in advanced NSCLC patients using clinical chest CT and commercially available software demonstrated high inter- and intraobserver agreement, indicating that the method may be used routinely in clinical practice.
Lung cancer is a leading cause of death from cancer in the United States as well as worldwide, resulting in more than 160,000 deaths per year in the United States . Non-small-cell lung cancer (NSCLC), accounting for approximately 85% of lung cancer cases, has a 5-year survival rate of only 15%. Given the increasing availability of newer targeted therapeutic options against NSCLC, such as the epidermal growth factor receptor (EGFR) tyrosine kinase inhibitors, gefitinib and erlotinib, accurate assessment of response to a given therapy is of utmost importance . In addition, accurate tumor assessment to document time to progression has become a critical determinant because it is used as a primary end point in lung cancer clinical trials using targeted agents.
Two widely accepted and conventional guidelines for objective response assessment to therapy in patients with solid tumors include the World Health Organization (WHO) guideline that uses bidimensional tumor measurements and the Response Evaluation Criteria in Solid Tumors (RECIST) that uses unidimensional measurements of the longest diameter of the tumor . Recent advancement of computed tomography (CT) and multidetector-row CT (MDCT) imaging technology has enabled volumetric measurements of tumors . To use the tumor volume measurement as a method of response assessment to therapy, it is necessary to determine the reproducibility of this volume measurement. However, only a few reports have been published regarding the reproducibility of CT volume measurement of lung lesions in advanced NSCLC patients participating in prospective clinical trials . To answer questions of CT measurement reproducibility and repeatability, Zhao et al evaluated the variability in tumor measurements from same-day repeat CT scans using thin-section CT images in 32 NSCLC patients . In their study, the patients were recruited to a specific imaging trial, and their own semiautomated three-dimensional algorithm was used for determining tumor volume measurements . To widely apply CT volume measurements in response assessment of NSCLC in clinical practice, it is important to assess reproducibility of the measurements in NSCLC patients who were actually treated in a prospective clinical trial of therapeutic agents. CT volume measurement is gradually becoming a clinically available tool for assessing tumor burden. However, radiologists should accurately assess the performance characteristics of these volumetric tools including inter- and intraobserver reproducibility.
Get Radiology Tree app to read full this article<
Materials and methods
Patients
Get Radiology Tree app to read full this article<
Get Radiology Tree app to read full this article<
CT Examinations
Get Radiology Tree app to read full this article<
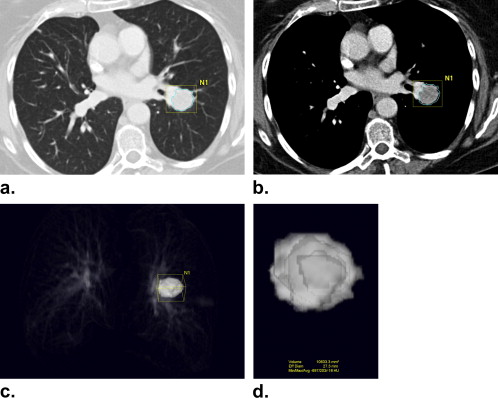
Tumor Size and Volume Measurement
Get Radiology Tree app to read full this article<
Get Radiology Tree app to read full this article<
Get Radiology Tree app to read full this article<
Get Radiology Tree app to read full this article<
Get Radiology Tree app to read full this article<
Statistical Analysis
Get Radiology Tree app to read full this article<
Get Radiology Tree app to read full this article<
Get Radiology Tree app to read full this article<
Results
Interobserver Agreement
Get Radiology Tree app to read full this article<
Table 1
Interobserver Agreement Between Two Radiologists for Volume, Uni- and Bidimensional, and CT Attenuation Coefficient Measurements
Types of Measurement Concordance Correlation Coefficient ∗ Mean Relative Difference (%) 95% limits of Agreement (%) Percentage of Observations Inside the Limits (%) Standard Deviation ‡ Volume 0.990 (0.983–0.994) −3.7 −26.0, 18.6 90.5 0.112 (0.058) Longest diameter 0.969 (0.949–0.982) 0.6 −23.1, 24.4 94.3 0.119 (0.098) Longest perpendicular diameter 0.949 (0.914–0.970) 7.1 −23.9, 38.0 94.3 0.155 (0.105) Bidimensional 0.966 (0.942–0.980) 7.3 −34.0, 48.6 92.4 0.207 (0.156) CT attenuation coefficient 0.985 (0.975–0.991) −0.7 −55.1, 53.7 † 92.4 27.2 † (18.9)
CCC: concordance correlation coefficients; CT: computed tomography.
Get Radiology Tree app to read full this article<
Get Radiology Tree app to read full this article<
Get Radiology Tree app to read full this article<
Get Radiology Tree app to read full this article<
Get Radiology Tree app to read full this article<
Get Radiology Tree app to read full this article<
Intraobserver Agreement
Get Radiology Tree app to read full this article<
Table 2
Intraobserver Agreement for Volume, Uni- and Bidimensional, and CT Attenuation Coefficient Measurements
Types of Measurement Average Concordance Correlation Coefficient ∗ Average Mean Relative Difference (%) ∗ Average Standard Deviation ∗ Average Trimmed Standard Deviation ∗ Average Percentage of Observations Inside the Limits (%) ∗ Volume 0.992 (0.985–0.996) −5.4 (−9.3, −0.2) 0.148 (0.104–0.220) 0.008 (0.064–0.113) 95.0 (90.5, 98.1) Longest diameter 0.977 (0.971–0.984) −3.2 (−6.0, −0.7) 0.110 (0.098–0.117) 0.086 (0.071–0.095) 94.7 (90.5, 98.1) Longest perpendicular diameter 0.959 (0.946–0.971) −1.7 (−5.2, 21.3) 0.160 (0.138–0.197) 0.117 (0.100–0.130) 94.3 (90.5, 96.2) Bidimensional 0.975 (0.959–0.989) −5.1 (−8.4, 0.3) 0.210 (0.186–0.234) 0.165 (0.141–0.187) 94.7 (92.4, 98.1) CT attenuation coefficient 0.984 (0.974–0.996) 6.6 † (−3.1, 13.7) 26.2 † (12.6–33.4) 16.4 † (10.1–21.6) 94.5 (90.5, 96.2)
Get Radiology Tree app to read full this article<
Get Radiology Tree app to read full this article<
Get Radiology Tree app to read full this article<
Impact of Lesion Characteristics on CT Measurement Variability
Get Radiology Tree app to read full this article<
Table 3
The Summary of the Lesion Characteristics
Lesion Characteristics Number of Lesions Location Intraparenchymal 25 Pleura/fissure 18 Juxtavascular 10 Morphology Smooth 7 Lobulated 14 Irregular 32 Adjacent atelectasis Present 17 Absent 36
Get Radiology Tree app to read full this article<
Discussion
Get Radiology Tree app to read full this article<
Get Radiology Tree app to read full this article<
Get Radiology Tree app to read full this article<
Get Radiology Tree app to read full this article<
Get Radiology Tree app to read full this article<
Get Radiology Tree app to read full this article<
Get Radiology Tree app to read full this article<
Get Radiology Tree app to read full this article<
References
1. Jemal A., Siegel R., Ward E., et. al.: Cancer statistics, 2009. CA Cancer J Clin 2009; 59: pp. 225-249.
2. Lynch T.J., Bell D.W., Sordella R., et. al.: Activating mutations in the epidermal growth factor receptor underlying responsiveness of non-small-cell lung cancer to gefitinib. N Engl J Med 2004; 350: pp. 2129-2139.
3. Paez J.G., Janne P.A., Lee J.C., et. al.: EGFR mutations in lung cancer: correlation with clinical response to gefitinib therapy. Science 2004; 304: pp. 1497-1500.
4. Pao W., Miller V., Zakowski M., et. al.: EGF receptor gene mutations are common in lung cancers from “never smokers” and are associated with sensitivity of tumors to gefitinib and erlotinib. Proc Natl Acad Sci USA 2004; 101: pp. 13306-13311.
5. Therasse P., Arbuck S.G., Eisenhauer E.A., et. al.: New guidelines to evaluate the response to treatment in solid tumors: European Organization for Research and Treatment of Cancer, National Cancer Institute of the United States, National Cancer Institute of Canada. J Natl Cancer Inst 2000; 92: pp. 205-216.
6. Zhao B., Schwartz L.H., Moskowitz C.S., et. al.: Pulmonary metastases: effect of CT section thickness on measurement–initial experience. Radiology 2005; 234: pp. 934-939.
7. Zhao B., Schwartz L.H., Moskowitz C.S., et. al.: Lung cancer: computerized quantification of tumor response–initial results. Radiology 2006; 241: pp. 892-898.
8. Gavrielides M.A., Kinnard L.M., Myers K.J., et. al.: Noncalcified lung nodules: volumetric assessment with thoracic CT. Radiology 2009; 251: pp. 26-37.
9. Zhao B., James L.P., Moskowitz C.S., et. al.: Evaluating variability in tumor measurements from same-day repeat CT scans of patients with non-small cell lung cancer. Radiology 2009; 252: pp. 263-272.
10. Jackman D.M., Yeap B.Y., Lindeman N.I., et. al.: Phase II clinical trial of chemotherapy-naive patients > or = 70 years of age treated with erlotinib for advanced non-small-cell lung cancer. J Clin Oncol 2007; 25: pp. 760-766.
11. Wang Y., van Klaveren R.J., van der Zaag-Loonen H.J., et. al.: Effect of nodule characteristics on variability of semiautomated volume measurements in pulmonary nodules detected in a lung cancer screening program. Radiology 2008; 248: pp. 625-631.
12. Lin L.I.: A concordance correlation coefficient to evaluate reproducibility. Biometrics 1989; 45: pp. 255-268.
13. Bland J.M., Altman D.G.: Statistical methods for assessing agreement between two methods of clinical measurement. Lancet 1986; 1: pp. 307-310.
14. Yankelevitz D.F., Reeves A.P., Kostis W.J., et. al.: Small pulmonary nodules: volumetrically determined growth rates based on CT evaluation. Radiology 2000; 217: pp. 251-256.
15. Kostis W.J., Yankelevitz D.F., Reeves A.P., et. al.: Small pulmonary nodules: reproducibility of three-dimensional volumetric measurement and estimation of time to follow-up CT. Radiology 2004; 231: pp. 446-452.
16. Gietema H.A., Wang Y., Xu D., et. al.: Pulmonary nodules detected at lung cancer screening: interobserver variability of semiautomated volume measurements. Radiology 2006; 241: pp. 251-257.
17. Petrou M., Quint L.E., Nan B., et. al.: Pulmonary nodule volumetric measurement variability as a function of CT slice thickness and nodule morphology. AJR Am J Roentgenol 2007; 188: pp. 306-312.
18. Marchianò A., Calabrò E., Civelli E., et. al.: Pulmonary nodules: volume repeatability at multidetector CT lung cancer screening. Radiology 2009; 251: pp. 919-925.
19. Choi H., Charnsangavej C., Faria S.C., et. al.: CT Evaluation of the response of gastrointestinal stromal tumors after imatinib mesylate treatment: a quantitative analysis correlated with FDG-PET findings. AJR Am J Roentgenol 2004; 183: pp. 1619-1628.