
Rationale and Objectives
To define a statistically based variation of individual whole-lung densitometry above which a real increase of pulmonary extent can be suspected in lung cancer screening trials.
Materials and Methods
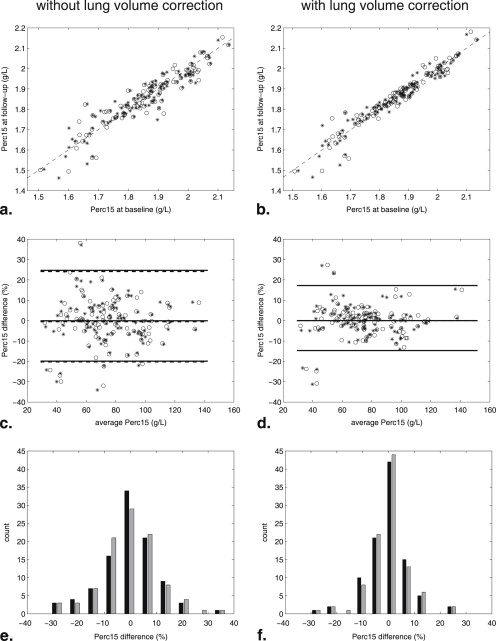
Baseline and 3-month follow-up low-dose computed tomography (LDCT) examinations of 131 smokers or former smokers recruited in the ITALUNG (32 subjects) and MILD (99 subjects) trials were compared using for each data set two different image processing tools for whole-lung densitometry. Both trials were approved by institutional review boards, and written informed consent was obtained from all participants. Assuming that no change of emphysema extent can occur in a 3-month interval, the Bland and Altman method was used to assess the agreement between baseline and follow-up LDCT examinations for lung volume, 15th percentile (Perc15) of lung density and Perc15 corrected for lung volume by application of a linear detrend on log-transformed data.
Results
Similar results were obtained in each data set using two different image processing tools. In the ITALUNG cohort the 95% limits of agreement (LoA) interval of volume corrected Perc15 was −9.7 to 10.7% using image processing method 1 and −10.3 to 11.5% using image processing method 2. In the MILD cohort, the 95% LoA interval of volume corrected Perc15 was −14.7 to 17.3% with both image processing methods.
Conclusion
In the two considered lung cancer screening settings a range of 9.7–14.7% decrease of volume corrected Perc15 represents a statistically defined threshold to suspect a real increase of emphysema extent in serial LDCT examinations.
Computed tomography (CT) densitometric indexes are more sensitive and specific than pulmonary function tests in detecting subtle progression of pulmonary emphysema . This is particularly important in view of the several emerging therapeutics options aimed to halt progression of emphysema, such as new drugs, lung volume reduction surgery, and bronchoscopically implanted valves .
Lung cancer screening trials with low-dose CT (LDCT) provide large cohorts for studying the natural course of smoking-related emphysema. LDCT as it is implemented in lung cancer screening trials has been proved to be effective for quantifying emphysema extent . However, despite standardization of LDCT acquisition protocols for lung cancer screening, the assessment of the emphysema progression over time remains challenging because lung density measurements are influenced by changes in the levels of inspiration between repeated CT examinations . Therefore, it is recommended that all longitudinal studies apply a lung volume correction procedure for assessing the evolution of emphysema .
Get Radiology Tree app to read full this article<
Get Radiology Tree app to read full this article<
Materials and methods
Study Population
Get Radiology Tree app to read full this article<
Get Radiology Tree app to read full this article<
Get Radiology Tree app to read full this article<
LDCT Protocols
Get Radiology Tree app to read full this article<
Densitometric Measurements
Image processing method 1
Get Radiology Tree app to read full this article<
Get Radiology Tree app to read full this article<
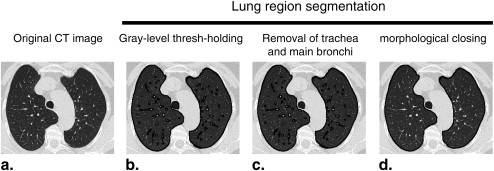
Get Radiology Tree app to read full this article<
Image processing method 2
Get Radiology Tree app to read full this article<
ITALUNG Trial
Get Radiology Tree app to read full this article<
Get Radiology Tree app to read full this article<
MILD Trial
Get Radiology Tree app to read full this article<
Get Radiology Tree app to read full this article<
Data Analysis and Lung Volume Correction Technique
Get Radiology Tree app to read full this article<
Get Radiology Tree app to read full this article<
Get Radiology Tree app to read full this article<
Get Radiology Tree app to read full this article<
CorrectedPerc15g/LFU=10(LPerc15g/LFU-[a(LVFU-LVBA)+b]). Corrected
Perc
15
g
/
L
FU
=
10
(
LPerc
15
g
/
L
FU
-
[
a
(
LV
FU
-
LV
BA
)
+
b
]
)
.
Lung volume, RA950, Perc15, and volume corrected Perc15 measurements of baseline and follow-up LDCT examinations were compared with a paired t -test with 0.05 significance level.
Get Radiology Tree app to read full this article<
Get Radiology Tree app to read full this article<
Get Radiology Tree app to read full this article<
Get Radiology Tree app to read full this article<
Results
Get Radiology Tree app to read full this article<
ITALUNG Trial
Get Radiology Tree app to read full this article<
Table 1
Descriptive Statistics (Mean and SD) for Total Lung Volumes, RA950, Perc15, and Volume-corrected Perc15 Measurements in the ITALUNG and MILD Cohorts
ITALUNG trial MILD trial Baseline Follow-up Baseline Follow-up Method 1 Method 2 Method 1 Method 2 Method 1 Method 2 Method 1 Method 2 Lung volume (L) 5.41 (1.36) 5.48 (1.38) 5.45 (1.31) 5.52 (1.32) 6.26 (1.24) 6.29 (1.22) 6.24 (1.19) 6.27 (1.18) RA950 (HU) 5.7 (8.7) 6.5 (8.5) 6.0 (9.1) 6.8 (8.8) 6.2 (6.5) 6.6 (6.7) 6.2 (6.7) 6.5 (6.8) Perc15g/L (g/L) 80.8 (26.1) 77.0 (24.4) 80.4 (25.9) 76.7 (24.7) 75.9 (22.1) 74.8 (22.3) 75.4 (21.5) 74.7 (21.8) Perc15g/L corrected for lung volume (g/L) 80.8 (26.1) 77.0 (24.4) 80.8 (26.8) 77.3 (25.7) 75.9 (22.1) 74.8 (22.3) 76.0 (22.5) 74.8 (22.2)
HU, Hounsfield unit; Perc15, 15th percentile; method 1, image processing method designed in our laboratory; method 2, Fraunhofer MeVis Research, Bremen, Germany; RA950, relative area at −950 HU.
Lung volumes, RA950, Perc15, and volume-corrected Perc15 averages were statistically unchanged between baseline and 3-month follow-up examination for both image processing methods ( P > .05 at a paired t -test).
Data are reported as mean (standard deviation).
Get Radiology Tree app to read full this article<
Get Radiology Tree app to read full this article<
Table 2
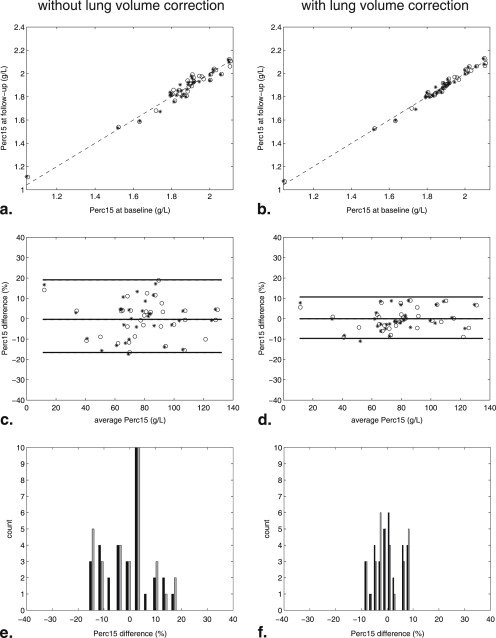
Results of Bland and Altman Analysis on Lung Volumes and Perc15 Measurements Without and With Lung Volumes Correction
Without Lung Volume Correction With Lung Volume Correction Mean Difference 95% Limits of Agreement Half-width of 95% LoA Interval Mean Difference 95% Limits of Agreement Half-width of 95% LoA Interval ITALUNG trial Method 1 Lung volume (%) 0.9% −15.7 to 20.8% 18.2% NA NA NA Perc15 (%) −0.4% −16.6 to 19.1% 17.8% 0.0% −9.7 to 10.7% 10.2% Method 2 Lung volume (%) 0.9% −15.6 to 20.5% 18.1% NA NA NA Perc15 (%) −0.3% −17.3 to 20.3% 18.8% 0.0% −10.3 to 11.5% 10.9% MILD trial Method 1 Lung volume (%) −0.0% −11.3 to 12.6% 12.0% NA NA NA Perc15 (%) −0.5% −20.3 to 24.1% 22.2% 0.0% −14.7 to 17.3% 16.0% Method 2 Lung volume (%) −0.2% −11.3 to 12.3% 11.8% NA NA NA Perc15 (%) −0.1% −20.1 to 25.0% 22.5% 0.0% −14.7 to 17.3% 16.0%
HU, Hounsfield unit; LoA, limits of agreement; method 1, image processing method designed in our laboratory; method 2, Fraunhofer MeVis Research, Bremen, Germany; NA, not applicable; Perc15, 15th percentile; RA950, relative area at −950 HU.
All Kendall τ tests applied to difference and average measurements of log-transformed data were not significant ( P > .05).
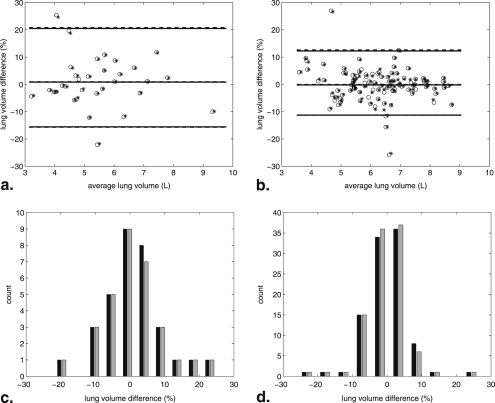
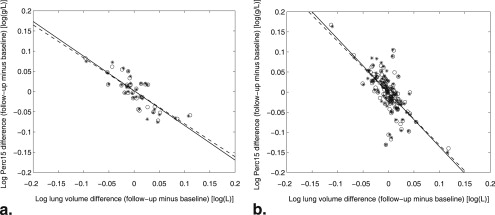
Table 3
Linear Regression Coefficients ( a and b ) Between Log-transformed Lung Volume Difference and Perc15 Difference for Both Trials and Image Processing Methods (Linear Regression Equation y = a x + b ) along with Pearson r Correlation Coefficients (All Significant, P < .001)
a b r ITALUNG trial Method 1 −0.82 0.002 −0.82 Method 2 −0.86 0.002 −0.81 MILD trial Method 1 −1.29 −0.002 −0.69 Method 2 −1.34 −0.001 −0.70
Method 1, image processing method designed in our laboratory; method 2, Fraunhofer MeVis Research, Bremen, Germany; Perc15, 15th percentile.
Get Radiology Tree app to read full this article<
MILD Trial
Get Radiology Tree app to read full this article<
Get Radiology Tree app to read full this article<
Get Radiology Tree app to read full this article<
Get Radiology Tree app to read full this article<
Comparison of Regression Coefficients
Get Radiology Tree app to read full this article<
Discussion
Get Radiology Tree app to read full this article<
Get Radiology Tree app to read full this article<
Get Radiology Tree app to read full this article<
Get Radiology Tree app to read full this article<
Get Radiology Tree app to read full this article<
Get Radiology Tree app to read full this article<
Get Radiology Tree app to read full this article<
Get Radiology Tree app to read full this article<
Get Radiology Tree app to read full this article<
Get Radiology Tree app to read full this article<
Get Radiology Tree app to read full this article<
References
1. Soejima K., Yamaguchi K., Kohda E., et. al.: Longitudinal followup study of smoking-induced lung density changes by high-resolution computed tomography. Am J Respir Crit Care Med 2000; 161: pp. 1264-1273.
2. Shaker S.B., Dirksen A., Laursen L.C., et. al.: Short-term reproducibility of computed tomography-based lung density measurements in alpha-1 antitrypsin deficiency and smokers with emphysema. Acta Radiol 2004; 45: pp. 424-430.
3. Park K.J., Bergin C.J., Clausen J.L.: Quantitation of emphysema with three-dimensional CT densitometry: comparison with two-dimensional analysis, visual emphysema scores, and pulmonary function test results. Radiology 1999; 211: pp. 541-547.
4. Sanders C., Nath P.H., Bailey W.C.: Detection of emphysema with computed tomography. Correlation with pulmonary function tests and chest radiography. Invest Radiol 1988; 23: pp. 262-266.
5. Abusriwil H., Stockley R.A.: Alpha-1-antitrypsin replacement therapy: current status. Curr Opin Pulm Med 2006; 12: pp. 125-131.
6. Stoller J.K., Aboussouan L.S.: Alpha1-antitrypsin deficiency. Lancet 2005; 365: pp. 2225-2236.
7. Gierada D.S., Pilgram T.K., Whiting B.R., et. al.: Comparison of standard- and low-radiation-dose CT for quantification of emphysema. AJR Am J Roengenol 2007; 188: pp. 42-47.
8. Sverzellati N., Calabrò E., Kuhnigk J.M., et. al.: Letter to the editor re: Evolution of emphysema in relation to smoking. Eur Radiol 2010; 20: pp. 1621-1622.
9. Newell J.D., Hogg J.C., Snider G.: Report of a workshop: quantitative computed tomography scanning in longitudinal studies of emphysema. Eur Respir J 2004; 23: pp. 769-775.
10. Coxson H.O.: Quantitative chest tomography in COPD research: chairman’s summary. Proc Am Thorac Soc 2008; 5: pp. 874-877.
11. Gierada D.S., Yusen R.D., Pilgram T.K., et. al.: Repeatability of quantitative CT indexes of emphysema in patients evaluated for lung volume reduction surgery. Radiology 2001; 22: pp. 448-454.
12. Stoel B.C., Stolk J.: Optimization and standardization of lung densitometry in the assessment of pulmonary emphysema. Invest Radiol 2004; 39: pp. 681-688.
13. Stolk J., Dirksen A., van der Lugt A.A., et. al.: Repeatability of lung density measurements with low-dose computed tomography in subjects with alpha1-antitrypsin deficiency-associated emphysema. Invest Radiol 2001; 36: pp. 648-651.
14. Stoel B.C., Putter H., Bakker M.E., et. al.: Volume correction in computed tomography densitometry for follow-up studies on pulmonary emphysema. Proc Am Thorac Soc 2008; 5: pp. 919-924.
15. Parr D.G., Stoel B.C., Stolk J., et. al.: Validation of computed tomographic lung densitometry for monitoring emphysema in α 1 -antitrypsin deficiency. Thorax 2006; 61: pp. 485-490.
16. Parr D.G., Sevenoaks M., Deng C.Q., et. al.: Detection of emphysema progression in alpha I-antitrypsin deficiency using CT densitometry; methodological advances. Respir Res 2008; 13: pp. 9-21.
17. Lopes Pegna A., Picozzi G., Mascalchi M., et. al.: Design, recruitment and baseline results of the ITALUNG trial for lung cancer screening with low-dose CT. Lung Cancer 2009; 64: pp. 34-40.
18. Marchianò A., Calabrò E., Civelli E., et. al.: Pulmonary nodules: volume repeatability at multidetector CT lung cancer screening. Radiology 2009; 251: pp. 919-925.
19. Parr D.G., Stoel B.C., Stolk J., et. al.: Influence of calibration on densitometric studies of emphysema progression using computed tomography. Am J Respir Crit Care Med 2004; 170: pp. 883-890.
20. Aberle D.R., Gamsu G., Henschke C.I., et. al.: A consensus statement of the Society of Thoracic Radiology: screening for lung cancer with helical computed tomography. J Thoracic Imaging 2001; 16: pp. 65-68.
21. Ridler TW, Calvard S. Picture thresholding using an iterative selection method. IEEE Trans System, Man Cybernetics 978; SMC-8:630–632.
22. Kuhnigk J.M., Dicken V., Zidowitz S., et. al.: Informatics in radiology (infoRAD): new tools for computer assistance in thoracic CT. Part 1. Functional analysis of lungs, lung lobes, and bronchopulmonary segments. Radiographics 2005; 25: pp. 525-536.
23. Stoel B.C., Parr D.G., Bakker E.M., et. al.: Can the extent of low-attenuation areas on CT scans really demonstrate changes in the severity of emphysema?. Radiology 2008; 247: pp. 293-294.
24. Shaker S.B., Dirksen A., Laursen L.C., et. al.: Volume adjustment of lung density by computed tomography scans in patients with emphysema. Acta Radiol 2004; 45: pp. 417-423.
25. Bland J.M., Altman D.G.: Statistical methods for assessing agreement between two methods of clinical measurement. Lancet 1986; 1: pp. 307-310.
26. Bland J.M., Altman D.G.: Measuring agreement in method comparison studies. Stat Methods Med Res 1999; 8: pp. 135-160.
27. Gevenois P.A., Scillia P., de Maertelaer V., et. al.: The effects of age, sex, lung size, and hyperinflation on CT lung densitometry. AJR Am J Roentgenol 1996; 167: pp. 1169-1173.
28. Madani A., Van Muylem A., Gevenois P.A.: Pulmonary emphysema: effect of lung volume on objective quantification at thin-section CT. Radiology 2010; 257: pp. 260-268.
29. Gietema H.A., Schilham A.M., van Ginneken B., et. al.: Monitoring of smoking-induced emphysema with CT in a lung cancer screening setting: detection of real increase in extent of emphysema. Radiology 2007; 244: pp. 890-897.
30. Hoffman E.A., Reinhardt J.M., Sonka M., et. al.: Characterization of the interstitial lung diseases via density-based and texture-based analysis of computed tomography images of lung structure and function. Acad Radiol 2003; 10: pp. 1104-1118.