
Rationale and Objectives
The aim of this study was to assess the Δ-projection image processing technique for visualizing tumor microvessels and for quantifying the area of tissue perfused by them on contrast-enhanced ultrasound images.
Materials and methods
The Δ-projection algorithm was implemented to quantify perfusion by tracking the running maximum of the difference (Δ) between the contrast-enhanced ultrasound image sequence and a baseline image. Twenty-five mice with subcutaneous K1735 melanomas were first imaged with contrast-enhanced grayscale and then with minimum-exposure contrast-enhanced power Doppler (minexCPD) ultrasound. Delta-projection images were reconstructed from the grayscale images and then used to evaluate the evolution of tumor vascularity during the course of contrast enhancement. The extent of vascularity (ratio of the perfused area to the tumor area) for each tumor was determined quantitatively from Δ-projection images and compared to the extent of vascularity determined from contrast-enhanced power Doppler images. Delta-projection and minexCPD measurements were compared using linear regression analysis.
Results
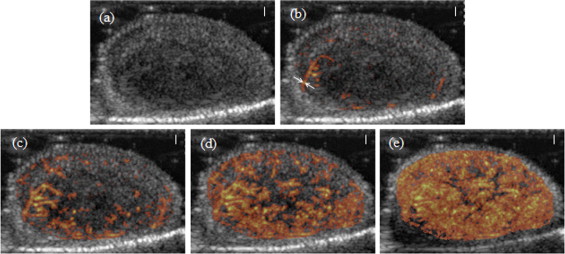
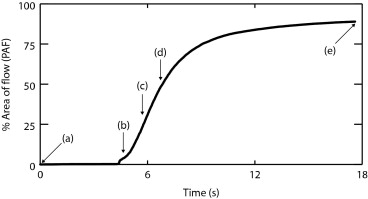
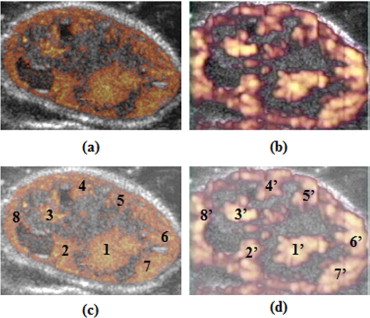
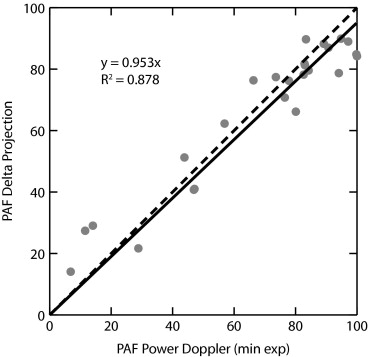
Delta-projection was successfully performed in all 25 cases. The technique allowed the dynamic visualization of individual blood vessels as they filled in real time. Individual tumor blood vessels were distinctly visible during early image enhancement. Later, as an increasing number of blood vessels were filled with the contrast agent, clusters of vessels appeared as regions of perfusion, and the identification of individual vessels became difficult. Comparisons were made between the perfused area of tumors in Δ-projections and in minexCPD images. The Δ-projection perfusion measurements were correlated linearly with minexCPD.
Conclusion
Delta-projection visualized tumor vessels and enabled the quantitative assessment of the tumor area perfused by the contrast agent.
Vascular targeting has evolved into an attractive approach for cancer therapy. Disruption of the tumor vasculature deprives the neoplasm of oxygen and eventually leads to tumor cell death. Several promising vascular disrupting agents (VDAs), including pharmaceutical ( ) and non-pharmaceutical ( ) agents, are currently being investigated in different phases of clinical trials. Such VDA evaluation requires an accurate method for the direct assessment of tumor vascularity in response to treatment. Measurement of tissue microvessel density by tumor biopsy is a potential approach for monitoring therapy. However, repeated assessment is often not possible, because of the invasive nature of the technique, and the procedure is prone to sampling error due to the small sample size. The destruction of blood vessels by the probing biopsy needle could further complicate the assessment. The direct visualization of tumor vasculature by imaging is an attractive alternative for assessing VDAs because it can be performed repeatedly, and it provides a global view of the change in tumor vascularity, either across an anatomic plane or over the entire tumor volume.
Diagnostic ultrasound is one of the most commonly used modalities for cancer imaging. The equipment is portable and is widely available in large and small imaging centers. It provides both high spatial and temporal resolution, and the Doppler mode enables the direct visualization of tumor blood vessels. Currently, clinical scanners allow the visualization of blood vessels that are 0.2 to 0.5 mm in diameter, but to image smaller blood vessels similar to those targeted by VDAs, ultrasound contrast agents must be used. Various ultrasound techniques have been proposed that use contrast agents in combination with power Doppler ( ) or grayscale imaging (fundamental ( ), harmonic ( ), or subharmonic ( )). Each approach has its strengths and weaknesses.
Get Radiology Tree app to read full this article<
Get Radiology Tree app to read full this article<
Materials and Methods
Animal and Imaging Studies
Get Radiology Tree app to read full this article<
Get Radiology Tree app to read full this article<
Get Radiology Tree app to read full this article<
Get Radiology Tree app to read full this article<
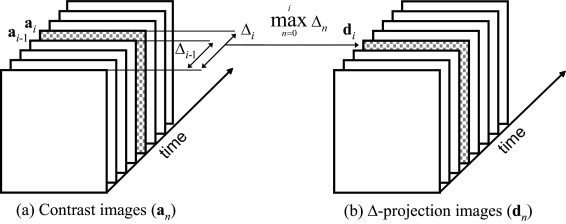
Description of the Δ-Projection Imaging Algorithm
Get Radiology Tree app to read full this article<
{dn}={max(a0,a1,…,ak)−a0}nk=0. {
d
n
}
=
{
max
(
a
0
,
a
1
,
…
,
a
k
)
−
a
0
}
k
=
0
n
.
Get Radiology Tree app to read full this article<
Get Radiology Tree app to read full this article<
Get Radiology Tree app to read full this article<
Get Radiology Tree app to read full this article<
Image Analysis for Δ-Projection and minexCPD
Delta-projection imaging
Get Radiology Tree app to read full this article<
Get Radiology Tree app to read full this article<
PAF(Δ)=100×(nΔ/N). PAF(Δ)
=
100
×
(
n
Δ
/
N
)
.
Get Radiology Tree app to read full this article<
Get Radiology Tree app to read full this article<
MinexCPD imaging
Get Radiology Tree app to read full this article<
PAF(D)=100×(nD/N). PAF(D)
=
100
×
(
n
D
/
N
)
.
Get Radiology Tree app to read full this article<
Comparison Between Δ-Projection and minexCPD
Get Radiology Tree app to read full this article<
Results
Get Radiology Tree app to read full this article<
Get Radiology Tree app to read full this article<
Get Radiology Tree app to read full this article<
Get Radiology Tree app to read full this article<
Get Radiology Tree app to read full this article<
Get Radiology Tree app to read full this article<
Discussion
Get Radiology Tree app to read full this article<
Get Radiology Tree app to read full this article<
Get Radiology Tree app to read full this article<
Get Radiology Tree app to read full this article<
Get Radiology Tree app to read full this article<
Get Radiology Tree app to read full this article<
Get Radiology Tree app to read full this article<
References
1. Hinnen P., Eskens F.A.: Vascular disrupting agents in clinical development. Br J Cancer 2007; 96: pp. 1159-1165.
2. Lippert J.W.: Vascular disrupting agents. Bioorg Med Chem 2007; 15: pp. 605-615.
3. Wood A.K.W., Ansaloni S., Ziemer L.S., Lee W.M.F., Feldman M.D., Sehgal C.M.: The antivascular action of physiotherapy ultrasound on murine tumors. Ultrasound Med Biol 2005; 31: pp. 1403-1410.
4. Bunte R.M., Ansaloni S., Sehgal C.M., Lee W.M.F., Wood A.K.W.: Histopathological observations of the antivascular effects of physiotherapy ultrasound on a murine neoplasm. Ultrasound Med Biol 2006; 32: pp. 453-461.
5. Tsai J.F., Makonnen S., Feldman M., Sehgal C.M., Maity A., Lee W.M.F.: Ionizing radiation inhibits tumor neovascularization by inducing ineffective angiogenesis. Cancer Biol Ther 2005; 4: pp. 1395-1400.
6. Chen B., Pogue B.W., Luna J.M., Hardman R.L., Hoopes P.J., Hasan T.: Tumor vascular permeabilization by vascular-targeting photosensitization: effects, mechanism, and therapeutic implications. Clin Cancer Res 2006; 12: pp. 917-923.
7. Sehgal C.M., Arger P.H., Pugh C.R., Kirchofer J.I., Kotlar E.Y., Bovee K.C.: Comparison of power Doppler and B-scan sonography for renal imaging using a sonographic contrast agent. J Ultrasound Med 1998; 17: pp. 751-756.
8. Kamotani Y., Lee W.M., Arger P.H., Cary T.W., Sehgal C.M.: Multigated contrast-enhanced power Doppler to measure blood flow in mice tumors. Ultrasound Med Biol 2003; 29: pp. 977-984.
9. Lassau N., Koscielny S., Opolon P., et. al.: Evaluation of contrast-enhanced color Doppler ultrasound for the quantification of angiogenesis in vivo. Invest Radiol 2001; 36: pp. 50-55.
10. Iordanescu I., Becker C., Zetter B., Dunning P., Taylor G.A.: Tumor vascularity: evaluation in a murine model with contrast-enhanced color Doppler US effect of angiogenesis inhibitors. Radiology 2002; 222: pp. 460-467.
11. Goertz D.E., Yu J.L., Kerbel R.S., Burns P.N., Foster F.S.: High-frequency Doppler ultrasound monitors the effects of antivascular therapy on tumor blood flow. Cancer Res 2002; 62: pp. 6371-6375.
12. Niermann K.J., Fleischer A.C., Huamani J., et. al.: Measuring tumor perfusion in control and treated murine tumors: correlation of microbubble contrast-enhanced sonography to dynamic contrast-enhanced magnetic resonance imaging and fluorodeoxyglucose positron emission tomography. J Ultrasound Med 2007; 26: pp. 749-756.
13. Kim S.H., Lee J.M., Kim K.G., et. al.: Comparison of fundamental sonography, tissue-harmonic sonography, fundamental compound sonography, and tissue-harmonic compound sonography for focal hepatic lesions. Eur Radiol 2006; 16: pp. 2444-2453.
14. Clevert D., Jung E.M., Jungius K.P., Ertan K., Kubale R.: Value of tissue harmonic imaging (THI) and contrast harmonic imaging (CHI) in detection and characterisation of breast tumours. Eur Radiol 2007; 17: pp. 1-10.
15. Yamamoto K., Shiraki K., Nakanishi S., et. al.: 1.5 harmonic imaging sonography with microbubble contrast agent improves characterization of hepatocellular carcinoma. World J Gastroenterol 2005; 11: pp. 5607-5613.
16. Forsberg F., Liu J.B., Shi W.T., et. al.: In vivo perfusion estimation using subharmonic contrast microbubble signals. J Ultrasound Med 2006; 25: pp. 15-21.
17. Wood A.K.W., Bunte R.M., Cohen J.D., Tsai J.H., Lee William M.-F., Sehgal C.M.: The antivascular action of physiotherapy ultrasound on a murine tumor: role of a microbubble contrast agent. Ultrasound Med Biol 2007; 33: pp. 1901-1910.
18. Sehgal C.M., Arger P.H., Rowling S.E., Conant E.F., Reynolds C., Patton J.A.: Quantitative vascularity of breast masses by Doppler imaging: regional variations and diagnostic implications. J Ultrasound Med 2000; 19: pp. 427-440.
19. Carmeliet P., Jain R.K.: Angiogenesis in cancer and other diseases. Nature 2000; 407: pp. 249-257.
20. Folkman J.: Tumor angiogenesis: therapeutic implications. N Engl J Med 1971; 285: pp. 1182-1186.
21. Wang Z., Tang J., An L., et. al.: Contrast-enhanced ultrasonography for assessment of tumor vascularity in hepatocellular carcinoma. J Ultrasound Med 2007; 26: pp. 757-762.
22. Huber S., Helbich T., Kettenbach J., Dock W., Zuna I., Delorme S.: Effects of a microbubble contrast agent on breast tumors: computer-assisted quantitative assessment with color Doppler US—early experience. Radiology 1998; 208: pp. 485-489.
23. Perini R, Choe R, Yodh AG, Sehgal C, Divgi CR, Rosen MA. Non-invasive assessment of tumor vasculature: techniques and clinical applications. Cancer Metastasis Rev. In press.