
Rationale and Objectives
Using low-dose computed tomography (LDCT), small and heterogeneous lung tumors are detected in screening. The criteria for assessing detected tumors are crucial for determining follow-up or resection strategies. The purpose of this study was to investigate the capacity of density features in differentiating lung tumors.
Materials and Methods
From July 2008 to December 2011, 48 surgically confirmed tumors (29 malignancies, comprising 17 cases of adenocarcinoma and 12 cases of adenocarcinoma in situ [AdIs], and 19 benignancies, comprising 11 cases of atypical adenomatous hyperplasia [AAH] and eight cases of benign non-AAH) in 38 patients were retrospectively evaluated, indicating that the positive predictive value (PPV) of physicians is 60.4% (29/48). Three types of density features, tumor disappearance rate (TDR), mean, and entropy, were obtained from the CT values of detected tumors.
Results
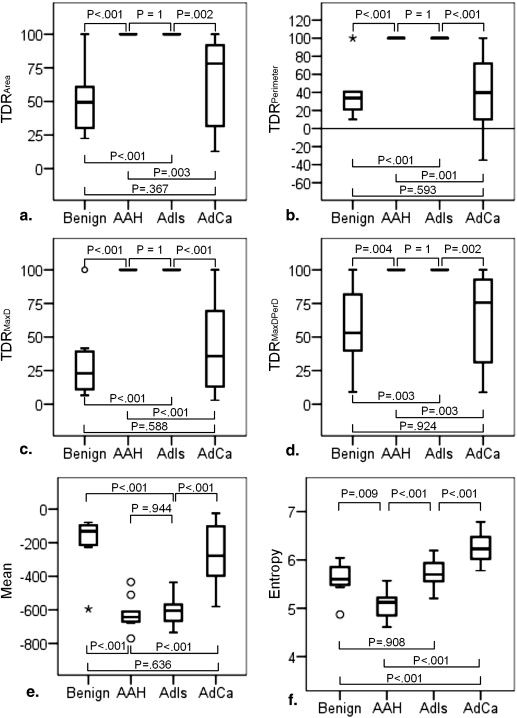
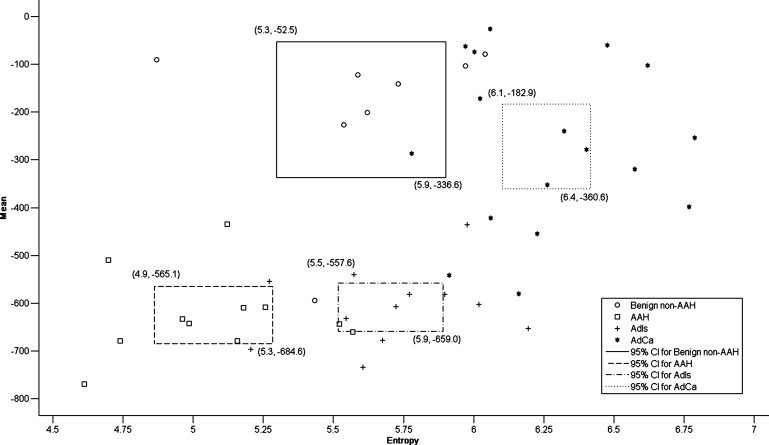
Entropy is capable of differentiating malignancy from benignancy but is limited in differentiating AdIs from benign non-AAH. The combination of entropy and TDR is effective for predicting malignancy with an accuracy of 87.5% (42/48) and a PPV of 89.7% (26/29), improving the PPV of physicians by 29.3%. The combination of entropy and mean adequately clarifies the four pathology groups with an accuracy of 72.9% (35/48). For tumors with a mean below −400 Hounsfield units, the criterion of an entropy larger than 5.4 might be appropriate for diagnosing malignancy. For others, the pathology is either benign non-AAH or adenocarcinoma; adenocarcinoma has a higher entropy than benign non-AAH, with the exception of tuberculoma.
Conclusions
Combining density features enables differentiating heterogeneous lung tumors in LDCT.
The advent of low-dose computed tomography (LDCT) has altered the landscape of lung cancer screening because of its capability of detecting tumors at early stages . The use of LDCT is particularly necessary for clinical applications in population-based screening and follow-up examinations because the risk of cancer caused by diagnostic X-ray-based examinations can thereby be reduced . Thin-section CT is also critical because it depicts realistic tumor characteristics , improves the probability of detecting small nodules , and identifies true calcification in subcentimeter nodules . However, the image quality is determined by the interaction between the radiation dose and slice thickness . Thin-section CT has the advantage of depicting realistic characteristics for tumor assessment, but a high radiation exposure is necessary for improving the image quality. The limitation of radiation exposure sacrifices the CT image quality acquired using the low-dose and thin-section protocol . Thus, the assessment of aggressive and heterogeneous tumors has become a challenge because interpretation is subjective, resulting in poor interobserver agreement regarding LDCT images of inferior quality, low tissue contrast, and high noise ratio.
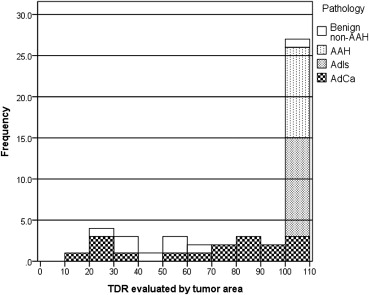
The tumor disappearance rate (TDR) is a simple method that assesses a lung tumor by comparing tumor sizes in a two-window (lung and mediastinal) setting . In each setting, the tumor size is measured according to the maximum diameter or the approximate area, which is the product of the maximum diameter and the perpendicular diameter. The TDR has been reported to correlate with clinical histopathology and conveys an independent prognostic factor . The TDR could also be used to evaluate the presence a high–CT attenuation component in the tumor. Based on the presence or absence of high-attenuation components, tumors can be classified into three categories: pure ground-glass opacity (GGO), partial-solid, and solid. In CT screening for lung cancer, the detected nodules are frequently partial-solid or non-solid, which are more likely to be malignant than those that are solid .
Get Radiology Tree app to read full this article<
Get Radiology Tree app to read full this article<
Materials and methods
Patients
Get Radiology Tree app to read full this article<
Get Radiology Tree app to read full this article<
Get Radiology Tree app to read full this article<
Get Radiology Tree app to read full this article<
Get Radiology Tree app to read full this article<
Table 1
Characteristics of Enrolled Patients
Characteristics Benign Non-AAH AAH AdIs AdCa Single/multiple lesions 2/6 5/6 8/4 17/0 Tumor size Minimum diameter (mm) 5.13 4.04 6.15 7.16 Maximum diameter (mm) 15.58 12.02 14.20 17.65 Mean ± SD 8.96 ± 3.25 7.35 ± 2.25 10.42 ± 2.46 12.00 ± 3.41 Male/female 3/2 3/6 3/8 9/8 Age (years) 50.80 ± 8.67 49.00 ± 10.90 48.27 ± 11.62 58.29 ± 9.69
AAH, atypical adenomatous hyperplasia; AdCa, adenocarcinoma; AdIs, adenocarcinoma in situ; SD, standard deviation.
Thirty-two patients have single lesion and six patients have multiple lesions.
Get Radiology Tree app to read full this article<
CT Screening Protocol
Get Radiology Tree app to read full this article<
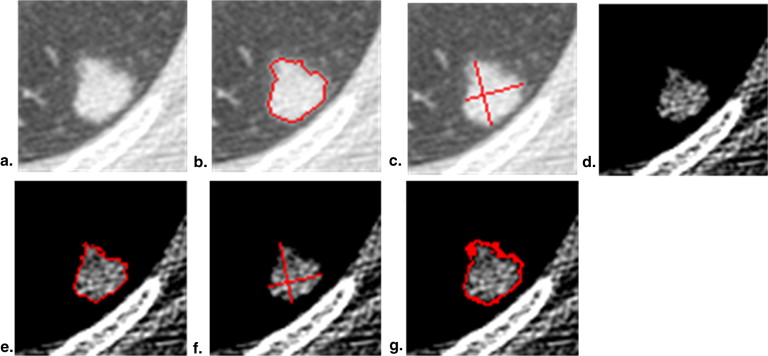
Target Tumor Identification
Get Radiology Tree app to read full this article<
Get Radiology Tree app to read full this article<
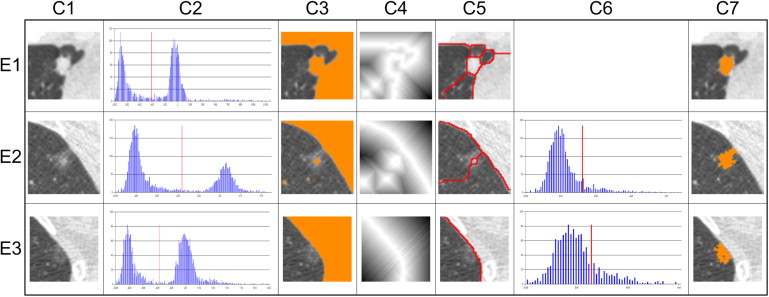
Computerized Features
Get Radiology Tree app to read full this article<
TDRArea=(1−(AreaMAreaL))×100%, TDR
Area
=
(
1
−
(
Area
M
Area
L
)
)
×
100
%
,
TDRPerimeter=(1−(PerMPerL))×100%, TDR
Perimeter
=
(
1
−
(
Per
M
Per
L
)
)
×
100
%
,
TDRMaxD=(1−(MDMMDL))×100%, TDR
MaxD
=
(
1
−
(
MD
M
MD
L
)
)
×
100
%
,
TDRMaxDPerD=(1−(MDM×PDMMDL×PDL))×100%. TDR
MaxDPerD
=
(
1
−
(
MD
M
×
PD
M
MD
L
×
PD
L
)
)
×
100
%
.
Get Radiology Tree app to read full this article<
Get Radiology Tree app to read full this article<
Mean=Σ(x,y)intumorI(x,y)N Mean
=
Σ
(
x
,
y
)
in
tumor
I
(
x
,
y
)
N
where I ( x , y ) represents the HU value at pixel ( x , y ), and N indicates the number of pixels in the identified tumor.
Get Radiology Tree app to read full this article<
Get Radiology Tree app to read full this article<
B1=[lowboundofCTvalue,C1),Bi=[Ci,Ci+1),i=1,2…,M−2,andBM=[CM−1,upperboundofCTvalue). B
1
=
[
low
bound
of
CT
value,
C
1
)
,
B
i
=
[
C
i
,
C
i
+
1
)
,
i
=
1
,
2
…
,
M
−
2
,
and
B
M
=
[
C
M
−
1
,
upper
bound
of
CT
value
)
.
Get Radiology Tree app to read full this article<
Get Radiology Tree app to read full this article<
P(Bi)=PiN P
(
B
i
)
=
P
i
N
Get Radiology Tree app to read full this article<
Get Radiology Tree app to read full this article<
Entropy=−ΣP(Bi)logP(Bi) Entropy
=
−
Σ
P
(
B
i
)
log
P
(
B
i
)
Get Radiology Tree app to read full this article<
Get Radiology Tree app to read full this article<
Statistical Methods
Get Radiology Tree app to read full this article<
Results
Tumor Sizes in Differentiating Tumor Types
Get Radiology Tree app to read full this article<
Table 2a
The Significance of the Difference between Any Two Tumor Types on Tumor Diameter
MD L Benign Non-AAH AAH AdIs AdCa Benign non-AAH .708 .755 .135 AAH .708 .114 .002 AdIs .755 .114 .569 AdCa .135 .002 .569
AAH, atypical adenomatous hyperplasia; AdCa, adenocarcinoma; AdIs, adenocarcinoma in situ; MD L , maximum diameter in the lung window.
Table 2b
The Significance of the Difference between Any Two Tumor Types on the Diameter of the Solid Component
MD M Benign Non-AAH AAH AdIs AdCa Benign non-AAH .006 .005 .989 AAH .006 1 <.001 AdIs .005 1 <.001 AdCa .989 <.001 <.001
AAH, atypical adenomatous hyperplasia; AdCa, adenocarcinoma; AdIs, adenocarcinoma in situ; MD M , maximum diameter in the mediastinal window.
Get Radiology Tree app to read full this article<
Correlations for Computerized TDR Features
Get Radiology Tree app to read full this article<
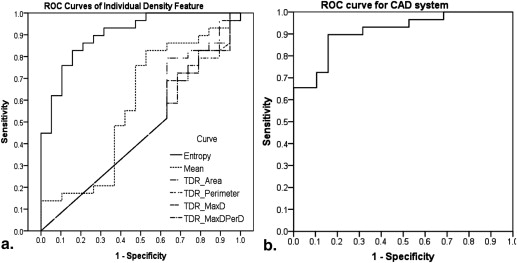
Capacity of Individual Density Features to Enable Discriminating Malignancy from Benignancy
Get Radiology Tree app to read full this article<
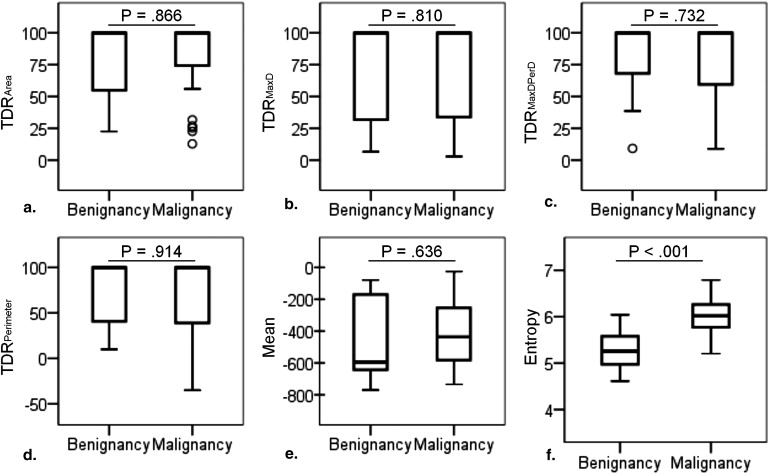
Get Radiology Tree app to read full this article<
Individual Density Feature Ability for Discriminating Histopathology
Get Radiology Tree app to read full this article<
Get Radiology Tree app to read full this article<
Get Radiology Tree app to read full this article<
Get Radiology Tree app to read full this article<
Get Radiology Tree app to read full this article<
Get Radiology Tree app to read full this article<
Computer-aided Diagnosis in Predicting Malignancy and in Classifying Histopathology
Get Radiology Tree app to read full this article<
P(lungcancer)=11+e−(8.568×Entropy+0.04TDRPerimeter−50.617). P
(
lung
cancer
)
=
1
1
+
e
−
(
8.568
×
Entropy
+
0.04
TDR
Perimeter
−
50.617
)
.
Table 3
Prediction Model Determines the Probability of Lung Cancer for Tumors Detected in LDCT
Predictor Variable_P_ Value Beta Coefficient Entropy .002 5259.924 TDR Perimeter .010 1.041 Constant .002 0
LDCT, low-dose computed tomography; TDR, tumor disappearance rate.
Get Radiology Tree app to read full this article<
Get Radiology Tree app to read full this article<
Get Radiology Tree app to read full this article<
Discussion
Get Radiology Tree app to read full this article<
Get Radiology Tree app to read full this article<
Get Radiology Tree app to read full this article<
Get Radiology Tree app to read full this article<
Get Radiology Tree app to read full this article<
Get Radiology Tree app to read full this article<
Get Radiology Tree app to read full this article<
Conclusion
Get Radiology Tree app to read full this article<
Acknowledgments
Get Radiology Tree app to read full this article<
References
1. National Lung Screening Trial Research Team , Aberle D.R., Adams A.M., Berg C.D., et. al.: Reduced lung-cancer mortality with low-dose computed tomographic screening. N Engl J Med 2011; 365: pp. 395-409.
2. Gohagan J., Marcus P., Fagerstrom R., et. al.: Baseline findings of a randomized feasibility trial of lung cancer screening with spiral CT scan vs chest radiograph: the Lung Screening Study of the National Cancer Institute. Chest 2004; 126: pp. 114-121.
3. van den Bergh K.A., Essink-Bot M.L., Bunge E.M., et. al.: Impact of computed tomography screening for lung cancer on participants in a randomized controlled trial (NELSON trial). Cancer 2008; 113: pp. 396-404.
4. Kalra M.K., Maher M.M., Toth T.L., et. al.: Strategies for CT radiation dose optimization. Radiology 2004; 230: pp. 619-628. Review
5. Chasen M.H., McCarthy M.J., Gilliland J.D., et. al.: Concepts in computed tomography of the thorax. Radiographics 1986; 6: pp. 793-832.
6. Fischbach F., Knollmann F., Griesshaber V., et. al.: Detection of pulmonary nodules by multislice computed tomography: improved detection rate with reduced slice thickness. Eur Radiol 2003; 13: pp. 2378-2383.
7. Lee H.Y., Goo J.M., Lee H.J., et. al.: Usefulness of concurrent reading using thin-section and thick-section CT images in subcentimetre solitary pulmonary nodules. Clin Radiol 2009; 64: pp. 127-132.
8. Bushberg J.T., Seibert J.A., Leidholdt E.M., et. al.: The essential physics of medical imaging.3rd ed.2011.Lippincott Williams & WilkinsPhiladelphia, PA
9. Diederich S., Lenzen H., Windmann R., et. al.: Pulmonary nodules: experimental and clinical studies at low-dose CT. Radiology 1999 Oct; 213: pp. 289-298.
10. Godoy M.C., Naidich D.P.: Subsolid pulmonary nodules and the spectrum of peripheral adenocarcinomas of the lung: recommended interim guidelines for assessment and management. Radiology 2009; 253: pp. 606-622. Review
11. Leader J.K., Warfel T.E., Fuhrman C.R., et. al.: Pulmonary nodule detection with low-dose CT of the lung: agreement among radiologists. AJR Am J Roentgenol 2005; 185: pp. 973-978.
12. Gierada D.S., Pilgram T.K., Ford M., et. al.: Lung cancer: interobserver agreement on interpretation of pulmonary findings at low-dose CT screening. Radiology 2008; 246: pp. 265-272.
13. Takamochi K., Nagai K., Yoshida J., et. al.: Pathologic N0 status in pulmonary adenocarcinoma is predictable by combining serum carcinoembryonic antigen level and computed tomographic findings. J Thorac Cardiovasc Surg 2001; 122: pp. 325-330.
14. Okada M., Nishio W., Sakamoto T., et. al.: Correlation between computed tomographic findings, bronchioloalveolar carcinoma component, and biologic behavior of small-sized lung adenocarcinomas. J Thorac Cardiovasc Surg 2004; 127: pp. 857-861.
15. Okada M., Tauchi S., Iwanaga K., et. al.: Associations among bronchioloalveolar carcinoma components, positron emission tomographic and computed tomographic findings, and malignant behavior in small lung adenocarcinomas. J Thorac Cardiovasc Surg 2007; 133: pp. 1448-1454.
16. Okada M., Nishio W., Sakamoto T., et. al.: Discrepancy of computed tomographic image between lung and mediastinal windows as a prognostic implication in small lung adenocarcinoma. Ann Thorac Surg 2003; 76: pp. 1828-1832. discussion 1832
17. Haraguchi N., Satoh H., Kikuchi N., et. al.: Prognostic value of tumor disappearance rate on computed tomography in advanced-stage lung adenocarcinoma. Clin Lung Cancer 2007; 8: pp. 327-330.
18. Henschke C.I., Yankelevitz D.F., Mirtcheva R., et. al., ELCAP Group: CT screening for lung cancer: frequency and significance of part-solid and nonsolid nodules. AJR Am J Roentgenol 2002; 178: pp. 1053-1057.
19. Kitami A., Kamio Y., Hayashi S., et. al.: One-dimensional mean computed tomography value evaluation of ground-glass opacity on high-resolution images. Gen Thorac Cardiovasc Surg 2012; 60: pp. 425-430.
20. Nomori H., Ohtsuka T., Naruke T., et. al.: Differentiating between atypical adenomatous hyperplasia and bronchioloalveolar carcinoma using the computed tomography number histogram. Ann Thorac Surg 2003; 76: pp. 867-871.
21. Ikeda K., Awai K., Mori T., et. al.: Differential diagnosis of ground-glass opacity nodules: CT number analysis by three-dimensional computerized quantification. Chest 2007; 132: pp. 984-990.
22. Ganeshan B., Abaleke S., Young R.C., et. al.: Texture analysis of non-small cell lung cancer on unenhanced computed tomography: initial evidence for a relationship with tumour glucose metabolism and stage. Cancer Imaging 2010; 10: pp. 137-143.
23. Wei-Chih Shen, Yang-Hao Yu, Cheng-Hung Chuang. Computer Aided Diagnosis for Pulmonary Nodule on Low-Dose Computed Tomography (LDCT) Using Density Features. In: Eighth International Conference on Computer Graphics, Imaging and Visualization (CGIV); 17–19 August, 2011; Singapore.
24. Wei-Chih Shen, Yang-Hao Yu, Shwn-Huey Shieh, et al. Ability of Density Feature in Low-Dose Computed Tomography for Evaluating Screened Lung Tumor. In: Sixth International Conference on Genetic and Evolutionary Computing (ICGEC); 25–28 August, 2012; Kitakyushu, Japan.
25. Travis W.D., Brambilla E., Muller-Hermlink H.K., et. al.: Pathology and genetics of tumours of the lung, pleura, thymus and heart.World Health Organization classification of tumours.2004.IARC PressLyon, France:
26. Travis W.D., Brambilla E., Noguchi M., et. al.: International association for the study of lung cancer/american thoracic society/european respiratory society international multidisciplinary classification of lung adenocarcinoma. J Thorac Oncol 2011; 6: pp. 244-285. Review
27. Kanal K.M., Stewart B.K., Kolokythas O., et. al.: Impact of operator-selected image noise index and reconstruction slice thickness on patient radiation dose in 64-MDCT. AJR Am J Roentgenol 2007; 189: pp. 219-225.
28. Otsu N.: A threshold selection method from gray-level histograms. IEEE Trans Syst Man Cybern 1979; 9: pp. 62-66.
29. Vincent Luc, Soille Pierre: Watersheds in digital spaces: an efficient algorithm based on immersion simulations. IEEE Trans Pattern Anal Mach Intell 1991; 13: pp. 583-598.
30. PASW Statistics, version 18.2010.SPSS IncChicago, IL
31. Cohen J.: Statistical power analysis for the behavioral sciences.2nd ed.1988.Lawrence ErlbaumHillsdale, NJ
32. Xu D.M., van Klaveren R.J., de Bock G.H., et. al.: Limited value of shape, margin and CT density in the discrimination between benign and malignant screen detected solid pulmonary nodules of the NELSON trial. Eur J Radiol 2008; 68: pp. 347-352.
33. Hartman T.E., Swensen S.J.: CT screening for lung cancer. Semin Roentgenol 2005; 40: pp. 193-196. Review
34. New York Early Lung Cancer Action Project Investigators: CT Screening for lung cancer: diagnoses resulting from the New York Early Lung Cancer Action Project. Radiology 2007; 243: pp. 239-249.