
Rationale and Objectives
This study aims to investigate the clinical significance of malignant non-mass enhancement (NME) descriptors in breast magnetic resonance images by assessing their correlation to the presence of invasion or lymph node metastasis.
Materials and Methods
Three radiologists independently reviewed magnetic resonance images with malignant NMEs between January 2008 and December 2009. Distribution was assessed first, and then each of four internal enhancement patterns—clumped, clustered ring, branching, and hypointense area—was evaluated dichotomously (yes or no). Because clustered rings and hypointense areas were thought to be major structural elements of heterogeneous NMEs, they were also evaluated by integrating them into one collective descriptor we called the “heterogeneous structures.” Chi-square test, Fisher exact test, or Student t test was used to analyze differences of variables by each reviewer. Positive predictive values (PPVs) of descriptors in predicting presence of invasion or lymph node metastasis were calculated. P < 0.05 was considered significant.
Results
We included 131 malignant NMEs (76 in situ and 55 invasive) in 129 patients (two bilateral). All three observers’ results showed clustered rings (PPVs 54.5%, 54.5%, 50.0%) ( P = 0.0005, 0.038, 0.029) and hypointense areas (PPVs 63.6%, 61.5%, 73.9%) ( P = 0.004, 0.024, 0.0006) to be significantly associated with invasion. When clustered rings and hypointense areas were integrated into heterogeneous structures, they were significantly associated with invasion (PPVs 54.3%, 53.3%, 51.8%) ( P = 0.0003, 0.016, 0.003).
Conclusions
The NME descriptors clustered rings, hypoechoic areas, and heterogeneous structures, assessed collectively, were associated with invasive breast cancer.
Introduction
Non-mass enhancement (NME) is one of the three lesion morphologies observed in magnetic resonance imaging (MRI) of breasts and is often associated with in situ lesions . However, NMEs with invasive components reportedly account for 10%–42% of total malignant NMEs . In situ and invasive lesions should be managed differently, especially when recent controversy about overtreatment of in situ breast cancer is taken into account .
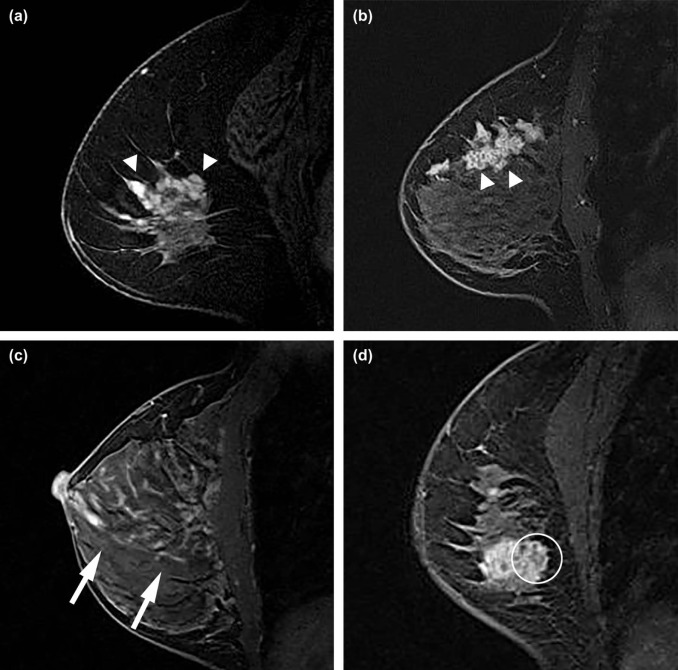
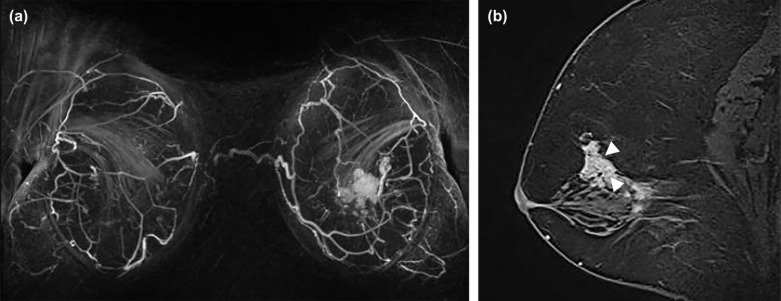
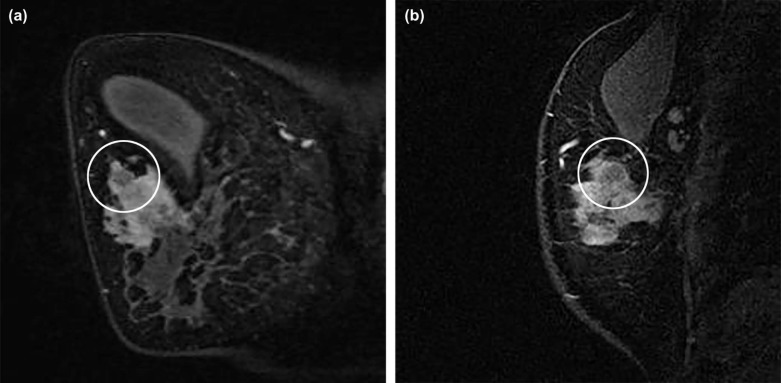
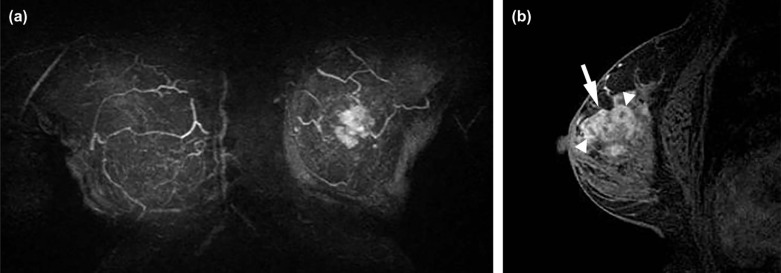
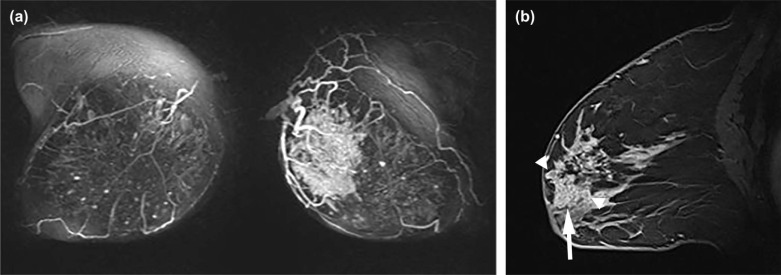
Breast Imaging Reporting and Data System (BI-RADS) descriptors have been investigated in differentiating benign from malignant NME . However, few prior studies have investigated relationships between descriptors of NMEs and significant clinical factors, including invasion within NMEs . Furthermore, other internal structural patterns within NMEs, which are not widely recognized or have not been adopted into MR lexicon at this point, are also encountered in clinical practice. For example, fine branching structures within NMEs that suggest possible enhancement within or around ducts and their branches have been associated with malignancy ( Fig 1c , called “branching” in this study). In addition, within NMEs, relatively hypointense, confined areas that show fewer enhancements than surrounding areas are occasionally observed ( Figs 1d, 3b, 4b, 5b ; called “hypointense areas” in this study). We believe that this finding seems to add another major structural element of heterogeneous NMEs in addition to the clustered ring, given that heterogeneous NMEs are supposed to include areas of varying enhancement.
Get Radiology Tree app to read full this article<
Get Radiology Tree app to read full this article<
Materials and Methods
Patients
Get Radiology Tree app to read full this article<
MRI Technique
Get Radiology Tree app to read full this article<
Get Radiology Tree app to read full this article<
Observer Study
Get Radiology Tree app to read full this article<
Statistical Analyses
Get Radiology Tree app to read full this article<
Get Radiology Tree app to read full this article<
Results
Study Subjects and Lesions
Get Radiology Tree app to read full this article<
Get Radiology Tree app to read full this article<
Analysis Between MRI Descriptors and Clinical Factors
Get Radiology Tree app to read full this article<
TABLE 1
Analyses Between MRI Descriptors Assessed by Reviewer 1 and Clinical Outcomes
Invasive In Situ PPV (95%CI) NPV (95%CI)P Distribution 0.82 Diffuse 1 2 Focal 6 7 Linear 0 1 Multiple 0 0 Regional 0 0 Segmental 48 66 Clumped +/− 33/22 53/23 38.4% (28.1–48.7%) 51.1% (36.5–65.7%) 0.25 Branching +/− 39/16 58/18 40.2% (30.4–50.0%) 52.9% (36.2–69.7%) 0.49 Heterogeneous structure +/− 44/11 37/39 54.3% (43.5–65.2%) 78.0% (66.5–89.5%) 0.0003 Clustered ring +/− 42/13 35/41 54.5% (43.4–65.7%) 75.9% (64.5–87.3%) 0.0005 Hypointense area +/− 21/34 12/64 63.6% (47.2–80.0%) 65.3% (55.9–74.7%) 0.004
LNM + − PPV (95%CI) NPV (95%CI)P Distribution 0.77 Diffuse 0 1 Focal 2 4 Linear 0 0 Regional 0 0 Segmental 13 37 Clumped +/− 5/8 28/14 15.2% (2.9–27.4%) 63.6% (43.5–83.7%) 0.11 Branching +/− 7/6 32/10 17.9% (5.9–30.0%) 62.5% (38.8–86.2%) 0.23 Heterogeneous structure +/− 12/1 32/10 27.3% (14.1–40.4%) 90.9% (73.9–100.0%) 0.27 Clustered ring +/− 12/1 30/12 28.6% (14.9–42.2%) 92.3% (77.8–100.0%) 0.16 Hypointense area +/− 4/9 17/25 19.0% (2.3–35.8%) 73.5% (58.7–88.4%) 0.75
CI, confidence interval; LNM, lymph node metastasis; NPV, negative predictive value; PPV, positive predictive value.
TABLE 2
Analyses Between MRI Descriptors Assessed by Reviewer 2 and Clinical Outcomes
Invasive In Situ PPV (95%CI) NPV (95%CI)P Distribution 0.76 Diffuse 0 0 Focal 10 13 Linear 5 10 Multiple 0 1 Regional 3 2 Segmental 37 50 Clumped +/− 36/19 57/19 38.7% (28.8–48.6%) 50.0% (34.1–65.9%) 0.23 Branching +/− 29/26 39/37 42.6% (30.9–54.4%) 58.7% (46.6–70.9%) 0.87 Heterogeneous structure +/− 32/23 28/48 53.3% (40.7–66.0%) 67.6% (56.7–78.5%) 0.016 Clustered ring +/− 24/31 20/56 54.5% (39.8–69.3%) 64.4% (54.4–74.4%) 0.038 Hypointense area +/− 16/39 10/66 61.5% (42.8–80.2%) 62.9% (53.6–72.1%) 0.024
LNM + − PPV (95%CI) NPV (95%CI)P Distribution 0.18 Diffuse 0 0 Focal 3 7 Linear 0 5 Regional 2 1 Segmental 8 29 Clumped +/− 7/6 29/13 19.4% (6.5–32.4%) 68.4% (47.5–89.3%) 0.50 Branching +/− 7/6 22/20 24.1% (8.6–39.7%) 76.9% (60.7–93.1%) 0.93 Heterogeneous structure +/− 9/4 23/19 28.1% (12.5–43.7%) 82.6% (67.1–98.1%) 0.52 Clustered ring +/− 6/7 18/24 25.0% (7.7–42.3%) 77.4% (62.7–92.1%) 0.83 Hypointense area +/− 4/9 12/30 25.0% (3.8–46.2%) 76.9% (63.7–90.1%) 1.0
CI, confidence interval; LNM, lymph node metastasis; NPV, negative predictive value; PPV, positive predictive value.
TABLE 3
Analyses Between MRI Descriptors Assessed by Reviewer 3 and Clinical Outcomes
Invasive In Situ PPV (95%CI) NPV (95%CI)P Distribution 0.19 Diffuse 0 0 Focal 4 9 Linear 1 1 Multiple 0 0 Regional 0 5 Segmental 50 61 Clumped +/− 41/14 61/15 40.2% (30.7–49.7%) 51.7% (33.5–69.9%) 0.44 Branching +/− 42/13 49/27 46.2% (35.9–56.4%) 67.5% (53.0–82.0%) 0.14 Heterogeneous structure +/− 43/12 40/36 51.8% (41.1–62.6%) 51.8% (41.1–62.6%) 0.003 Clustered ring +/− 38/17 38/38 50.0% (38.8–61.2%) 69.1% (56.9–81.3%) 0.029 Hypointense area +/− 17/38 6/70 73.9% (56.0–91.9%) 64.8% (55.8–73.8%) 0.0006
LNM + − PPV (95%CI) NPV (95%CI)P Distribution 0.85 Diffuse 0 0 Focal 1 3 Linear 0 1 Regional 0 0 Segmental 12 38 Clumped +/− 10/3 31/11 24.4% (11.2–37.5%) 78.6% (57.1–100.0%) 1.0 Branching +/− 7/6 35/7 16.7% (5.4–27.9%) 53.8% (26.7–80.9%) 0.07 Heterogeneous structure +/− 12/1 31/11 27.9% (14.5–41.3%) 91.7% (76.0–100.0%) 0.26 Clustered ring +/− 12/1 26/16 31.6% (16.8–46.4%) 94.1% (82.9–100.0%) 0.045 Hypointense area +/− 5/8 12/30 29.4% (7.8–51.1%) 78.9% (66.0–91.9%) 0.51
CI, confidence interval; LNM, lymph node metastasis; NPV, negative predictive value; PPV, positive predictive value.
Get Radiology Tree app to read full this article<
Interobserver Agreement of Descriptors
Get Radiology Tree app to read full this article<
TABLE 4
Interobserver Agreement of Descriptors Between Reviewers Expressed as Kappa Values
Reviewers Distribution Clumped Branching Heterogeneous Structure Clustered Ring Hypointense Area 1 vs 2 0.32 (0.19–0.45) 0.35 (0.18–0.52) 0.18 (0.02–0.33) 0.51 (0.37–0.64) 0.41 (0.28–0.54) 0.54 (0.37–0.71) 1 vs 3 0.26 (0.14–0.38) 0.41 (0.24–0.57) 0.29 (0.11–0.46) 0.51 (0.36–0.66) 0.42 (0.26–0.58) 0.37 (0.18–0.56) 2 vs 3 0.45 (0.31–0.59) 0.42 (0.25–0.60) 0.40 (0.25–0.54) 0.45 (0.31–0.59) 0.42 (0.29–0.55) 0.57 (0.39–0.75)
The 95% confidence intervals are shown in parentheses.
Get Radiology Tree app to read full this article<
Discussion
Get Radiology Tree app to read full this article<
Get Radiology Tree app to read full this article<
Get Radiology Tree app to read full this article<
Get Radiology Tree app to read full this article<
Get Radiology Tree app to read full this article<
Get Radiology Tree app to read full this article<
Get Radiology Tree app to read full this article<
Get Radiology Tree app to read full this article<
Get Radiology Tree app to read full this article<
Acknowledgment
Get Radiology Tree app to read full this article<
References
1. Liberman L., Morris E.A., Lee M.J., et. al.: Breast lesions detected on MR imaging: features and positive predictive value. AJR Am J Roentgenol 2002; 179: pp. 171-178.
2. Jansen S.A., Shimauchi A., Zak L., et. al.: The diverse pathology and kinetics of mass, nonmass, and focus enhancement on MR imaging of the breast. J Magn Reson Imaging 2011; 33: pp. 1382-1389.
3. Jiang L., Zhou Y., Wang Z., et. al.: Is there different correlation with prognostic factors between “non-mass” and “mass” type invasive ductal breast cancers?. Eur J Radiol 2013; 82: pp. 1404-1409.
4. Goto M., Yuen S., Akazawa K., et. al.: The role of breast MR imaging in pre-operative determination of invasive disease for ductal carcinoma in situ diagnosed by needle biopsy. Eur Radiol 2012; 22: pp. 1255-1264.
5. Francis A., Thomas J., Fallowfield L., et. al.: Addressing overtreatment of screen detected DCIS; the LORIS trial. Eur J Cancer 2015; 51: pp. 2296-2303.
6. Hersch J., Barratt A., Jansen J., et. al.: Use of a decision aid including information on overdetection to support informed choice about breast cancer screening: a randomised controlled trial. Lancet 2015; 385: pp. 1642-1652.
7. Gur D., Sumkin J.H.: Screening for early detection of breast cancer: overdiagnosis versus suboptimal patient management. Radiology 2013; 268: pp. 327-328.
8. Gutierrez R.L., DeMartini W.B., Eby P.R., et. al.: BI-RADS lesion characteristics predict likelihood of malignancy in breast MRI for masses but not for nonmasslike enhancement. AJR Am J Roentgenol 2009; 193: pp. 994-1000.
9. Mahoney M.C., Gatsonis C., Hanna L., et. al.: Positive predictive value of BI-RADS MR imaging. Radiology 2012; 264: pp. 51-58.
10. Pinker-Domenig K., Bogner W., Gruber S., et. al.: High resolution MRI of the breast at 3 T: which BI-RADS(R) descriptors are most strongly associated with the diagnosis of breast cancer?. Eur Radiol 2012; 22: pp. 322-330.
11. Tozaki M., Fukuda K.: High-spatial-resolution MRI of non-masslike breast lesions: interpretation model based on BI-RADS MRI descriptors. AJR Am J Roentgenol 2006; 187: pp. 330-337.
12. Uematsu T., Kasami M.: High-spatial-resolution 3-T breast MRI of nonmasslike enhancement lesions: an analysis of their features as significant predictors of malignancy. AJR Am J Roentgenol 2012; 198: pp. 1223-1230.
13. Baltzer P.A., Benndorf M., Dietzel M., et. al.: False-positive findings at contrast-enhanced breast MRI: a BI-RADS descriptor study. AJR Am J Roentgenol 2010; 194: pp. 1658-1663.
14. Baltzer P.A., Dietzel M., Kaiser W.A.: Nonmass lesions in magnetic resonance imaging of the breast: additional T2-weighted images improve diagnostic accuracy. J Comput Assist Tomogr 2011; 35: pp. 361-366.
15. Hahn S.Y., Han B.K., Ko E.Y., et. al.: MR features to suggest microinvasive ductal carcinoma of the breast: can it be differentiated from pure DCIS?. Acta Radiol 2013; 54: pp. 742-748.
16. Machida Y., Tozaki M., Shimauchi A., et. al.: Two distinct types of linear distribution in nonmass enhancement at breast MR imaging: difference in positive predictive value between linear and branching patterns. Radiology 2015; 276: pp. 686-694.
17. Yabuuchi H., Matsuo Y., Kamitani T., et. al.: Non-mass-like enhancement on contrast-enhanced breast MR imaging: lesion characterization using combination of dynamic contrast-enhanced and diffusion-weighted MR images. Eur J Radiol 2010; 75: pp. e126-e132.
18. Sakamoto N., Tozaki M., Higa K., et. al.: Categorization of non-mass-like breast lesions detected by MRI. Breast Cancer 2008; 15: pp. 241-246.
19. Tozaki M., Igarashi T., Fukuda K.: Breast MRI using the VIBE sequence: clustered ring enhancement in the differential diagnosis of lesions showing non-masslike enhancement. AJR Am J Roentgenol 2006; 187: pp. 313-321.
20. Christofori G.: New signals from the invasive front. Nature 2006; 441: pp. 444-450.
21. Newell D., Nie K., Chen J.H., et. al.: Selection of diagnostic features on breast MRI to differentiate between malignant and benign lesions using computer-aided diagnosis: differences in lesions presenting as mass and non-mass-like enhancement. Eur Radiol 2010; 20: pp. 771-781.
22. Goto M., Ito H., Akazawa K., et. al.: Diagnosis of breast tumors by contrast-enhanced MR imaging: comparison between the diagnostic performance of dynamic enhancement patterns and morphologic features. J Magn Reson Imaging 2007; 25: pp. 104-112.
23. Jansen S.A., Fan X., Karczmar G.S., et. al.: DCEMRI of breast lesions: is kinetic analysis equally effective for both mass and nonmass-like enhancement?. Med Phys 2008; 35: pp. 3102-3109.
24. Jansen S.A., Newstead G.M., Abe H., et. al.: Pure ductal carcinoma in situ: kinetic and morphologic MR characteristics compared with mammographic appearance and nuclear grade. Radiology 2007; 245: pp. 684-691.
25. Kuhl C.: The current status of breast MR imaging. Part I. Choice of technique, image interpretation, diagnostic accuracy, and transfer to clinical practice. Radiology 2007; 244: pp. 356-378.
26. Fischer U., Vosshenrich R., Kopka L., et. al.: [Contrast medium assisted dynamic MR-mammography after diagnostic and therapeutic interventions on the breast]. Bildgebung 1996; 63: pp. 94-100.