
Rationale and Objectives
Noninvasive molecular imaging of glioma tumor receptor activity was assessed with diagnostic in vivo fluorescence monitoring during targeted therapy. The study goals were to assess the range of use for treatment monitoring and stratification of tumor types using epidermal growth factor (EGF) receptor (EGFR) status with administration of fluorescently labeled EGF and determine its utility for tumor detection compared to magnetic resonance imaging (MRI).
Materials and Methods
EGFR+ and EGFR− glioma tumor lines (human glioma [U251-GFP] and rat gliosarcoma [9L-GFP], respectively) were used to assess these goals, having a 20-fold difference between their EGF uptakes.
Results
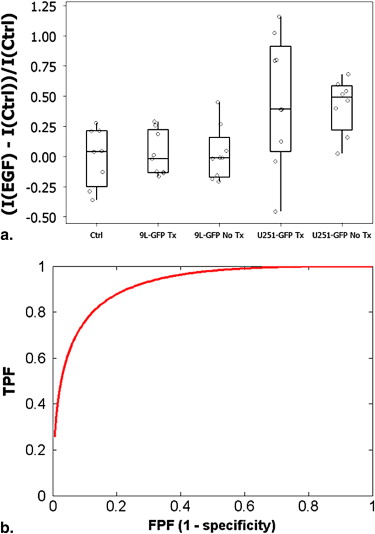
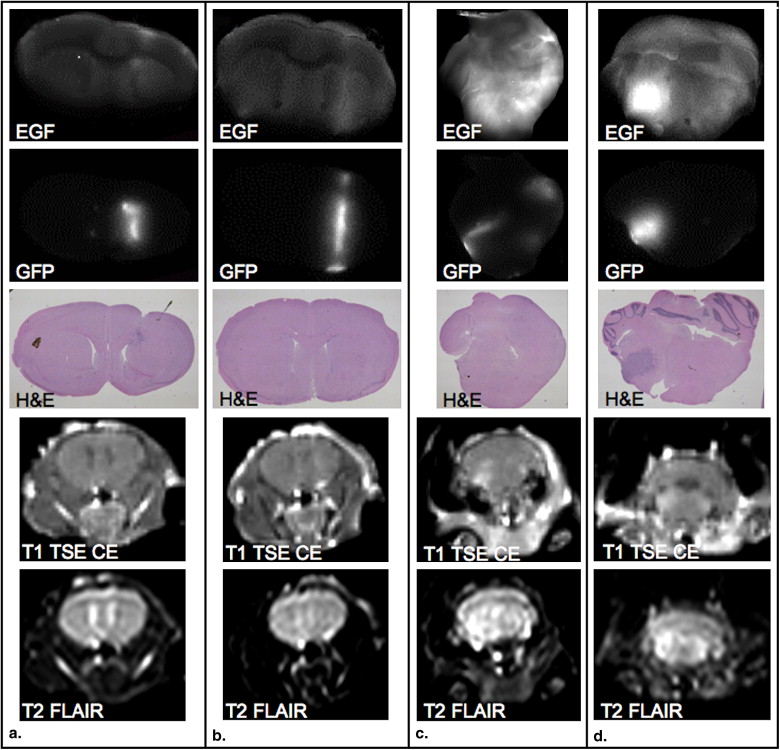
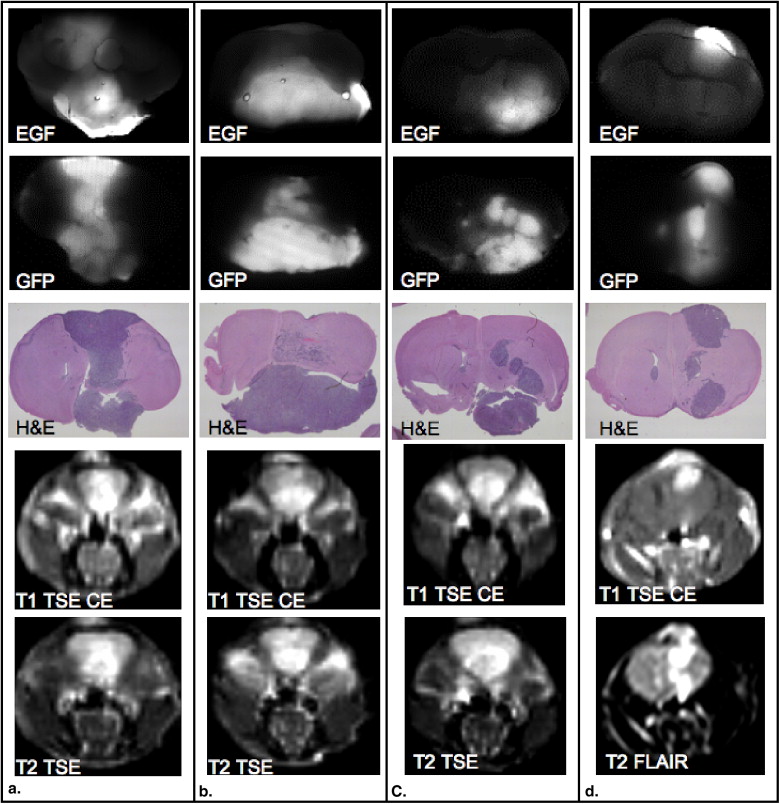
Treatment with cetuximab in the EGFR+ tumor-bearing animals led to decreased EGF tumor uptake, whereas for the EGFR− tumors, no change in fluorescence signal followed treatment. This diagnostic difference in EGFR expression could be used to stratify the tumor-bearing animals into groups of potential responders and nonresponders, and receiver-operating characteristic curve analysis revealed an area under the curve (AUC) of 0.92 in separating these tumors. The nonlocalized growth pattern of U251-GFP tumors resulted in detection difficulty on standard MRI, but high EGFR expression made them detectable by fluorescence imaging (AUC = 1.0). The EGFR+ U251-GFP tumor–bearing animals could be noninvasively stratified into treated and untreated groups on the basis of fluorescence intensity difference ( P = .035, AUC = 0.90).
Conclusions
EGFR expression was tracked in vivo with fluorescence and determined to be of use for the stratification of EGFR+ and EGFR− tumors, the detection of EGFR+ tumors, and monitoring of molecular therapy.
Although malignant gliomas account for a small percentage of cancers diagnosed, they have proved to be some of the least responsive to aggressive therapies, including surgical resection, radiation therapy, and temozolomide chemotherapy . As a result, average patient survival from the date of diagnosis is in the range of 9 to 12 months , and morbidity rates approach 100%. Given the poor performance of conventional therapies, new treatment approaches are necessary. Glioblastoma multiforme (GBM) has a defined set of “molecular lesions” as well as identified disruptions in signaling pathways and therefore may respond more readily to newly developed targeted therapies . One such target is epidermal growth factor (EGF) receptor (EGFR), which is overexpressed in 40% to 50% of all GBMs . Overexpression of EGFR appears to be correlated with glioma grade, and an unfavorable prognostic relationship has been shown between EGFR amplification and overall survival of patients with GBM . Part of the difficulty in the development and testing of targeted therapies is the need to track biomarkers and surrogate measures of response to therapy in individual subjects. In particular, molecular expression is known to increase or decrease significantly in response to therapy, and the ability to track expression during courses of therapy may become critically important. In this study, a novel optical method was considered to monitor targeted therapy diagnostically in vivo.
Overexpression of EGFR in GBM as well as many other types of cancer has been shown to promote the development and progression of malignancy given its association with cellular proliferation, angiogenesis, metastasis, and apoptosis inhibition . Anti-EGFR monoclonal antibodies target the extracellular domain of the receptor and have been shown to successfully block its activation . The IMC-C225, or cetuximab, antibody has been commercially developed by ImClone Systems Inc., (New York, NY) and is in clinical trials for several cancer types. Clinical trials for GBMs are still in their preliminary stages, although preclinical data suggested that systemic cetuximab treatment decreased proliferation and increased apoptosis in xenograft models of GBM grown both subcutaneously and orthotopically, when the cell line overexpressed EGFR . The ability to noninvasively track monoclonal antibody binding, tumor response, and EGFR expression in situ would have considerable value if it could be performed reliably with high sensitivity. Tumor tissue changes at the molecular level occur prior to any detectable tumor size changes, so the ability to dynamically and quantitatively assess and track the molecular profile in vivo could provide substantial patient benefit. Additionally, there is evidence to support the fact that signaling pathways change in response to receptor blocking therapy , so having the ability to track dynamic changes could significantly improve the potential of developing multireceptor targeting approaches.
Get Radiology Tree app to read full this article<
Materials and methods
Cell Culture and Brain Tumor Model
Get Radiology Tree app to read full this article<
Get Radiology Tree app to read full this article<
Get Radiology Tree app to read full this article<
In Vitro Fluorescence Monitoring of Cetuximab
Get Radiology Tree app to read full this article<
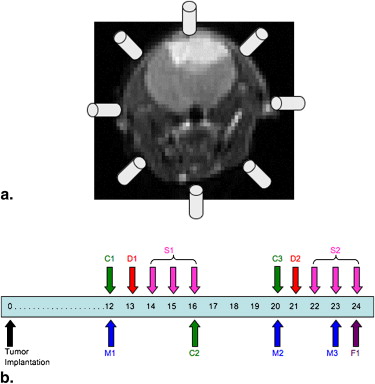
Multichannel Transmission Fluorescence Spectroscopy
Get Radiology Tree app to read full this article<
Get Radiology Tree app to read full this article<
Get Radiology Tree app to read full this article<
Spectral Data Postprocessing
Get Radiology Tree app to read full this article<
Magnetic Resonance Imaging (MRI) of Murine Brain Tumors
Get Radiology Tree app to read full this article<
In Vivo Fluorescence Monitoring of Cetuximab
Get Radiology Tree app to read full this article<
Ex Vivo Fluorescence Analysis
Get Radiology Tree app to read full this article<
Statistical Analysis
Get Radiology Tree app to read full this article<
Get Radiology Tree app to read full this article<
Get Radiology Tree app to read full this article<
Results
In Vitro Fluorescence Monitoring of Cetuximab Therapy
Get Radiology Tree app to read full this article<
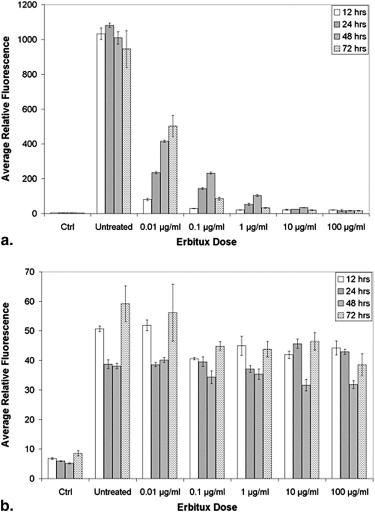
Get Radiology Tree app to read full this article<
Detection of EGFR+ and EGFR− Glioma with MRI and In Vivo Spectroscopy
Get Radiology Tree app to read full this article<
Table 1
ROC Curve Analysis for MRI, EGF-IRDye In Vivo Spectroscopy, and Ex Vivo Measurements
9L-GFP U251-GFP Treated vs Control Untreated vs Control Treated vs Untreated Treated vs Control Untreated vs Control Treated vs Untreated 9L-GFP Untreated vs U251-GFP Untreated T1 + Gd 1.00 1.00 0.57 0.50 0.54 0.50 0.96 T2 FLAIR 1.00 1.00 0.75 0.50 0.58 0.53 1.00 T1 FFE 1.00 0.94 0.69 0.75 0.88 0.70 0.75 T1 IR 1.00 1.00 1.00 0.85 0.83 0.60 1.00 T1 difference 1.00 1.00 0.50 0.60 0.50 0.57 1.00 Week 1, 24 h 0.50 0.50 0.50 0.78 0.88 0.51 0.92 Week 2, 24 h 0.85 0.72 0.67 0.88 1.00 0.90 0.80 Ex vivo 1.00 1.00 0.67 0.58 1.00 0.79 0.73
EGF-IRDye, endothelial growth factor–conjugated IRDye 800CW (LI-COR Biosciences, Lincoln, NE); FFE, fast-field echo; FLAIR, fluid-attenuated inversion recovery; Gd, gadolinium; IR, inversion recovery; 9L-GFP, rat gliosarcoma; ROC, receiver-operating characteristic curve; U251-GFP, human glioma.
Values represent area under the ROC curves.
Get Radiology Tree app to read full this article<
Noninvasive In Vivo Fluorescence Stratification of EGFR+ and EGFR− Glioma
Get Radiology Tree app to read full this article<
Get Radiology Tree app to read full this article<
Noninvasive Cetuximab Treatment Monitoring Using Fluorescently Labeled EGF
Get Radiology Tree app to read full this article<
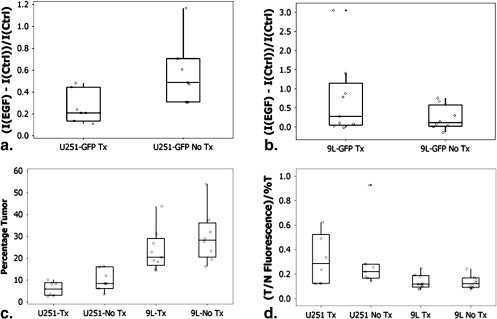
Get Radiology Tree app to read full this article<
Ex Vivo EGF-IRDye Fluorescence Verification and Tumor Size Comparison
Get Radiology Tree app to read full this article<
Get Radiology Tree app to read full this article<
Get Radiology Tree app to read full this article<
Get Radiology Tree app to read full this article<
Discussion
Get Radiology Tree app to read full this article<
Get Radiology Tree app to read full this article<
Get Radiology Tree app to read full this article<
Get Radiology Tree app to read full this article<
Get Radiology Tree app to read full this article<
Get Radiology Tree app to read full this article<
Get Radiology Tree app to read full this article<
Get Radiology Tree app to read full this article<
Conclusions
Get Radiology Tree app to read full this article<
Get Radiology Tree app to read full this article<
References
1. Sathornsumetee S., Rich J.N.: New treatment strategies for malignant glioma. Exp Rev Anticancer Ther 2006; 6: pp. 1087-1104.
2. Sathornsumetee S., Reardon D.A., Desjardins A., et. al.: Molecularly targeted therapy for malignant glioma. Cancer 2007; 110: pp. 13-24.
3. Mischel P.S., Cloughesy T.F.: Targeted molecular therapy of GBM. Brian Pathol 2003; 13: pp. 52-61.
4. Krishnan S., Rao R.D., James C.D., et. al.: Combination of epidermal growth factor targeted therapy with radiation therapy for malignant glioma. Front Biosci 2003; 8: pp. e1-e13.
5. Halatsch M.E., Schmidt U., Behnke-Mursch J., et. al.: Epidermal growth factor receptor inhibitors for the treatment of glioblastoma multiforme and other malignant brain tumors. Cancer Treat Rev 2006; 32: pp. 74-89.
6. Marshall J.: Clinical implications of the mechanism of epidermal growth factor receptor inhibitors. Cancer 2006; 107: pp. 1207-1218.
7. Harding J., Burtness B.: Cetuximab: an epidermal growth factor receptor chimeric human-murine monoclonal antibody. Drugs Today 2005; 41: pp. 107-127.
8. Eller J.L., Longo S.L., Hicklin D.J., et. al.: Activity of anti-epidermal growth factor receptor monocolonal antibody C225 against glioblastoma multiforme. Neurosurgery 2002; 51: pp. 1005-1014.
9. Eller J.L., Longo S.L., Kyle M.M., et. al.: Anti-epidermal growth factor receptor monocolonal antibody cetuximab augments radiation effects in glioblastoma multiforme in vitro and in vivo. Neurosurgery 2005; 56: pp. 155-162.
10. Sokolov K., Nida D., Descour M., et. al.: Molecular optical imaging of therapeutic targets of cancer. Adv Cancer Res 2007; 96: pp. 299-344.
11. Moore A., Marecos E., Simonova M., et. al.: Novel gliosarcoma cell line expressing green fluorescent protein: a model for quantitative assessment of angiogenesis. Microvasc Res 1998; 56: pp. 145-153.
12. Davis S.C., Pogue B.W., Springett R., et. al.: Magnetic resonance-coupled fluorescence tomography scanner for molecular imaging of tissue. Rev Sci Instrum 2008; pp. 79. 064302
13. Ntziachristos V., Turner G., Dunham J., et. al.: Planar fluorescence imaging using normalized data. J Biomed Optics 2005; 10: pp. 064007-1-064007-18.
14. Raben D., Helfrich B., Chan D.C., et. al.: The effects of cetuximab alone and in combination with radiation and/or chemotherapy in lung cancer. Clin Cancer Res 2005; 11: pp. 795-805.
15. Luo F.R., Yang Z., Dong H., et. al.: Correlation of pharmacokinetics with the antitumor activity of cetuximab in nude mice bearing the GEO human colon carcinoma xenograft. Cancer Chemother Pharmacol 2005; 56: pp. 455-464.
16. Gauthier-Balin D., Delord J.P., Rochaix P., et. al.: In vivo and in vitro antitumor activity of oxaliplatin in combination with cetuximab in human colorectal tumor cell lines expressing different levels of EGFR. Cancer Chemother Pharmacol 2006; 57: pp. 709-718.
17. Kovar J.L., Johnson M.A., Volcheck W.M., et. al.: Hyaluronidase expression induces prostate tumor metastasis in an orthotopic mouse model. Am J Pathol 2006; 169: pp. 1415-1426.
18. Pogue B.W., Davis S.C., Song X., et. al.: Image analysis methods for diffuse optical tomography. J Biomed Optics 2006; 11: pp. 033001-1-033001-16.
19. Kim E.S., Khuri F.R., Herbst R.S.: Epidermal growth factor receptor biology (IMC-C225). Curr Opin Oncol 2001; 13: pp. 506-513.
20. Baselga J.: The EGFR as a target for anticancer therapy—focus on cetuximab. Eur J Cancer 2001; 37: pp. S16-S22.