
Rationale and Objectives
To investigate the ability of variogram analysis of octree-decomposed computed tomography (CT) images and volume change maps to detect radiation-induced damage in rat lungs.
Materials and Methods
The lungs of female Sprague-Dawley rats were exposed to one of five absorbed doses (0, 6, 9, 12, or 15 Gy) of gamma radiation from a Co-60 source. At 6 months postexposure, pulmonary function tests were performed and four-dimensional (4D) CT images were acquired using a respiratory-gated microCT scanner. Volume change maps were then calculated from the 4DCT images. Octree decomposition was performed on CT images and volume change maps, and variogram analysis was applied to the decomposed images. Correlations of measured parameters with dose were evaluated.
Results
The effects of irradiation were not detectable from measured parameters, indicating only mild lung damage. Additionally, there were no significant correlations of pulmonary function results or CT densitometry with radiation dose. However, the variogram analysis did detect a significant correlation with dose in both the CT images ( r = −0.57, P = .003) and the volume change maps ( r = −0.53, P = .008).
Conclusion
This is the first study to use variogram analysis of lung images to assess pulmonary damage in a model of radiation injury. Results show that this approach is more sensitive to detecting radiation damage than conventional measures such as pulmonary function tests or CT densitometry.
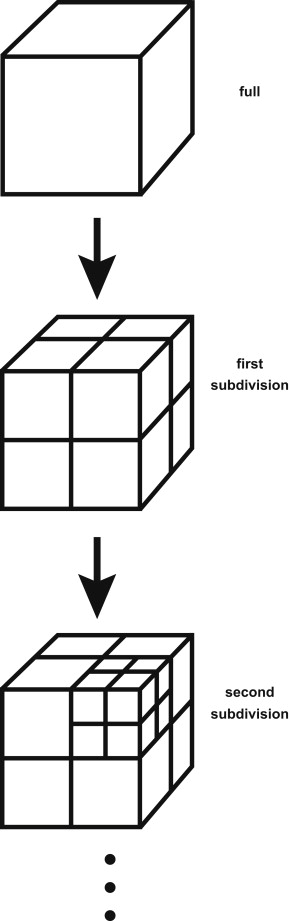
With the onset of certain diseases, lung tissue becomes more heterogeneous (ie, tissue density may present increased spatial variability), as is frequently evident in computed tomography (CT) images . Recent work by Subramaniam et al. used quadtree decomposition in two-dimensional (2D) slices of lung CT images to analyze heterogeneity. Selected slices were iteratively subdivided into quadrants based on an intensity range threshold and heterogeneity measured as the number of squares per area. However, this 2D approach neglects large portions of the lung and ignores three-dimensional (3D) spatial relationships. We extended the quadtree concept to 3D by using octrees to iteratively and nonsubjectively divide an entire 3D image into homogeneous cubes. This approach focuses on the parenchyma by eliminating tissue boundaries and reducing the influence of the vasculature . Instead of simply calculating the cube density, we analyzed spatial relationships for indications of heterogeneity using variograms, a well-established geostatistics tool for measuring spatial variability that compares sample variances to the distance of separation without a priori assumptions about the spatial relationships . Recent biologic applications of the variogram include the characterization of brain white matter in magnetic resonance images .
In this article, we demonstrate the use of noninvasive imaging and a novel 3D image analysis approach using variograms of octree-decomposed images to detect subtle injury in radiation-exposed rat lungs. It has been shown that lung injury in radiation-exposed rat lungs includes acute inflammation in the weeks after exposure and chronic fibrosis in the months after exposure while providing a relatively uniform injury over the dosed area . We show that the results of variogram analysis on octree-decomposed CT images and 4DCT-based volume maps of irradiated lungs correlates with radiation dose better than physiologic measurements, conventional pulmonary function tests, or CT density measurements.
Materials and methods
Get Radiology Tree app to read full this article<
Get Radiology Tree app to read full this article<
Get Radiology Tree app to read full this article<
Get Radiology Tree app to read full this article<
Get Radiology Tree app to read full this article<
Get Radiology Tree app to read full this article<
Get Radiology Tree app to read full this article<
Get Radiology Tree app to read full this article<
Get Radiology Tree app to read full this article<
Get Radiology Tree app to read full this article<
Get Radiology Tree app to read full this article<
Get Radiology Tree app to read full this article<
Get Radiology Tree app to read full this article<
Get Radiology Tree app to read full this article<
y=C+mdα y
=
C
+
m
d
α
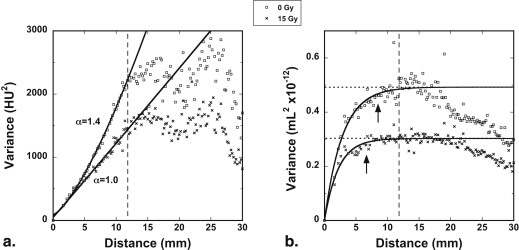
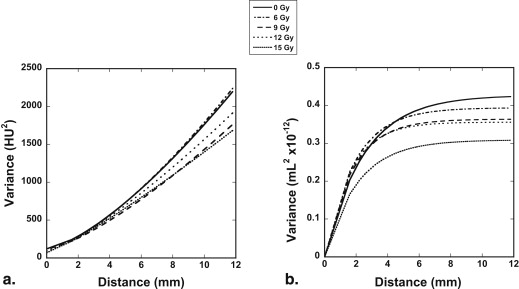
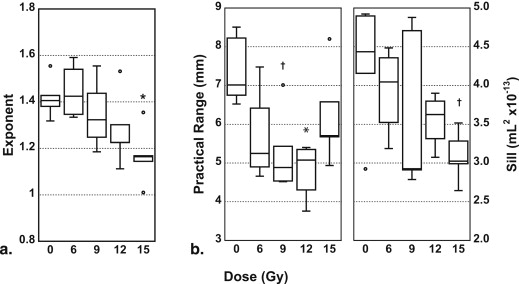
was least-squares fit to the data. C is a constant, m is the initial slope, d is the distance between octree cube centers, and α is an exponent that represents how rapidly the octree cubes become increasingly spatially dissimilar. Higher values of α (for α > 1) indicate that the variance is increasing at an increasing rate, implying that the lung becomes more heterogeneous on average with increasing distance from any given location. The ventilation maps, on the other hand, were fit to a model of exponential rise to an asymptotic value:
y=S[1−exp(−3d/R)], y
=
S
[
1
−
exp
(
−
3
d
/
R
)
]
,
where S is the asymptote (referred to the “sill” in geostatistics), d is the distance between octree cubes, and R (the “range”) is the distance at which the variance reaches ∼95% of S . The range characterizes the local “roughness,” with a larger R indicative of smoother variation. At distance R , the image becomes random, with little spatial change in variance. The sill indicates the degree of randomness or variety across the image. To compare measured parameters of the dosed groups against those of the control group, an analysis of variance was performed with a Dunnett post hoc test using a null hypothesis of α = 0.05. The significance of the correlation of dose level to different measured parameters (ie, dose-response) was tested using a paired t -test, also with a null hypothesis of α = 0.05.
Get Radiology Tree app to read full this article<
Results
Get Radiology Tree app to read full this article<
Table 1
Measured Parameters 6 Months Post-irradiation
0 Gy 6 Gy ∗ 9 Gy 12 Gy 15 Gy Physical measures BW 286 (9) 279 (11) 300 (10) 289 (13) 299 (14) Water wt 1.44 (0.18) 1.41 (0.06) 1.44 (0.14) 1.36 (0.14) 1.45 (0.07) Dry wt 0.302 (0.011) 0.315 (0.010) 0.306 (0.025) 0.321 (0.016) 0.327 (0.020) † Forced maneuvers TLC 24.6 (4.3) 19.5 (2.2) † 24.1 (1.2) 23.0 (1.2) 23.4 (3.0) FRC 7.3 (1.3) 5.7 (0.5) 7.6 (1.4) 6.3 (0.5) 6.7 (1.2) RV 2.7 (1.5) 2.5 (0.2) 2.6 (1.2) 2.7 (0.7) 3.0 (0.5) TLC/BW 8.59 (1.31) 6.95 (0.54) 8.03 (0.46) 7.97 (0.67) 7.81 (0.90) Cchord 1.43 (0.27) 1.10 (0.07) † 1.29 (0.11) 1.26 (0.07) 1.25 (0.18) FEV20 2.5 (0.1) 2.5 (0.2) 2.4 (0.1) 2.6 (0.2) 2.4 (0.4) FEV50 7.7 (0.3) 7.6 (0.5) 7.4 (0.3) 7.9 (0.4) 7.2 (1.1) FEV100 15.5 (0.9) 14.4 (1.1) 14.8 (0.9) 14.7 (0.7) 13.7 (2.5) FEV200 21.4 (2.4) 17.7 (1.4) 20.8 (2.3) 19.3 (0.8) 19.1 (2.8) PEF 178 (6) 173 (12) 170 (8) 182 (9) 165 (23) Spontaneous breathing BPM 122 (12) 136 (10) 133 (12) 119 (9) 129 (19) TV 2.5 (0.3) 2.3 (0.3) 2.5 (0.2) 2.1 (0.3) 2.3 (0.2) MV 306 (62) 318 (49) 329 (44) 256 (51) 295 (61) Ventilation PIP 5.1 (0.6) 5.6 (0.1) 4.9 (0.3) 5.2 (0.3) 5.1 (0.5) EEP 0.52 (0.11) 0.42 (0.09) 0.48 (0.09) 0.46 (0.08) 0.41 (0.07) PIV 2.13 (0.07) 2.05 (0.10) 2.15 (0.04) 2.14 (0.07) 2.12 (0.07) Cave 0.48 (0.08) 0.41 (0.02) 0.50 (0.03) 0.46 (0.02) 0.47 (0.05) Imaging HU (FRC) −621 (30) −554 (13) † −602 (35) −588 (27) −578 (41) HU (PIP) −684 (20) −637 (9) † −668 (27) −660 (21) −653 (25) CoV (FRC) 0.076 (0.003) 0.088 (0.005) † 0.079 (0.008) 0.079 (0.004) 0.083 (0.009) CoV (PIP) 0.069 (0.002) 0.075 (0.002) 0.069 (0.007) 0.070 (0.003) 0.072 (0.007) Vol CoV 0.60 (0.05) 0.48 (0.03) § 0.52 (0.03) 0.52 (0.06) ∗ 0.50 (0.05) ‡
BPM, breaths per minute; BW, body weight (g); Cave, average compliance (mL/cmH 2 O); Cchord, quasistatic chord compliance (mL/cmH 2 O); CoV, coefficient of variation; Dry wt, dry weight (g); EEP, end-expiratory pressure (cmH 2 O); FEV( t ), forced expiratory volume in t milliseconds; FRC, functional residual capacity (mL); HU, Hounsfield units; MV, minute volume (mL); PEF, peak expiratory flow (mL/sec); PIP, peak inspiratory pressure (cmH 2 O); PIV, peak inspiratory volume (mL); RV, residual volume (mL); TLC, total lung capacity (mL); TV, tidal volume (mL); Vol, volume map; Water wt, water weight (g).
Results are reported as mean values with standard deviations in parentheses.
Get Radiology Tree app to read full this article<
Get Radiology Tree app to read full this article<
Get Radiology Tree app to read full this article<
Get Radiology Tree app to read full this article<
Get Radiology Tree app to read full this article<
Get Radiology Tree app to read full this article<
Get Radiology Tree app to read full this article<
Get Radiology Tree app to read full this article<
Get Radiology Tree app to read full this article<
Get Radiology Tree app to read full this article<
Get Radiology Tree app to read full this article<
Get Radiology Tree app to read full this article<
Get Radiology Tree app to read full this article<
Discussion
Get Radiology Tree app to read full this article<
Get Radiology Tree app to read full this article<
Get Radiology Tree app to read full this article<
Get Radiology Tree app to read full this article<
Get Radiology Tree app to read full this article<
Get Radiology Tree app to read full this article<
Acknowledgments
Get Radiology Tree app to read full this article<
References
1. Mets O.M., de Jong P.A., van Ginneken B., et. al.: Quantitative computed tomography in COPD: possibilities and limitations. Lung 2012; 190: pp. 133-145.
2. Lynch D.A., Travis W.D., Muller N.L., et. al.: Idiopathic interstitial pneumonias: CT features. Radiology 2005; 236: pp. 10-21.
3. Subramaniam K., Hoffman E.A., Tawhai M.H.: Quantifying tissue heterogeneity using quadtree decomposition.2012.34th Annual International Conference of the IEEE EMBSSan Diego, CApp. 4079-4082.
4. Dua S., Kandiraju N., Chowriappa P.: Region quad-tree decomposition based edge detection for medical images. Open Med Inform J 2010; 4: pp. 50-57.
5. Gringarten E., Deutsch C.V.: Variogram interpretation and modeling. Math Geol 2001; 33: pp. 507-534.
6. Bohling GC. Introduction to geostatistics: Kansas geological survey open file report no. 2007-26; 2007.
7. Keil F., Oros-Peusquens A.M., Shah N.J.: Investigation of the spatial correlation in human white matter and the influence of age using 3-dimensional variography applied to MP-RAGE data. Neuroimage 2012; 63: pp. 1374-1383.
8. Lehnert S., el-Khatib E.: The use of CT densitometry in the assessment of radiation-induced damage to the rat lung: a comparison with other endpoints. Int J Radiat Oncol Biol Phys 1989; 16: pp. 117-124.
9. Ward E.R., Hedlund L.W., Kurylo W.C., et. al.: Proton and hyperpolarized helium magnetic resonance imaging of radiation-induced lung injury in rats. Int J Radiat Oncol Biol Phys 2004; 58: pp. 1562-1569.
10. Ward H.E., Kemsley L., Davies L., et. al.: The pulmonary response to sublethal thoracic irradiation in the rat. Radiat Res 1993; 136: pp. 15-21.
11. Quantitative concepts and dosimetry in radiobiology: Report 30: International Commission on Radiation Units (ICRU); 1979. pp. 13–14.
12. Ghosh S.N., Wu Q., Mader M., et. al.: Vascular injury after whole thoracic x-ray irradiation in the rat. Int J Radiat Oncol Biol Phys 2009; 74: pp. 192-199.
13. Novakova-Jiresova A., van Luijk P., van Goor H., et. al.: Changes in expression of injury after irradiation of increasing volumes in rat lung. Int J Radiat Oncol Biol Phys 2007; 67: pp. 1510-1518.
14. Jacob R.E., Lamm W.J.: Stable small animal ventilation for dynamic lung imaging to support computational fluid dynamics models. PLoS One 2011; 6: pp. e27577.
15. Rasband WS. ImageJ U.S. National Institutes of Health. http://imagej.nih.gov/ij/ .
16. Sacha J. ImageJ Plugins: 3D Toolkit http://ij-plugins.sourceforge.net/plugins/3d-toolkit/index.html .
17. Jacob R.E., Carson J.P., Thomas M., et. al.: Dynamic multiscale boundary conditions for 4D CT of healthy and emphysematous rats. PLoS One 2013; 8: pp. e65874.
18. Yin Y.: MDCT-based dynamic, subject-specific lung models via image registration for CFD-based interrogation of regional lung function.2011.Doctoral thesis, Department of Mechanical Engineering, The University of IowaIowa City, IA
19. Wiegman E.M., Meertens H., Konings A.W., et. al.: Loco-regional differences in pulmonary function and density after partial rat lung irradiation. Radiother Oncol 2003; 69: pp. 11-19.
20. Vujaskovic Z., Down J.D., van t’ Veld A.A., et. al.: Radiological and functional assessment of radiation-induced lung injury in the rat. Exp Lung Res 1998; 24: pp. 137-148.
21. van Eerde M.R., Kampinga H.H., Szabo B.G., et. al.: Comparison of three rat strains for development of radiation-induced lung injury after hemithoracic irradiation. Radiother Oncol 2001; 58: pp. 313-316.
22. Zhang R., Ghosh S.N., Zhu D., et. al.: Structural and functional alterations in the rat lung following whole thoracic irradiation with moderate doses: injury and recovery. Int J Radiat Biol 2008; 84: pp. 487-497.
23. Pauluhn J., Baumann M., Hirth-Dietrich C., et. al.: Rat model of lung fibrosis: comparison of functional, biochemical, and histopathological changes 4 months after single irradiation of the right hemithorax. Toxicology 2001; 161: pp. 153-163.
24. Calveley V.L., Khan M.A., Yeung I.W., et. al.: Partial volume rat lung irradiation: temporal fluctuations of in-field and out-of-field DNA damage and inflammatory cytokines following irradiation. Int J Radiat Oncol Biol Phys 2005; 81: pp. 887-899.
25. Kauczor H.U., Hast J., Heussel C.P., et. al.: CT attenuation of paired HRCT scans obtained at full inspiratory/expiratory position: comparison with pulmonary function tests. Eur Radiol 2002; 12: pp. 2757-2763.