
Rationale and Objectives
The purpose of this study was to evaluate the possibility of detecting a fatty liver after binge drinking in an animal model using 1 H magnetic resonance spectroscopy ( 1 H-MRS), dual-energy computed tomography (DECT), biochemistry, and the gold standard of histology.
Materials and Methods
In 20 inbred female Lewis rats, an alcoholic fatty liver was induced; 20 rats served as controls. To simulate binge drinking, each rat was given a dose of 9.3 g/kg body weight 50% ethanol twice, with 24 hours between applications. Forty-eight hours after the first injection, DECT and 1 H-MRS were performed. Fat content as well as triglycerides were also determined histologically and biochemically, respectively. To assess specific liver enzymes, blood was drawn from the orbital venous plexus.
Results
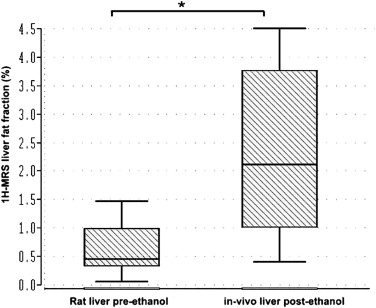
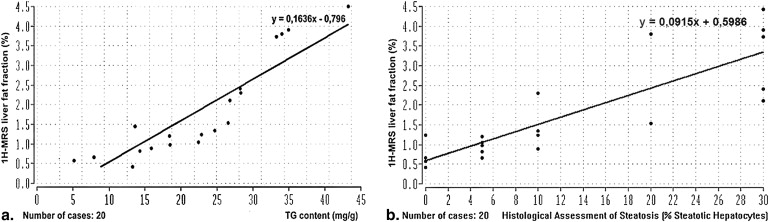
In all 20 animals in the experimental group, fatty livers were detected using 1 H-MRS, DECT, and biochemical and histologic analysis. The spectroscopic fat/water ratio and the biochemical determination were highly correlated ( r = 0.892, P < .05). A significant correlation was found between 1 H-MRS and histologic analysis ( r = 0.941, P < .001). Also, a positive linear correlation was found between the dual-energy computed tomographic density of ΔHU and the biochemical ( r = 0.751, P < .05) and histologic ( r = 0.786, P < .001) analyses.
Conclusions
Quantification of hepatic fat content on 1 H-MRS showed high correlation with histologic and biochemical steatosis determination. In comparison to DECT, it is more suitable to reflect the severity of acute fatty liver.
Binge drinking is a modern form of drinking alcoholic beverages with the primary intention of becoming intoxicated through heavy consumption of alcohol . A standardized conceptual definition of binge drinking was proposed by the National Institute on Alcohol Abuse and Alcoholism in 2004: a “binge” is a pattern of drinking alcohol that elevates the blood alcohol content to ≥0.08 g%. For the typical adult, this pattern corresponds to consuming five or more drinks for men, or four or more drinks for women, in about 2 hours , whereby according to the Centers for Disease Control and Prevention, a standard drink is defined as 0.6 fluid ounces of pure alcohol.
Especially among young people, binge drinking is often regarded as a fun, social activity, with little thought given to the health effects that may follow, and it accounts for a large proportion of all alcohol-related deaths, which makes it an increasingly important topic in alcohol research. In 2004 in the European region, alcohol-attributable deaths in men (11.0%) and woman (1.8%) were above average. Aftereffects were neuropsychiatric disorders, cardiovascular diseases, liver cirrhosis, and cancer . Another study reported that in 2008 in Germany, approximately 25,700 children, teenagers, and adults (aged 10–20 years) had been in hospitals for acute alcohol intoxication, an 11% increase since 2007 and a 170% increase since 2000 .
Get Radiology Tree app to read full this article<
Get Radiology Tree app to read full this article<
Materials and methods
Animals
Get Radiology Tree app to read full this article<
Get Radiology Tree app to read full this article<
Acute Ethanol Intoxication
Get Radiology Tree app to read full this article<
Measurements
Get Radiology Tree app to read full this article<
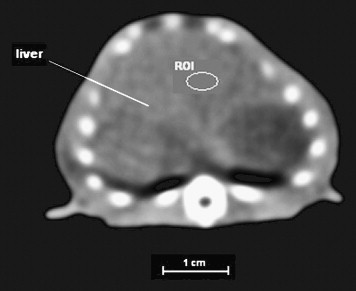
DECT
Get Radiology Tree app to read full this article<
Get Radiology Tree app to read full this article<
Get Radiology Tree app to read full this article<
Get Radiology Tree app to read full this article<
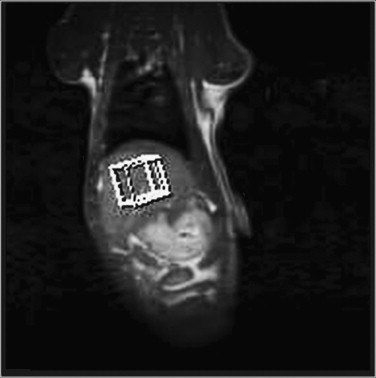
Magnetic Resonance Imaging (MRI)
Get Radiology Tree app to read full this article<
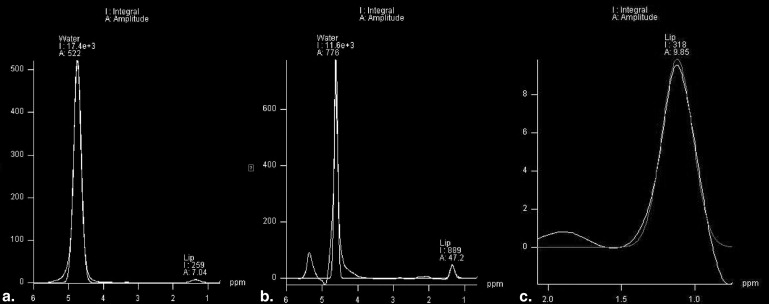
1 H-MRS
Get Radiology Tree app to read full this article<
Get Radiology Tree app to read full this article<
Get Radiology Tree app to read full this article<
Get Radiology Tree app to read full this article<
Biochemical Analysis
Determination of Hepatic Triglycerides (TG)
Get Radiology Tree app to read full this article<
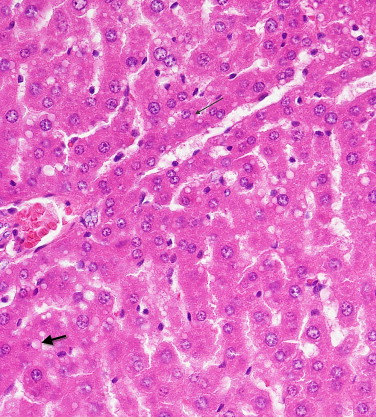
Liver histology
Get Radiology Tree app to read full this article<
Serologic parameters
Get Radiology Tree app to read full this article<
Statistical Analysis
Get Radiology Tree app to read full this article<
Results
Histologic Results
Get Radiology Tree app to read full this article<
Get Radiology Tree app to read full this article<
DECT
Get Radiology Tree app to read full this article<
Get Radiology Tree app to read full this article<
![Figure 5, (a) Computed tomographic signal intensity (in Hounsfield units [HU]) in relation to biochemical triglyceride analysis according to Folch et al (15) (milligrams of triglycerides per grams of liver tissue). Scatterplot and regression line show correlation between ΔHU (140 kV − 80 kV), calculated with dual-energy computed tomography, and the biochemical triglyceride analysis ( r = 0.751, P < .05). (b) Correlation between ΔHU and histologic values ( r = 0.786 P < .001).](https://storage.googleapis.com/dl.dentistrykey.com/clinical/DetectionofaFattyLiverAfterBingeDrinking/4_1s20S1076633211003527.jpg)
Get Radiology Tree app to read full this article<
1 H-MRS
Get Radiology Tree app to read full this article<
Get Radiology Tree app to read full this article<
Serologic Parameters
Get Radiology Tree app to read full this article<
Table 1
Summary of Correlation Results (and Probability) from 1 H-MRS and Biochemical and Histologic Analyses and Serologic Parameters
Correlation_r__P_ 1 H-MRS vs histology 0.941 <.001 1 H-MRS vs biochemistry 0.892 <.05 1 H-MRS in vivo vs AST 0.862 <.001 1 H-MRS vs ALT 0.528 <.001 ΔHU vs histology 0.786 <.001 ΔHU vs biochemistry 0.751 <.05 ΔHU vs AST −0.743 <.001 ΔHU vs ALT −0.344 <.001
ALT, alanine aminotransferase; AST, aspartate aminotransferase; HU, Hounsfield units; MRS, magnetic resonance spectroscopy.
Correlation coefficients were calculated using Pearson’s correlation test. Significance was established at the 95% confidence level ( P < .05).
Get Radiology Tree app to read full this article<
Discussion
Get Radiology Tree app to read full this article<
Get Radiology Tree app to read full this article<
Get Radiology Tree app to read full this article<
Get Radiology Tree app to read full this article<
Get Radiology Tree app to read full this article<
Conclusions
Get Radiology Tree app to read full this article<
References
1. Renaud S.C.: Diet and stroke. J Nutr Health Aging 2001; 5: pp. 167-172.
2. National Institute of Alcohol Abuse and Alcoholism. Council approves definition of binge drinking. NIAAA Newsletter 2004. Available at: http://pubs.niaaa.nih.gov/publications/Newsletter/winter2004/Newsletter_Number3.htm . Accessed October 25, 2007.
3. Rehm J., Mathers C., Popova S., et. al.: Global burden of disease and injury and economic cost attributable to alcohol use and alcohol-use disorders. Lancet 2009; 373: pp. 2223-2233.
4. Kodama Y., Ng C.S., Wu T.T., et. al.: Comparison of CT methods for determining the fat content of the liver. AJR Am J Roentgenol 2007; 188: pp. 1307-1312.
5. Ceccanti M., Attili A., Balducci G., et. al.: Acute alcoholic hepatitis. J Clin Gastroenterol 2006; 40: pp. 833-841.
6. Li SZT-K , Li T.K.: Determinants of alcohol use and abuse: impact of quantity and frequency patterns on liver disease. Hepatology 2007; 46: pp. 2032-2039.
7. Powell E.E., Cooksley W.G., Hanson R., et. al.: The natural history of nonalcoholic steatohepatitis: a follow-up study of forty-two patients for up to 21 years. Hepatology 1990; 11: pp. 74-80.
8. Thomas E.L., Hamilton G., Patel N., et. al.: Hepatic triglyceride content and its relation to body adiposity: a magnetic resonance imaging and proton magnetic resonance spectroscopy study. Gut 2005; 54: pp. 122-127.
9. Joseph A.E., Joseph A.E., Saverymuttu S.H., et. al.: Comparison of liver histology with ultrasonography in assessing diffuse parenchymal liver disease. Clin Radiol 1991; 43: pp. 26-31.
10. Bohte A.E., van Werven J.R., Bipat S., et. al.: The diagnostic accuracy of US, CT, MRI and 1H-MRS for the evaluation of hepatic steatosis compared with liver biopsy: a meta-analysis. Eur Radiol 2011; 21: pp. 87-97.
11. Teli M.R., Day C.P., Burt A.D., et. al.: Determinants of progression to cirrhosis or fibrosis in pure alcoholic fatty liver. Lancet 1995; 346: pp. 987-990.
12. Ueno T., Sugawara H., Sujaku K., et. al.: Therapeutic effects of restricted diet and exercise in obese patients with fatty liver. J Hepatol 1997; 27: pp. 103-107.
13. Wang B., Gao Z., Zou Q., et. al.: Quantitative diagnosis of fatty liver with dual-energy CT. An experimental study in rabbits. Acta Radiol 2003; 44: pp. 92-97.
14. Guiu B., Petit J.M., Loffroy R., et. al.: Quantification of liver fat content: comparison of triple-echo chemical shift gradient-echo imaging and in vivo proton MR spectroscopy. Radiology 2009; 250: pp. 95-102.
15. Folch J., Lees M., Sloane Stanley G.H.: A simple method for the isolation and purification of total lipides from animal tissues. J Biol Chem 1957; 226: pp. 497-509.
16. Gilat T., Leikin-Frenkel A., Goldiner I., et. al.: Prevention of diet-induced fatty liver in experimental animals by the oral administration of a fatty acid bile acid conjugate (FABAC). Hepatology 2003; 38: pp. 436-442.
17. Longo R., Ricci C., Masutti F., et. al.: Fatty infiltration of the liver. Quantification by 1H localized magnetic resonance spectroscopy and comparison with computed tomography. Invest Radiol 1993; 28: pp. 297-302.
18. Siegelman E.S., Rosen M.A.: Imaging of hepatic steatosis. Semin Liver Dis 2001; 21: pp. 71-80.
19. Venkataraman S., Braga L., Semelka R.C.: Imaging the fatty liver. Magn Reson Imaging Clin North Am 2002; 10: pp. 93-103.
20. Cassidy F.H., Yokoo T., Aganovic L., et. al.: Fatty liver disease: MR imaging techniques for the detection and quantification of liver steatosis. Radiographics 2009; 29: pp. 231-260.
21. Roldan-Valadez E., Favila R., Martínez-López M., et. al.: Imaging techniques for assessing hepatic fat content in nonalcoholic fatty liver disease. Ann Hepatol 2008; 7: pp. 212-220.
22. Marsman H.A., van Werven J.R., Nederveen A.J., et. al.: Noninvasive quantification of hepatic steatosis in rats using 3.0 T 1H-magnetic resonance spectroscopy. J Magn Reson Imaging 2010; 32: pp. 148-154.
23. Robinson E., Babb J., Chandarana H., et. al.: Dual source dual energy MDCT: comparison of 80 kVp and weighted average 120 kVp data for conspicuity of hypo-vascular liver metastases. Invest Radiol 2010; 45: pp. 413-418.
24. Johnson T.R., Krauss B., Sedlmair M., et. al.: Material differentiation by dual energy CT: initial experience. Eur Radiol 2007; 17: pp. 1510-1517.
25. Boyce C.J., Pickhardt P.J., Kim D.H., et. al.: Hepatic steatosis (fatty liver disease) in asymptomatic adults identified by unenhanced low-dose CT. AJR Am J Roentgenol 2010; 194: pp. 623-628.
26. Zachrisson H., Engström E., Engvall J., et. al.: Soft tissue discrimination ex vivo by dual energy computed tomography. Eur J Radiol 2010; 75: pp. e124-e128.
27. Zhong L., Chen J.J., Chen J., et. al.: Nonalcoholic fatty liver disease: quantitative assessment of liver fat content by computed tomography, magnetic resonance imaging and proton magnetic resonance spectroscopy. J Dig Dis 2009; 10: pp. 315-320.
28. Karcaaltincaba M., Akhan O.: Imaging of hepatic steatosis and fatty sparing. Eur J Radiol 2007; 61: pp. 33-43.
29. De Cecco C.N., Buffa V., Fedeli S., et. al.: Dual energy CT (DECT) of the liver: conventional versus virtual unenhanced images. Eur Radiol 2010; 20: pp. 2870-2875.
30. Mathurin P., Deltenre P.: Effect of binge drinking on the liver: an alarming public health issue?. Gut 2009; 58: pp. 613-617.
31. Kamel I.R., Kruskal J.B., Pomfret E.A., et. al.: Impact of multidetector CT on donor selection and surgical planning before living adult right lobe liver transplantation. AJR Am J Roentgenol 2001; 176: pp. 193-200.
32. Zorzano A., Herrera E.: In vivo ethanol elimination in man, monkey and rat: a lack of relationship between the ethanol metabolism and the hepatic activities of alcohol and aldehyde dehydrogenases. Life Sci 1990; 46: pp. 223-230.
33. Saadeh S., Younossi Z.M., Remer E.M., et. al.: The utility of radiological imaging in nonalcoholic fatty liver disease. Gastroenterology 2002; 123: pp. 745-750.
34. Birnbaum B.A., Hindman N., Lee J., et. al.: Multi-detector row CT attenuation measurements: assessment of intra- and interscanner variability with an anthropomorphic body CT phantom. Radiology 2007; 242: pp. 109-119.
35. Reeder S.B., Ranallo F., Taylor A.J.: CT and MRI for determining hepatic fat content. AJR Am J Roentgenol 2008; 190: pp. W167.
36. Ling M., Brauer M.: Ethanol-induced fatty liver in the rat examined by in vivo 1H chemical shift selective magnetic resonance imaging and localized spectroscopic methods. Magn Reson Imaging 1992; 10: pp. 663-677.
37. Garbow J.R., Lin X., Sakata N., et. al.: In vivo MRS measurement of liver lipid levels in mice. J Lipid Res 2004; 45: pp. 1364-1371.
38. Sijens P.E., Edens M.A., Bakker S.J., et. al.: MRI-determined fat content of human liver, pancreas and kidney. World J Gastroenterol 2010; 16: pp. 1993-1998.
39. Cowin G.J., Jonsson J.R., Bauer J.D., et. al.: Magnetic resonance imaging and spectroscopy for monitoring liver steatosis. J Magn Reson Imaging 2008; 28: pp. 937-945.
40. Longo R., Pollesello P., Ricci C., et. al.: Proton MR spectroscopy in quantitative in vivo determination of fat content in human liver steatosis. J Magn Reson Imaging 1995; 5: pp. 281-285.
41. Rosenthal P., Haight M.: Aminotransferase as a prognostic index in infants with liver disease. Clin Chem 1989; 36: pp. 346-348.
42. Conigrave K.M., Davies P., Haber P., et. al.: Traditional markers of excessive alcohol use. Addiction 2003; 98: pp. 31-43.
43. Murayama H., Ikemoto M., Hamaoki M.: Ornithine carbamyltransferase is a sensitive marker for alcohol-induced liver injury. Clin Chim Acta 2009; 401: pp. 100-104.
44. Pratt D.S., Kaplan M.M.: Evaluation of abnormal liver-enzyme results in asymptomatic patients. N Engl J Med 2000; 342: pp. 1266-1271.
45. Jensen D.M., Dickerson D.D., Linderman M.A., et. al.: Serum alanine aminotransferase levels and prevalence of hepatitis A, B, and delta in outpatients. Arch Intern Med 1987; 147: pp. 1734-1737.
46. Sorbi D., Boynton J., Lindor K.D.: The ratio of aspartate aminotransferase to alanine aminotransferase: potential value in differentiating nonalcoholic steatohepatitis from alcoholic liver disease. Am J Gastroenterol 1999; 94: pp. 1018-1022.
47. American Gastroenterological Association : American Gastroenterological Association medical position statement: evaluation of liver chemistry tests. Gastroenterology 2002; 123: pp. 1364-1366.
48. Noguchi H., Tazawa Y., Nishinomiya F., et. al.: The relationship between serum transaminase activities and fatty liver in children with simple obesity. Acta Paediatr Jpn 1995; 37: pp. 621-625.
49. Mehta S.R., Thomas E.L., Patel N., et. al.: Proton magnetic resonance spectroscopy and ultrasound for hepatic fat quantification. Hepatol Res 2010; 40: pp. 399-406.