
Rationale and Objectives
The magnitude of iron-induced susceptibility changes in gradient echo T2*-weighted magnet resonance imaging (T2* MRI) increases with the field strength and should increase the sensitivity for detection of cerebral microbleeds (CMBs) at 3.0 T. To test these hypotheses, we prospectively examined individuals with documented CMBs at 1.5 and 3.0 T.
Materials and Methods
Five hundred fifty elderly individuals, who participated in an interdisciplinary study of healthy aging, were examined at 3.0 T using T2* MRI sequences (repetition time [TR]/echo time [TE]/flip angle [FA] = 573 ms/16 ms/18°). Individuals positive for CMBs were asked to undergo an additional examination at 1.5 T (TR/TE/FA = 663 ms/23 ms/18°). Images were analyzed independently by two observers. CMBs were counted throughout the brain and were qualitatively analyzed comparing the degree of visible hypointensity on a 5-point scale from 1 (complete signal loss) to 5 (no detection) for both field strengths. Contrast-to-noise ratio of CMBs to surrounding brain tissue was calculated.
Results
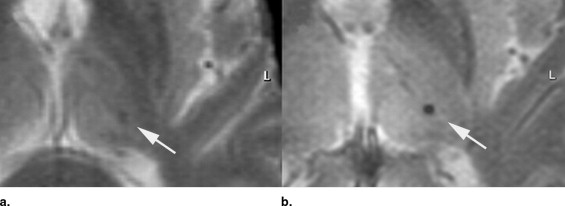
At 3.0 T, CMBs were detected in 45 of 550 individuals; 25 agreed to an additional examination at 1.5 T. In this group ( n = 25), a total of 53 CMBs were detected at 3.0 T, compared to 41 CMBs at 1.5 T. The mean contrast-to-noise ratio of CMBs was significantly increased at 3.0 T compared to 1.5 T (27.4 ± 8.2 vs. 17.4 ± 8.0; p < .001). On qualitative analysis, visibility of CMBs was ranked significantly higher at 3.0 T (1.3 ± 0.4 vs. 2.9 ± 1.1; p < .001).
Conclusion
Evidence of past microbleeds may even be found in neurologically normal elderly individuals by MRI. Detection rate and visibility of CMBs benefit from the higher field strength, resulting in a significantly improved depiction of iron-containing brain structures (CMBs) at 3.0 T with potential clinical relevance.
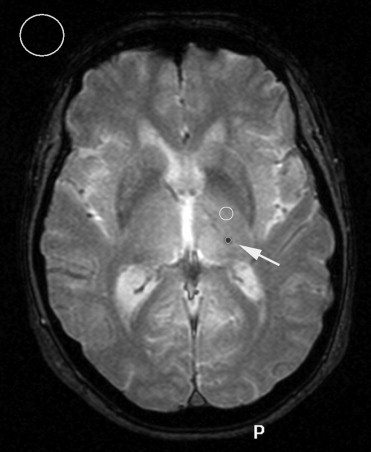
Cerebral microbleeds (CMBs) are discrete or isolated punctuate hypointense lesions less than 5 mm in size ( ). They are mainly located in the deep gray matter and subcortical white matter and persist indefinitely after initial detection. The best demonstration of CMB can be archived by gradient-echo T2*-weighted magnetic resonance imaging (MRI) sequences. Hemosiderin remains stored in macrophages and leads to focal dephasing of the MRI signal. This causes areas of past bleeding to appear dark on T2*-weighted images ( ). CMBs are generally considered clinically silent but are frequently associated wih small vessel disease, cerebral amyloid angiopathy, chronic hypertension, and lacunar stroke and may be a marker for increased risk for future intracerebral hemorrhage ( ). Further studies are needed to confirm these associations, and investigate other potential risk factors for the occurrence of CMB and their possible implications for antithrombotic treatment ( ).
Signal intensity and contrast of MRI are determined by a variety of factors, including relaxation times, proton density, field strength, and magnetic susceptibility. A new generation of whole-body MRI units with field strengths of 3.0 T has become increasingly available for routine imaging and currently is undergoing clinical evaluation ( ).
Get Radiology Tree app to read full this article<
Materials and methods
Subjects
Get Radiology Tree app to read full this article<
Get Radiology Tree app to read full this article<
MRI Examination
Get Radiology Tree app to read full this article<
Get Radiology Tree app to read full this article<
Table 1
Scan Parameters of the T2* MRI Sequence at 1.5 and 3.0 T
Parameter 1.5 T 3.0 T Matrix scan 256/256 320/512 Slice thickness 6 4 TR 663 573 TE 23 16 Flip angle 18 18 NSA 2 1 Scan duration (min) 3:11 1:35
Get Radiology Tree app to read full this article<
Qualitative Analysis
Get Radiology Tree app to read full this article<
Get Radiology Tree app to read full this article<
Quantitative Analysis
Get Radiology Tree app to read full this article<
CNR=(I1−I2)/N C
N
R
=
(
I
1
−
I
2
)
/
N
with I 1 = signal intensity of surrounding brain tissue, I 2 = signal intensity of CMB, and N = background noise.
Get Radiology Tree app to read full this article<
Get Radiology Tree app to read full this article<
Get Radiology Tree app to read full this article<
Statistical Analysis
Get Radiology Tree app to read full this article<
Results
Quantitative Results
Get Radiology Tree app to read full this article<
Get Radiology Tree app to read full this article<
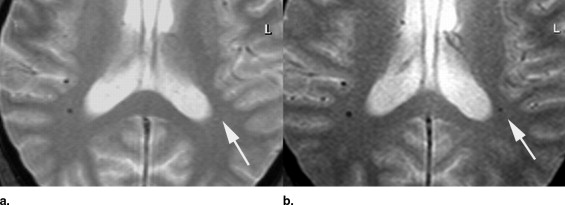
Table 2
Results of T2* Imaging at 1.5 and 3.0 T: Quantitative Data
Parameter 1.5 T 3.0 T_P_ Value No. of CMBs detected 41 53 0.001 Signal intensity (mean ± SD) CMB 585.8 ± 473.8 866.7 ± 301.4 Surrounding brain tissue 785.0 ± 633.7 1832.9 ± 304.6 Noise (mean) 11.4 ± 9.8 36.4 ± 6.3 Contrast to noise (mean ± SD) 17.4 ± 8.0 27.8 ± 8.2 0.001
CMBs, cerebral microbleeds; SD, standard deviation.
Get Radiology Tree app to read full this article<
Qualitative Results
Get Radiology Tree app to read full this article<
Get Radiology Tree app to read full this article<
Table 3
Results of T2* Imaging at 1.5 and 3.0 T: Qualitative Data
Parameter 1.5 T 3.0 T_P_ Value Visibility of CMBs (mean ± SD) 2.9 ± 1.1 1.3 ± 0.4 <0.001 Overall image quality (mean ± SD) 2.1 ± 1.0 1.3 ± 0.5 <0.001
CMBs, cerebral microbleeds; SD, standard deviation.
Scale from 1 to 5: 1 = complete signal loss to 5 = no detection (only assessable for 1.5).
Get Radiology Tree app to read full this article<
Discussion
Get Radiology Tree app to read full this article<
Get Radiology Tree app to read full this article<
Get Radiology Tree app to read full this article<
Get Radiology Tree app to read full this article<
Get Radiology Tree app to read full this article<
Get Radiology Tree app to read full this article<
Get Radiology Tree app to read full this article<
Limitations of the Study
Get Radiology Tree app to read full this article<
Get Radiology Tree app to read full this article<
Get Radiology Tree app to read full this article<
Get Radiology Tree app to read full this article<
Get Radiology Tree app to read full this article<
Conclusion
Get Radiology Tree app to read full this article<
Get Radiology Tree app to read full this article<
Get Radiology Tree app to read full this article<
References
1. Greenberg S.M., Finklestein S.P., Schaefer P.W.: Petechial hemorrhages accompanying lobar hemorrhage: Detection by gradient-echo MRI. Neurology 1996; 46: pp. 1751-1754.
2. Atlas S.W., Mark A.S., Grossman R.I., et. al.: Intracranial hemorrhage: Gradient-echo MR imaging at 1.5 T. Radiology 1988; 168: pp. 803-807.
3. Kato H., Izumiyama M., Izumiyama K., et. al.: Silent cerebral microbleeds on T2*-weighted MRI: Correlation with stroke subtype, stroke recurrence, and leukoaraiosis. Stroke 2002; 33: pp. 1536-1540.
4. Tanaka A., Ueno Y., Nakayama Y., et. al.: Small chronic hemorrhages and ischemic lesions in association with spontaneous intracerebral hematomas. Stroke 1999; 30: pp. 1637-1642.
5. Roob G., Schmidt R., Kapeller P., et. al.: MRI evidence of past cerebral microbleeds in a healthy elderly population. Neurology 1999; 52: pp. 991-994.
6. Lee S.H., Bae H.J., Yoon B.W., et. al.: Low concentration of serum total cholesterol is associated with multifocal signal loss lesions on gradient-echo magnetic resonance imaging: Analysis of risk factors for multifocal signal loss lesions. Stroke 2002; 33: pp. 2845-2849.
7. Werring D.J., Frazer D.W., Coward L.J., et. al.: Cognitive dysfunction in patients with cerebral microbleeds on T2*-weighted gradient-echo MRI. Brain 2004; 127: pp. 2265-2275.
8. Fan Y.H., Mok V.C., Lam W.W., et. al.: Cerebral microbleeds and white matter changes in patients hospitalized with lacunar infarcts. J Neurol 2004; 251: pp. 537-541.
9. Offenbacher H., Fazekas F., Schmidt R., et. al.: MR of cerebral abnormalities concomitant with primary intracerebral hematomas. AJNR Am J Neuroradiol 1996; 17: pp. 573-578.
10. Roob G., Schmidt R., Kapeller P., et. al.: MRI evidence of past cerebral microbleeds in a healthy elderly population. Neurology 1999; 52: pp. 991.
11. Greenberg S.M.: Cerebral amyloid angiopathy: Prospects for clinical diagnosis and treatment. Neurology 1998; 51: pp. 690-694.
12. Lee S.H., Kwon S.J., Kim K.S., et. al.: Cerebral microbleeds in patients with hypertensive stroke. J Neurol 2004; 251: pp. 1183-1189.
13. Koennecke H.C.: Cerebral microbleeds on MRI: Prevalence, associations, and potential clinical implications. Neurology 2006; 66: pp. 165-171.
14. Schwindt W., Kugel H., Bachmann R., et. al.: Magnetic resonance imaging protocols for examination of the neurocranium at 3 T. Eur Radiol 2003; 13: pp. 2170-2179.
15. Schild H.: Clinical highfield MR. Rofo 2005; 177: pp. 621-631.
16. Rottgen R., Haltaufderheide K., Schroder R.J., et. al.: The effect of the field strength on standardized MRI of the brain to demonstrate cranial nerves and vessels: a comparison of 1.5 and 3.0 Tesla. Rofo 2005; 177: pp. 530-535.
17. Stehling C., Niederstadt T., Kramer S., et. al.: Comparison of a T1-weighted inversion-recovery-, gradient-echo- and spin-echo sequence for imaging of the brain at 3.0 Tesla. Rofo 2005; 177: pp. 536-542.
18. Reimer P., Allkemper T., Schuierer G., et. al.: Brain imaging: Reduced sensitivity of RARE-derived techniques to susceptibility effects. J Comput Assist Tomogr 1996; 20: pp. 201-205.
19. Martin W.R.: Magnetic resonance imaging and spectroscopy in Parkinson’s disease. Adv Neurol 2001; 86: pp. 197-203.
20. Allkemper T., Schwindt W., Maintz D., et. al.: Sensitivity of T2-weighted FSE sequences towards physiological iron depositions in normal brains at 1.5 and 3.0 T. Eur Radiol 2004; 14: pp. 1000-1004.
21. Hoult D.I., Phil D.: Sensitivity and power deposition in a high-field imaging experiment. J Magn Reson Imaging 2000; 12: pp. 46-67.
22. Allkemper T., Tombach B., Schwindt W., et. al.: Acute and subacute intracerebral hemorrhages: Comparison of MR imaging at 1.5 and 3.0 T–initial experience. Radiology 2004; 232: pp. 874-881.
23. Sohn C.H., Baik S.K., Lee H.J., et. al.: MR imaging of hyperacute subarachnoid and intraventricular hemorrhage at 3T: A preliminary report of gradient echo T2*-weighted sequences. AJNR Am J Neuroradiol 2005; 26: pp. 662-665.
24. Kinoshita T., Okudera T., Tamura H., et. al.: Assessment of lacunar hemorrhage associated with hypertensive stroke by echo-planar gradient-echo T2*-weighted MRI. Stroke 2000; 31: pp. 1646-1650.
25. Horita Y., Imaizumi T., Niwa J., et. al.: [Analysis of dot-like hemosiderin spots using brain dock system]. No Shinkei Geka 2003; 31: pp. 263-267.
26. Jeerakathil T., Wolf P.A., Beiser A., et. al.: Cerebral microbleeds: Prevalence and associations with cardiovascular risk factors in the Framingham Study. Stroke 2004; 35: pp. 1831-1835.
27. Stehling C., Vieth V., Bachmann R., et. al.: High-resolution magnetic resonance imaging of the temporomandibular joint: Image quality at 1.5 and 3.0 Tesla in volunteers. Invest Radiol 2007; 42: pp. 428-434.
28. Molyneux P.D., Tubridy N., Parker G.J., et. al.: The effect of section thickness on MR lesion detection and quantification in multiple sclerosis. AJNR Am J Neuroradiol 1998; 19: pp. 1715-1720.
29. Hashemi R.H., Bradley W.G., Chen D.Y., et. al.: Suspected multiple sclerosis: MR imaging with a thin-section fast FLAIR pulse sequence. Radiology 1995; 196: pp. 505-510.
30. Bachmann R., Reilmann R., Schwindt W., et. al.: FLAIR imaging for multiple sclerosis: A comparative MR study at 1.5 and 3.0 Tesla. Eur Radiol 2006; 16: pp. 915-921.
31. Frayne R., Goodyear B.G., Dickhoff P., et. al.: Magnetic resonance imaging at 3.0 Tesla: Challenges and advantages in clinical neurological imaging. Invest Radiol 2003; 38: pp. 385-402.