
Rationale and Objectives
To determine the sensitivity of susceptibility-weighted imaging (SWI) for depicting hemorrhagic hypointense foci of the brain in comparison with gradient-recalled echo (GRE)- and GRE-type single-shot echo-planar imaging (GREI, GRE-EPI), and to assess the basic characteristics of the susceptibility effect by using a phantom.
Materials and Methods
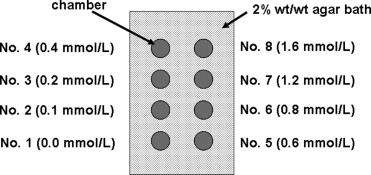
We prospectively examined 16 patients (9 males, 7 females, aged 10–74 years, mean 43 years) with hypointense foci using SWI, GREI, and GRE-EPI at a 1.5-T magnetic resonance (MR) unit. The contrast-to-noise ratio (CNR), sensitivity to small hypointese foci, and artifacts were evaluated. To assess the basic characteristics of SWI, we performed a phantom study using different concentrations of superparamagnetic iron oxide (SPIO).
Results
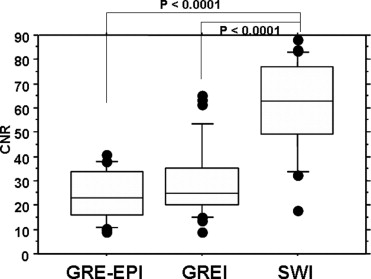
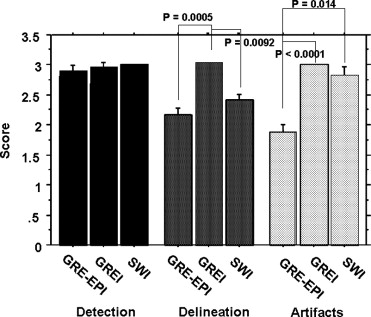
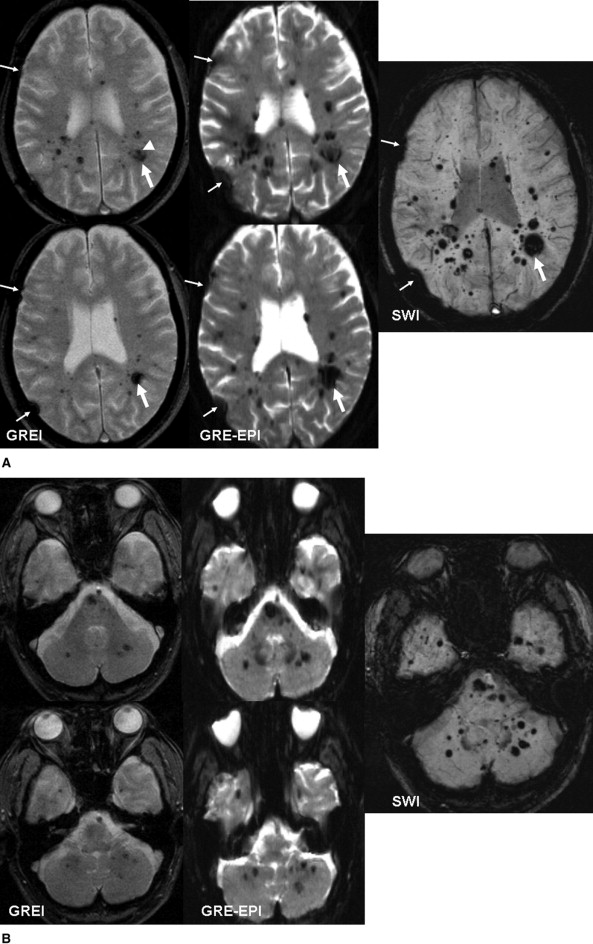
The CNR of lesions was significantly greater for SWI than the other images ( P < .0001). SWI detected the greatest number of small hypointense foci, even in the near-skull-base and infratentorial regions. Quantitative and qualitative analyses in our clinical and phantom studies demonstrated that the degree of artifacts was similar with SWI and GREI.
Conclusion
SWI was best for detecting small hemorrhagic hypointense foci. Artifacts of SWI were similar to GREI.
The detection of hemorrhage and its breakdown products is important for the diagnosis, management, and prognostic prediction for a variety of intracranial diseases ( ). Cerebral microhemorrhage may be a marker of cerebral small-vessel disease and cerebral amyloid angiopathy and might indicate a higher risk for future intracerebral hemorrhage after thrombolysis or the use of antithrombotic drugs ( ). The detection of hemorrhage on magnetic resonance (MR) images is useful for the grading of gliomas ( ). In patients with diffuse axonal injury, the presence of hemorrhage may result in a poor prognosis ( ).
Among various imaging techniques for depicting intracranial microhemorrhage, two-dimensional T2*-weighted gradient-recalled echo imaging (GREI) is considered a reliable technique ( ). In the detection of small hemorrhagic foci in the supratentorial white matter, however, GRE-type single-shot echo-planar imaging (GRE-EPI) may be more sensitive than GREI ( ).
Get Radiology Tree app to read full this article<
Get Radiology Tree app to read full this article<
Materials and methods
Clinical Study
Patients
Get Radiology Tree app to read full this article<
MR Imaging
Get Radiology Tree app to read full this article<
Table 1
Imaging Parameters of GREI, GRE-EPI, and SWI
GRE GRE-EPI SWI TR/TE/excitations 500/15/1 1000/46/1 56/40/1 Flip angle 15° 90° 25° Matrix 192 × 256 148 × 256 192 × 256 Field of view (mm) 200 × 265 200 × 265 200 × 265 Section thickness (mm) 5 5 10 ⁎ Slice gap (mm) 1 1 0 Acquisition type 2D 2D 3D Acquisition time 3 min, 27 s 4 s 4 min, 20 s
Note. SWI: susceptibility-weighted imaging, GREI: gradient-recalled echo imaging, GRE-EPI: GRE-type single-shot echo-planar imaging
Get Radiology Tree app to read full this article<
Get Radiology Tree app to read full this article<
Get Radiology Tree app to read full this article<
Get Radiology Tree app to read full this article<
Image Interpretation
Get Radiology Tree app to read full this article<
Quantitative Analysis
Get Radiology Tree app to read full this article<
Qualitative Analysis
Get Radiology Tree app to read full this article<
Get Radiology Tree app to read full this article<
Phantom Study
Get Radiology Tree app to read full this article<
Get Radiology Tree app to read full this article<
Quantitative Analysis
Get Radiology Tree app to read full this article<
Get Radiology Tree app to read full this article<
Get Radiology Tree app to read full this article<
Get Radiology Tree app to read full this article<
Qualitative Analysis
Get Radiology Tree app to read full this article<
Results
Clinical Study
Quantitative Analysis
Get Radiology Tree app to read full this article<
Get Radiology Tree app to read full this article<
Qualitative Analysis
Get Radiology Tree app to read full this article<
Get Radiology Tree app to read full this article<
Get Radiology Tree app to read full this article<
Table 2
Comparison of Number of Small Lesion (<5.0 mm) Detected by the Three Sequences
GREI GRE-EPI SWI Only by GREI Only by GRE-EPI Only by SWI Supratentorial 287 303 419 5 0 116 Near skull base 18 11 30 2 0 15 Infratentorial 28 25 51 2 0 28
Note. SWI: susceptibility-weighted imaging, GREI: gradient-recalled echo maging, GRE-EPI: GRE-type single-shot echo-planar imaging.
Get Radiology Tree app to read full this article<
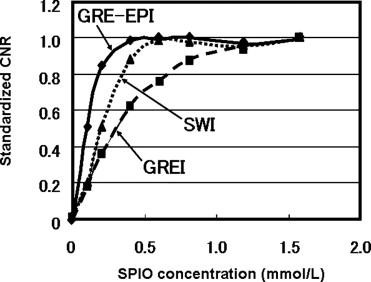
Phantom Study
Quantitative Analysis
Get Radiology Tree app to read full this article<
Get Radiology Tree app to read full this article<
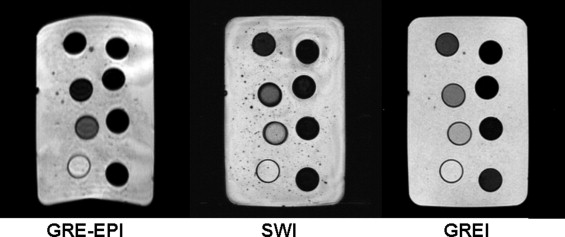
Qualitative Analysis
Get Radiology Tree app to read full this article<
Get Radiology Tree app to read full this article<
Get Radiology Tree app to read full this article<
Discussion
Get Radiology Tree app to read full this article<
Get Radiology Tree app to read full this article<
Get Radiology Tree app to read full this article<
Get Radiology Tree app to read full this article<
Get Radiology Tree app to read full this article<
Get Radiology Tree app to read full this article<
Get Radiology Tree app to read full this article<
Get Radiology Tree app to read full this article<
Conclusion
Get Radiology Tree app to read full this article<
References
1. Greenberg S., O’Donnell H., Schaefer P., et. al.: MRI detection of new hemorrhages: Potential marker of progression in cerebral amyloid angiopathy. Neurology 1999; 22: pp. 1135-1138.
2. Kidwell C.S., Saver J.L., Villablanca J.P., et. al.: Magnetic resonance imaging detection of microbleeds before thrombolysis: An emerging application. Stroke 2002; 33: pp. 95-98.
3. Nighoghossian N., Hermier M., Adeleine P., et. al.: Old microbleeds are a potential risk factor for cerebral bleeding after ischemic stroke. Stroke 2002; 33: pp. 735-742.
4. Koennecke H.C.: Cerebral microbleeds on MRI: Prevalence, associations, and potential clinical implications. Neurology 2006; 66: pp. 165-171.
5. Bagley L.J., Grossman R.I., Judy K.D., et. al.: Gliomas: Correlation of magnetic susceptibility artifact with histologic grade. Radiology 1997; 202: pp. 511-516.
6. Paterakis K., Karantanas A.H., Komnos A., Volikas Z.: Outcome of patients with diffuse axonal injury: The significance and prognostic value of MRI in the acute phase. J Trauma 2000; 49: pp. 1071-1075.
7. Atlas S.W., Mark A.S., Grossman R.I., et. al.: Intracranial hemorrhage: Gradient-echo MR imaging at 1.5 T. Radiology 1988; 168: pp. 803-807.
8. Seidenwurm D., Meng T.K., Kowalski H.K.: Intracranial hemorrhagic lesions: Evaluation with spin-echo and gradient-refocused MR imaging at 0.5 and 1.5 T. Radiology 1989; 172: pp. 189-194.
9. Liang L., Korogi Y., Sugahara T., et. al.: Detection of intracranial hemorrhage with susceptibility-weighted MR sequences. AJNR Am J Neuroradiol 1999; 20: pp. 1527-1534.
10. Reichenbach J.R., Venkatesan R., Schillinger D.J., et. al.: Small vessels in the human brain: MR venography with deoxyhemoglobin as an intrinsic contrast agent. Radiology 1997; 204: pp. 272-277.
11. Reichenbach J.R., Barth M., Haacke E.M., et. al.: High-resolution MR venography at 3.0 T. J Comput Assist Tomogr 2000; 24: pp. 949-957.
12. Lee B.C., Vo K.D., Kido D.K., et. al.: MR high-resolution blood oxygenation level dependent venography of occult (low-flow) vascular lesions. AJNR Am J Neuroradiol 1999; 20: pp. 1239-1242.
13. Tong K.A., Ashwal S., Holshouser B.A., et. al.: Hemorrhagic shearing lesions in children and adolescents with post traumatic diffuse axonal injury: Improved detection and initial results. Radiology 2003; 227: pp. 332-339.
14. Wycliffe N.D., Choe J., Holshouser B., et. al.: Reliability in detection of hemorrhage in acute stroke by a new three-dimensional gradient recalled echo susceptibility-weighted imaging technique compared to computed tomography: A retrospective study. J Magn Reson Imaging 2004; 20: pp. 372-377.
15. Sehgal V., Delproposto Z., Haacke E.M., et. al.: Susceptibility-weighted imaging to visualize blood products and improve tumor contrast in the study of brain masses. J Magn Reson Imaging 2006; 24: pp. 41-51.
16. Greer D.M., Koroshetz W.J., Cullen S., et. al.: Magnetic resonance imaging improves detection of intracerebral hemorrhage over computed tomography after intra-arterial thrombolysis. Stroke 2004; 35: pp. 491-495.
17. Sehgal V., Delproposto Z., Haacke E.M., et. al.: Clinical applications of neuroimaging with susceptibility-weighted imaging. J Magn Reson Imaging 2005; 22: pp. 439-450.
18. Gomori J.M., Grossman R.I.: Mechanisms responsible for the MR appearance and evolution of intracranial hemorrhage. Radiographics 1988; 8: pp. 427-440.
19. Kim J.K., Kucharczyk W., Henkelman R.M.: Cavernous hemangiomas: Dipolar susceptibility artifacts at MR imaging. Radiology 1993; 187: pp. 735-741.
20. Xu Y., Haacke E.: A new iterative phase correction method for segmented EPI to reduce image distortion.2005. abstract 290.
21. Trattnig S., Pinker K., Ba-Ssalamah A., Nobauer-Huhmann I.M.: The optimal use of contrast agents at high field MRI. Eur Radiol 2006; 16: pp. 1280-1287.
22. Henkelman M., Kucharczyk W.: Optimization of gradient-echo MR for calcium detection. AJNR Am J Neuroradiol 1994; 15: pp. 465-472.
23. Yamada M., Imakita S., Sakuma T.: Intracranial calcification on gradient-echo phase image: Depiction of diamagnetic susceptibility. Radiology 1996; 198: pp. 171-178.
24. Lin W., Mukherjee P., An H., et. al.: Improving high-resolution MR bold venographic imaging using a T1 reducing contrast agent. J Magn Reson Imaging 1999; 10: pp. 118-123.