
Rationale and Objectives
The purpose of this study was to compare the efficacy of dual-energy computed tomography (DECT), time-resolved magnetic resonance (MR) imaging (MRI) perfusion measurements, and high-resolution MR angiography (MRA) for the detection of pulmonary embolism (PE) in a rabbit model.
Materials and Methods
Two hours after Gelfoam ( n = 16) or saline ( n = 2) injection into the femoral vein, 18 rabbits were first imaged using dual-energy computed tomographic pulmonary angiography (CTPA), from which blood flow imaging (BFI) were produced. Next, the rabbits underwent time-resolved MR perfusion measurements and MRA using a 3.0-T scanner. Two radiologists who were blinded to histopathologic findings independently evaluated the results of CTPA, BFI, time-resolved MR perfusion, and MRA for each rabbit and recorded the locations and number of pulmonary clots on a per lobe basis. Immediately after MRI examination, pathologic determination of the locations and numbers of lung lobes with PE was recorded. Histopathologic results served as the reference standard to determine the sensitivity and specificity of DECT (BFI and CTPA) and MRI (time-resolved MR perfusion and high-resolution MRA) for the detection of PE.
Results
The induction of PE was successful in all animals, but three rabbits were excluded because of death prior to MRI procedures (caused by complications during the embolization procedure); only data from the remaining 15 rabbits were included in the final analysis. Histopathology demonstrated 24 lobes with clots and 51 lobes without clots. CTPA, BFI, and MRI correctly identified PE in 23, 23, and 20 lobes, respectively, and the absence of emboli in 48, 46, and 46 lobes, respectively; these results corresponded to sensitivities of 95.8%, 95.8%, and 83.3% and specificities of 94.1%, 90.2%, and 90.2% for reader 1 and sensitivities of 91.7%, 91.7%, and 87.5% and specificities of 90.2%, 88.2%, and 88.2% for reader 2 for CTPA, BFI, and MRI, respectively. Good or excellent intermodality and interreader agreement among CTPA, BFI, and MRI were found.
Conclusions
DECT can simultaneously provide high-resolution pulmonary artery and lung iodine mapping with slightly high diagnostic accuracy for the detection of PE compared to MRI in an experimental rabbit model of PE. This improvement was not statistically significant given the study sample size.
Pulmonary embolism (PE) is the third most common cause of cardiovascular death in the United States, with an annual incidence of 300,000 to 600,000 per year . Despite its high prevalence, PE is difficult to diagnose, with only 43 to 53 patients per 100,000 being accurately diagnosed and up to 70% of clinically unsuspected PE diagnosed at autopsy. Death occurs in up to 90% of patients with unrecognized PE, whereas in treated patients, PE accounts for <10% of deaths . The main reasons for this high rate of nondiagnosis are that the clinical signs and symptoms of PE are not specific to the condition and that the presentation is variable.
Imaging plays a crucial role in the diagnosis of PE. Currently, multidetector computed tomographic (CT) pulmonary angiography (CTPA) has largely replaced lung scintigraphy and conventional pulmonary angiography for the assessment of possible PE; in 2007, CTPA was accepted as the reference standard for the diagnosis of acute PE . In contrast to single-source computed tomography, dual-source CT scanners, with two orthogonally mounted detectors and tube arrays operating simultaneously at different tube potentials (80 and 140 kVp), allow for the performance of dual-energy computed tomography (DECT) with minimal patient motion registration artifacts . Contrast-enhanced lung DECT can simultaneously provide both lung anatomic (including lung parenchyma and vessels) and functional information, opening new horizons in the imaging of acute pulmonary thromboembolism ( ).
Get Radiology Tree app to read full this article<
Get Radiology Tree app to read full this article<
Materials and methods
Animal Model
Get Radiology Tree app to read full this article<
Scan Protocols
Get Radiology Tree app to read full this article<
Image Reconstruction and Analysis
Get Radiology Tree app to read full this article<
Get Radiology Tree app to read full this article<
Time-resolved MR Perfusion and MRA
Get Radiology Tree app to read full this article<
Get Radiology Tree app to read full this article<
Pathologic Processing
Get Radiology Tree app to read full this article<
Statistical Analysis
Get Radiology Tree app to read full this article<
Results
Get Radiology Tree app to read full this article<
Table 1
Lobar Location of Pulmonary Emboli as Determined by DECT, MRI, and Histopathology
Right Lung Left Lung Reader Modality Upper Middle Lower Upper Lower Overall 1 CTPA 0 2 (1 ∗ ) 10 (1 ∗ , 1 † ) 1 13 (1 ∗ ) 26 BFI 0 4 (3 ∗ ) 10 (1 ∗ , 1 † ) 1 13 (1 ∗ ) 28 DECT 0 2 (1 ∗ ) 10 (1 ∗ , 1 † ) 1 13 (1 ∗ ) 26 MRA 0 1 (1 ∗ , 1 † ) 10 (2 ∗ , 2 † ) 0 (1 † ) 14 (2 ∗ ) 25 2 CTPA 0 4 (3 ∗ ) 10 (1 ∗ , 1 † ) 0 (1 † ) 13 (1 ∗ ) 27 BFI 0 5 (4 ∗ ) 10 (1 ∗ , 1 † ) 0 (1 † ) 13 (1 ∗ ) 28 DECT 0 4 (3 ∗ ) 10 (1 ∗ , 1 † ) 0 (1 † ) 13 (1 ∗ ) 27 MRA 0 2 (2 ∗ , 1 † ) 11 (2 ∗ , 1 † ) 0 (1 † ) 14 (2 ∗ ) 27 Pathology 0 1 10 1 12 24
BFI, blood flow imaging; CTPA, computed tomographic pulmonary angiography; DECT, dual-energy computed tomography; MRA, magnetic resonance angiography.
Get Radiology Tree app to read full this article<
Get Radiology Tree app to read full this article<
Get Radiology Tree app to read full this article<
DECT
Get Radiology Tree app to read full this article<
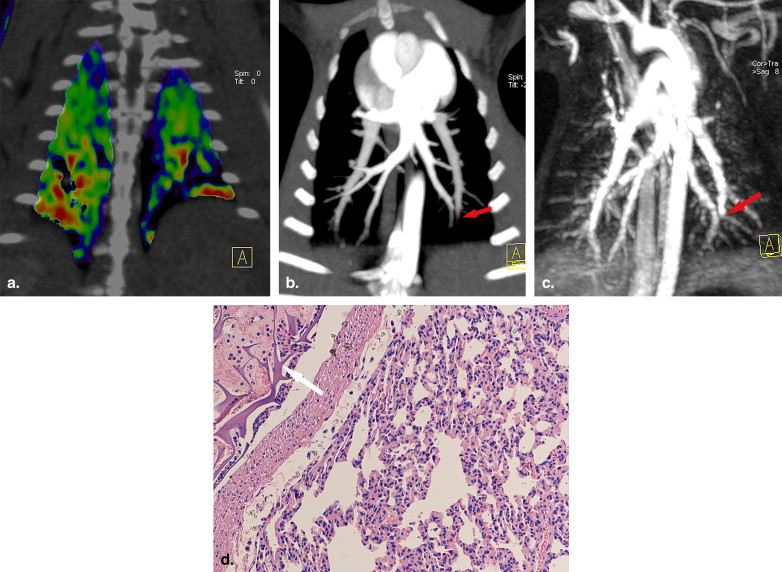
![Figure 2, True-positive pulmonary embolism case demonstrated by histopathology (rabbit 11). (a, b) Coronal blood flow images (BFIs) show decreased lung perfusion color coded as blue in the bilateral lower lobes (ovals). (c) Sagittal BFI shows decreased lung perfusion color coded as blue in the right lower lobe (oval). (d) Computed tomographic pulmonary angiography with maximum-intensity projection reformation with slice thickness of 5 mm showing the termination of contrast-filled lumen of the left lower pulmonary artery (yellow arrow) and decreased enhancement of the right lower pulmonary artery (red arrow). Note that the enhancement of the distal right lower pulmonary artery disappeared (arrowhead). (e) Magnetic resonance (MR) angiography shows the enhancement cutoff of the bilateral lower pulmonary arteries (arrows). (f) Time-resolved MR perfusion measurements showing the perfusion defect in the left lower lobe (oval). Photomicrograph showing the gelatin sponge (arrow) in the (g) right (hematoxylin and eosin [H&E] staining, original magnification), (h) right (H&E staining, original magnification, 400×), and (i) left (H&E staining, original magnification, 400×) lower pulmonary arteries.](https://storage.googleapis.com/dl.dentistrykey.com/clinical/DetectionofPulmonaryEmbolism/1_1s20S1076633210005131.jpg)
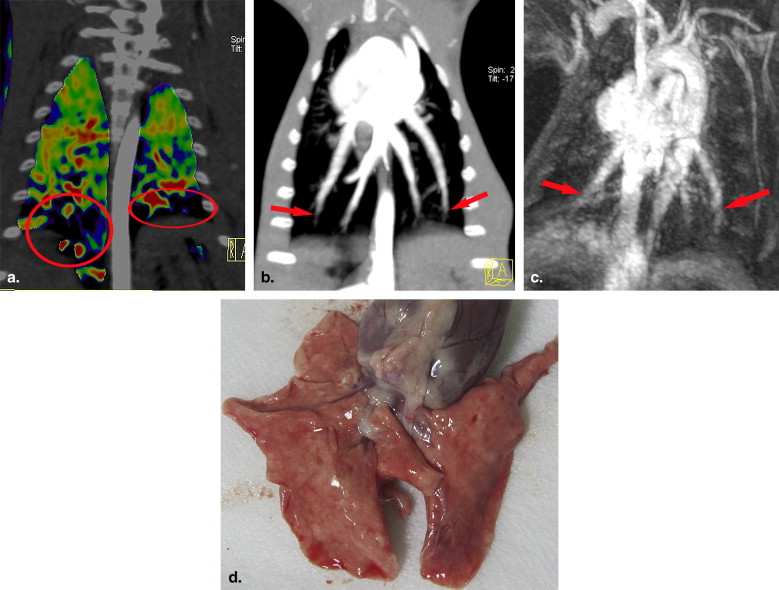
Table 2
Accuracy of DECT and MRI for the Detection of Pulmonary Embolism
Results (n) Statistical Analysis (%) Reader Modality TP TN FP FN Sensitivity Specificity PPV NPV Accuracy 1 CTPA 23 48 3 1 95.8 (23/24) 94.1 (48/51) 88.5 (23/26) 98.0 (48/49) 94.7 (71/75) BFI 23 46 5 1 95.8 (23/24) 90.2 (46/51) 82.1 (23/28) 97.9 (46/47) 92.0 (69/75) DECT 23 48 3 1 95.8 (23/24) 94.1 (48/51) 88.5 (23/26) 98.0 (48/49) 94.7 (71/75) MRA 20 46 5 4 83.3 (20/24) 90.2 (46/51) 80.0 (20/25) 92.0 (46/50) 88.0 (66/75) 2 CTPA 22 46 5 2 91.7 (22/24) 90.2 (46/51) 81.5 (22/27) 95.8 (46/48) 90.7 (68/75) BFI 22 45 6 2 91.7 (22/24) 88.2 (45/51) 78.6 (22/28) 95.7 (45/47) 89.3 (67/75) DECT 22 46 5 2 91.7 (22/24) 90.2 (46/51) 81.5 (22/27) 95.8 (46/48) 90.7 (68/75) MRA 21 45 6 3 87.5 (21/24) 88.2 (45/51) 77.8 (21/27) 93.8 (45/48) 88.0 (66/75)
BFI, blood flow imaging; CTPA, computed tomographic pulmonary angiography; DECT, dual-energy computed tomography; FN, false-negative; FP, false-positive; MRA, magnetic resonance angiography; NPV, negative predictive value; PPV, positive predictive value; TN, true-negative; TP, true-positive.
Get Radiology Tree app to read full this article<
MRI
Get Radiology Tree app to read full this article<
Get Radiology Tree app to read full this article<
Discussion
Get Radiology Tree app to read full this article<
Get Radiology Tree app to read full this article<
Get Radiology Tree app to read full this article<
Get Radiology Tree app to read full this article<
Conclusions
Get Radiology Tree app to read full this article<
Acknowledgment
Get Radiology Tree app to read full this article<
Get Radiology Tree app to read full this article<
References
1. Kuriakose J., Patel S.: Acute pulmonary embolism. Radiol Clin N Am 2010; 48: pp. 31-50.
2. Tapson V.F.: Acute pulmonary embolism. N Engl J Med 2008; 358: pp. 1037-1052.
3. Remy-Jardin M., Pistolesi M., Goodman L.R., et. al.: Management of suspected acute pulmonary embolism in the era of CT angiography: a statement from the Fleischner Society. Radiology 2007; 245: pp. 315-329.
4. Johnson T.R., Krauss B., Sedlmair M., et. al.: Material differentiation by dual energy CT: initial experience. Eur Radiol 2007; 17: pp. 1510-1517.
5. Remy-Jardin M., Faivre J.B., Pontana F., et. al.: Thoracic applications of dual energy. Radiol Clin North Am 2010; 48: pp. 193-205.
6. Zhang L.J., Zhao Y.E., Wu S.Y., et. al.: Pulmonary embolism detection with dual-energy CT: experimental study of dual-source CT in rabbits. Radiology 2009; 252: pp. 61-70.
7. Zhang L.J., Chai X., Wu S.Y., et. al.: Detection of pulmonary embolism by dual energy CT: correlation with perfusion scintigraphy and histopathological findings in rabbits. Eur Radiol 2009; 19: pp. 1844-1854.
8. Ferda J, Ferdová E, Mírka H, et al. Pulmonary imaging using dual-energy CT, a role of the assessment of iodine and air distribution. Eur J Radiol. In press.
9. Zhang L.J., Yang G.F., Zhao Y.E., et. al.: Detection of pulmonary embolism using dual-energy computed tomography and correlation with cardiovascular measurements: a preliminary study. Acta Radiol 2009; 50: pp. 892-901.
10. Thieme S.F., Johnson T.R., Lee C., et. al.: Dual-energy CT for the assessment of contrast material distribution in the pulmonary parenchyma. AJR Am J Roentgenol 2009; 193: pp. 144-149.
11. Hoey E.T., Gopalan D., Screaton N.J.: Dual-energy CT pulmonary angiography: a new horizon in the imaging of acute pulmonary thromboembolism. AJR Am J Roentgenol 2009; 192: pp. W341-W342.
12. Hoey E.T., Gopalan D., Ganesh V., et. al.: Dual-energy CT pulmonary angiography: a novel technique for assessing acute and chronic pulmonary thromboembolism. Clin Radiol 2009; 64: pp. 414-419.
13. Fink C., Johnson T.R., Michaely H.J., et. al.: Dual-energy CT angiography of the lung in patients with suspected pulmonary embolism: initial results. Rofo 2008; 180: pp. 879-883.
14. Pontana F., Faivre J.B., Remy-Jardin M., et. al.: Lung perfusion with dual-energy multidetector-row CT (MDCT): feasibility for the evaluation of acute pulmonary embolism in 117 consecutive patients. Acad Radiol 2008; 15: pp. 1494-1504.
15. Chae E.J., Seo J.B., Jang Y.M., et. al.: Dual-energy CT for assessment of the severity of acute pulmonary embolism: pulmonary perfusion defect score compared with CT angiographic obstruction score and right ventricular/left ventricular diameter ratio. AJR Am J Roentgenol 2010; 194: pp. 604-610.
16. Meaney J.F., Weg J.G., Chenevert T.L., et. al.: Diagnosis of pulmonary embolism with magnetic resonance angiography. N Engl J Med 1997; 336: pp. 1422-1427.
17. Oudkerk M., van Beek E.J., Wielopolski P., et. al.: Comparison of contrast-enhanced magnetic resonance angiography and conventional pulmonary angiography for the diagnosis of pulmonary embolism: a prospective study. Lancet 2002; 359: pp. 1643-1647.
18. Ohno Y., Higashino T., Takenaka D., et. al.: MR angiography with sensitivity encoding (SENSE) for suspected pulmonary embolism: comparison with MDCT and ventilation-perfusion scintigraphy. AJR Am J Roentgenol 2004; 183: pp. 91-98.
19. Mata J.F., Bozlar U., Mugler J.P., et. al.: Time-resolved and high-resolution MRA in a rabbit model of pulmonary embolism at 7 T: preliminary results. Magn Reson Imaging 2010; 28: pp. 139-145.
20. Fink C., Ley S., Puderbach M., Plathow C., et. al.: 3D pulmonary perfusion MRI and MR angiography of pulmonary embolism in pigs after a single injection of a blood pool MR contrast agent. Eur Radiol 2004; 14: pp. 1291-1296.
21. Gupta A., Frazer C.K., Ferguson J.M., et. al.: Acute pulmonary embolism: diagnosis with MR angiography. Radiology 1999; 210: pp. 353-359.
22. Kluge A., Luboldt W., Bachmann G.: Acute pulmonary embolism to the subsegmental level: diagnostic accuracy of three MRI techniques compared with 16-MDCT. AJR Am J Roentgenol 2006; 187: pp. W7-W14.
23. Pleszewski B., Chartrand-Lefebvre C., Qanadli S.D., et. al.: Gadolinium-enhanced pulmonary magnetic resonance angiography in the diagnosis of acute pulmonary embolism: a prospective study on 48 patients. Clin Imaging 2006; 30: pp. 166-172.
24. Stein P.D., Chenevert T.L., Fowler S.E., et. al.: PIOPED III (Prospective Investigation of Pulmonary Embolism Diagnosis III) Investigators. Gadolinium-enhanced magnetic resonance angiography for pulmonary embolism: a multicenter prospective study (PIOPED III). Ann Intern Med 2010; 152: pp. 434-443.
25. Davidson B.L., Lacrampe M.J.: Why can’t magnetic resonance imaging reliably diagnose pulmonary embolism?. Ann Intern Med 2010; 152: pp. 467-468.
26. Fink C., Ley S., Schoenberg S.O., et. al.: Magnetic resonance imaging of acute pulmonary embolism. Eur Radiol 2007; 17: pp. 2546-2553.
27. Keilholz S.D., Bozlar U., Fujiwara N., et. al.: MR diagnosis of a pulmonary embolism: comparison of P792 and Gd-DOTA for first-pass perfusion MRI and contrast-enhanced 3D MRA in a rabbit model. Korean J Radiol 2009; 10: pp. 447-454.