
Rationale and Objectives
The aim of this study was to develop a new tool for the early detection of inflammatory joint diseases using fluorescence imaging in the near-infrared (NIR) spectral range following the intravenous administration of an unspecific contrast agent.
Materials and Methods
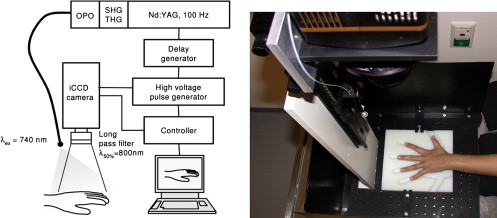
A laser-supported system for fluorescence imaging of finger joints was designed and constructed. Five patients and a corresponding number of volunteers were examined using 0.1 mg/kg by weight of indocyanine green as an unspecific contrast agent. Fluorescence images were acquired continuously over a period of 15 minutes. As a control, 1 day before optical imaging, all patients and volunteers underwent contrast-enhanced magnetic resonance imaging (MRI) at 0.2 T. On the basis of MRI findings, all examined joints were divided into four groups: no change and mild, moderate, and severe synovitis. The emitted fluorescence photons were quantified in different regions of interest covering the finger joints and finger tips. The normalized fluorescence intensity of contrast agents was compared with MRI findings as a proven standard.
Results
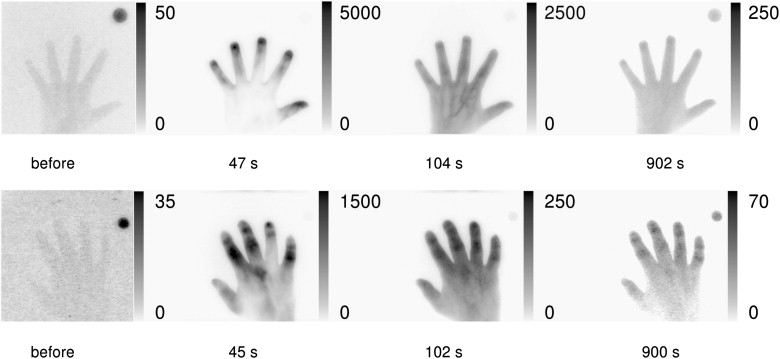
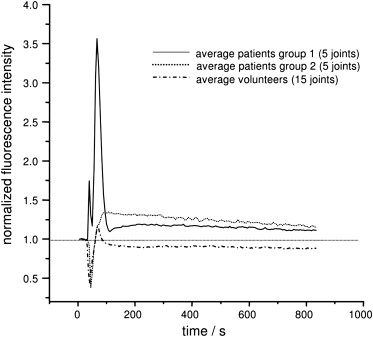
NIR dyes of the cyanine class are enriched in inflammatory joints and show a different kinetic behavior compared to normal joints after bolus injection. These findings demonstrate clearly the capability of contrast-enhanced fluorescence imaging to detect early changes caused by rheumatoid arthritis in finger joints. The NIR results were correlated with MRI findings ( r = 0.84).
Conclusion
Contrast-enhanced fluorescence imaging provides adequate information for the evaluation of inflammatory involvement of finger joints comparable to low-field MRI.
The early identification of destructive proliferative synovitis in inflammatory joint diseases is crucial for both prognosis and treatment strategy for rheumatoid arthritis. However, a major disadvantage of conventional radiography, the current standard of reference for the diagnosis of this disease, is its lack of sensitivity in detecting early changes . Regrettably, many patients develop joint damage within the first year of disease . Typically, it affects the small joints first, including the joints of the hands and feet. More than one joint is usually affected, and symptoms often appear bilaterally. Precise validation is crucial for treatment efficacy and predicts the success of therapy.
Over the past decade, there has been increasing interest in optical imaging techniques. Only little attention, however, has been paid to developing near-infrared (NIR) imaging techniques focused on the detection of rheumatoid arthritis. In an initial approach , changes in the scattering of light transmitted through finger joints were proposed to monitor early stages of this disease. This approach was evaluated in a clinical study of patients with rheumatoid arthritis . The investigators found that it is not yet possible to definitely distinguish between a healthy and an inflamed joint in different individuals by laser imaging on the basis of changes in scattering. Optical tomography has been applied to improve the differentiation between healthy and inflamed joints . The classification problem of rheumatic arthritis in finger joints was investigated recently by Klose et al using all possible combinations of absorption (μ a ) and scattering (μ′ s ) values. Receiver-operating characteristic curve analysis for the best fit yielded an area under the curve of 0.72. These techniques without contrast enhancement are still time consuming and therefore not suited for routine application.
Get Radiology Tree app to read full this article<
Get Radiology Tree app to read full this article<
Materials and methods
Study Design and Patients
Get Radiology Tree app to read full this article<
Get Radiology Tree app to read full this article<
Classification of Patients by Clinical Parameters
Get Radiology Tree app to read full this article<
Get Radiology Tree app to read full this article<
MRI Protocol
Get Radiology Tree app to read full this article<
Table 1
MRI Protocol
Parameters of the 0.2-T MRI Sequences Used Sequence TR (ms) TE (ms) TI (ms) Flip Angle (°) In-Plane Resolution (2 mm) Slice Thickness (mm) Slice Gap (mm) FOV (mm) Matrix Size Time (min:s) GE-STIR (sagittal; native) 700 16 75 90 1.13 × 0.54 3 0.3 180 256 × 192 5:19 T1 SE (sagittal; native and postcontrast) 520 26 90 0.56 × 0.56 3.5 0.3 180 320 × 512 5:35 T1 GRE (sagittal; native and postcontrast) 35 16 65 0.83 × 0.83 0.86 0 160 192 × 256 8:00
FOV, field of view; GE-STIR, gradient-recalled echo short-tau inversion-recovery; MRI, magnetic resonance imaging; TE, echo time; TI, inversion time; T1 GRE, T1-weighted gradient-recalled echo; T1 SE, T1-weighted spin-echo; TR, repetition time.
Get Radiology Tree app to read full this article<
NIR Fluorescence Protocol
Get Radiology Tree app to read full this article<
Get Radiology Tree app to read full this article<
Statistical Analysis
Get Radiology Tree app to read full this article<
Results
Clinical Parameters
Get Radiology Tree app to read full this article<
Get Radiology Tree app to read full this article<
Get Radiology Tree app to read full this article<
Table 2
Clinical Parameters
Healthy Volunteers Patients CRP (mg/dL) ESR (mm) Diagnosis CRP (mg/dL) ESR (mm) DAS28 0.2 10 PA 4 25 ND 0.5 5 RA 2 10 3.2 0.5 10 RA 6 30 6.2 0.4 5 RA 7 40 5.1 0.5 5 RA 10 35 5.1 Mean 0.4 7 5.8 28 4.9 SD 0.1 2.7 3 11.5 1.2
CRP, C-reactive protein; DAS28, Disease Activity Score using 28 joint counts; ESR, erythrocyte sedimentation rate; ND, not determined; PA, psoriatic arthritis; RA, rheumatoid arthritis; SD, standard deviation.
Get Radiology Tree app to read full this article<
Get Radiology Tree app to read full this article<
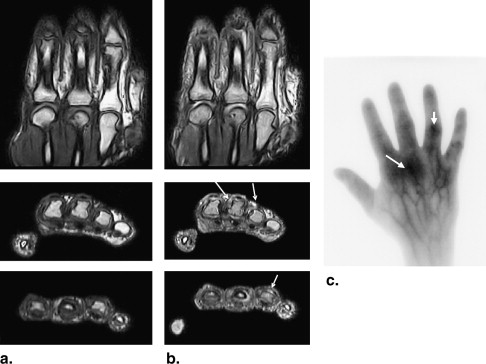
MRI
Get Radiology Tree app to read full this article<
Table 3
MRI Scores
Side MCP1 IP1 MCP2 PIP2 DIP2 MCP3 PIP3 DIP3 MCP4 PIP4 DIP4 MCP5 PIP5 DIP5 Patients Right 2 2 2 2 1 2 3 1 2 2 2 2 2 2 Right 0 1 1 1 0 2 2 0 1 1 0 1 1 0 Right 0 0 1 0 0 0 3 0 2 0 0 0 3 0 Left 1 1 2 2 1 2 2 1 2 3 0 1 3 0 Right 0 0 1 3 0 2 3 0 1 0 0 2 2 2 Volunteers Right 0 0 1 1 0 0 1 0 0 0 0 0 0 0 Left 0 0 0 0 0 0 0 0 0 0 0 0 0 0 Right 0 0 0 0 0 0 0 0 0 0 0 0 0 0 Left 0 0 0 0 0 0 0 0 0 0 0 0 0 0 Right 0 0 0 1 0 0 0 0 0 0 0 1 0 0
DIP, distal interphalangeal; IP, interphalangeal; MCP, metacarpophalangeal; MRI, magnetic resonance imaging; PIP, proximal interphalangeal.
The total score for patients was 82. Altogether, 47 of 70 investigated joints were involved. The volunteers showed a total score of 5 (ie, five of 70 joints were evaluated with scores of 1). The difference between these two groups was statistically significant ( P < .05).
Get Radiology Tree app to read full this article<
NIR Fluorescence
Get Radiology Tree app to read full this article<
Get Radiology Tree app to read full this article<
Get Radiology Tree app to read full this article<
Table 4
NIR Fluorescence Scores
Side MCP1 IP1 MCP2 PIP2 DIP2 MCP3 PIP3 DIP3 MCP4 PIP4 DIP4 MCP5 PIP5 DIP5 Patients Right 1 2 2 2 1 3 3 1 2 3 2 2 2 1 Right 1 1 1 1 0 3 2 0 1 1 0 1 1 0 Right 0 0 1 0 0 0 3 0 1 1 0 0 2 0 Left 1 1 2 2 1 1 2 0 1 2 0 1 2 0 Right 1 1 1 3 1 2 3 2 1 0 1 1 3 1 Volunteers Right 0 0 1 0 0 0 1 0 0 0 0 1 0 0 Left 0 0 0 0 1 0 0 1 0 0 0 0 0 0 Right 0 0 0 0 0 0 0 0 0 0 0 0 0 0 Left 0 0 0 0 0 0 0 0 0 0 0 0 0 0 Right 0 0 0 1 1 0 1 0 0 0 0 0 0 0
DIP, distal interphalangeal; IP, interphalangeal; MCP, metacarpophalangeal; NIR, near-infrared; PIP, proximal interphalangeal.
The total score for patients was 85. Altogether, 47 of 70 investigated joints were involved. Taking only scores of 2 and 3 into account, 24 of 70 joints were clearly involved. The volunteers showed a total score of 8 (ie, eigh of 70 joints were evaluated with scores of 1). The difference between these two groups was statistically significant ( P < .05).
Get Radiology Tree app to read full this article<
Get Radiology Tree app to read full this article<
Get Radiology Tree app to read full this article<
Get Radiology Tree app to read full this article<
Get Radiology Tree app to read full this article<
Discussion
Get Radiology Tree app to read full this article<
Get Radiology Tree app to read full this article<
Get Radiology Tree app to read full this article<
Get Radiology Tree app to read full this article<
Get Radiology Tree app to read full this article<
Get Radiology Tree app to read full this article<
Get Radiology Tree app to read full this article<
Get Radiology Tree app to read full this article<
Get Radiology Tree app to read full this article<
References
1. Backhaus M., Kamradt T., Sandrock D., et. al.: Arthritis of the finger joints: a comprehensive approach comparing conventional radiography, scintigraphy, ultrasound, and contrast-enhanced magnetic resonance imaging. Arthritis Rheum 1999; 42: pp. 1232-1245.
2. Mohr W.: The pathogenesis of joint destruction in chronic polyarthritis [article in German]. Radiologe 1996; 36: pp. 593-599.
3. St Clair EW : Therapy of rheumatoid arthritis: new developments and trends. Curr Rheumatol Rep 1999; 1: pp. 149-156.
4. Prapavat V., Runge W., Mans J., et. al.: Entwicklung eines Fingergelenkphantomes zur optischen Simulation früher entzündlich-rheumatischer Veränderungen. Biomed Technik 1997; 42: pp. 319-326.
5. Scheel A.K., Krause A., Rheinbaben I.M., et. al.: Assessment of proximal finger joint inflammation in patients with rheumatoid arthritis, using a novel laser-based imaging technique. Arthritis Rheum 2002; 46: pp. 1177-1184.
6. Hielscher A.H., Klose A.D., Scheel A.K., et. al.: Sagittal laser optical tomography for imaging of rheumatoid finger joints. Phys Med Biol 2004; 49: pp. 1147-1163.
7. Scheel A.K., Backhaus M., Klose A.D., et. al.: First clinical evaluation of sagittal laser optical tomography for detection of synovitis in arthritic finger joints. Ann Rheum Dis 2005; 64: pp. 239-245.
8. Klose C.D., Klose A.D., Netz U., et. al.: Multiparameter classifications of optical tomographic images. J Biomed Opt 2008; pp. 13. 050503
9. Canvin J.M., Bernatsky S., Hitchon C.A., et. al.: Infrared spectroscopy: shedding light on synovitis in patients with rheumatoid arthritis. Rheumatology (Oxford) 2003; 42: pp. 76-82.
10. Hansch A., Frey O., Sauner D., et. al.: In vivo imaging of experimental arthritis with near-infrared fluorescence. Arthritis Rheum 2004; 50: pp. 961-967.
11. Hansch A., Frey O., Hilger I., et. al.: Diagnosis of arthritis using near-infrared fluorochrome Cy5.5. Invest Radiol 2004; 39: pp. 626-632.
12. Chen W.T., Mahmood U., Weissleder R., et. al.: Arthritis imaging using a near-infrared fluorescence folate-targeted probe. Arthritis Res Ther 2005; 7: pp. R310-R317.
13. Simon G.H., Daldrup-Link H.E., Kau J., et. al.: Optical imaging of experimental arthritis using allogeneic leukocytes labeled with a near-infrared fluorescent probe. Eur J Nucl Med Mol Imaging 2006; 33: pp. 998-1006.
14. Fischer T., Gemeinhardt I., Wagner S., et. al.: Assessment of unspecific near-infrared dyes in laser-induced fluorescence imaging of experimental arthritis. Acad Radiol 2006; 13: pp. 4-13.
15. Pogue B.W.: Near-infrared characterization of disease via vascular permeability probes. Acad Radiol 2006; 13: pp. 1-3.
16. Becker A., Riefke B., Ebert B., et. al.: Macromolecular contrast agents for optical imaging of tumors: comparison of indotricarbocyanine-labeled human serum albumin and transferrin. Photochem Photobiol 2000; 72: pp. 234-241.
17. Ebert B., Sukowski U., Grosenick D., et. al.: Near-infrared fluorescent dyes for enhanced contrast in optical mammography: phantom experiments. J Biomed Opt 2001; 6: pp. 134-140.
18. OMERACT. Home page. Available at: http://www.omeract.org . Accessed October 27, 2009.
19. Østergaard M., Peterfy C., Conaghan P., et. al.: OMERACT Rheumatoid Arthritis Magnetic Resonance Imaging Studies. Core set of MRI acquisitions, joint pathology definitions, and the OMERACT RA-MRI scoring system. J Rheumatol 2003; 30: pp. 1385-1386.
20. Conaghan P., Bird P., Ejbjerg B., et. al.: The EULAR-OMERACT rheumatoid arthritis MRI reference image atlas: the metacarpophalangeal joints. Ann Rheum Dis 2005; 64: pp. i11-i21.
21. Stangenberg L., Ellson C., Cortez-Retamozo V., et. al.: Abrogation of antibody-induced arthritis in mice by a self-activating viridin prodrug and association with impaired neutrophil and endothelial cell function. Arthritis Rheum 2009; 60: pp. 2314-2324.
22. Miller E., Roposch A., Uleryk E., et. al.: Juvenile idiopathic arthritis of peripheral joints: quality of reporting of diagnostic accuracy of conventional MRI. Acad Radiol 2009; 16: pp. 739-757.