
Rationale and Objectives
The aim of this study was to determine the optimal weighting factor (WF) for precise quantification using six-point interference Dixon fat percentage imaging by analyzing changes in WFs of fatty acid metabolites (FMs) in high-fat-induced fatty liver disease rat model.
Materials and Methods
Individual FM-related WFs were calculated based on concentration ratios of integrated areas of seven peak FMs with four phantom series. Ten 8-week-old male Sprague-Dawley rats were used for baseline quantification of fat in liver magnetic resonance imaging or magnetic resonance spectroscopy data. These seven lipid metabolites were then quantitatively analyzed. Spearman test was used for correlation analysis of different lipid proton concentrations. The most accurate WF for six-point interference Dixon fat percentage imaging was then determined.
Results
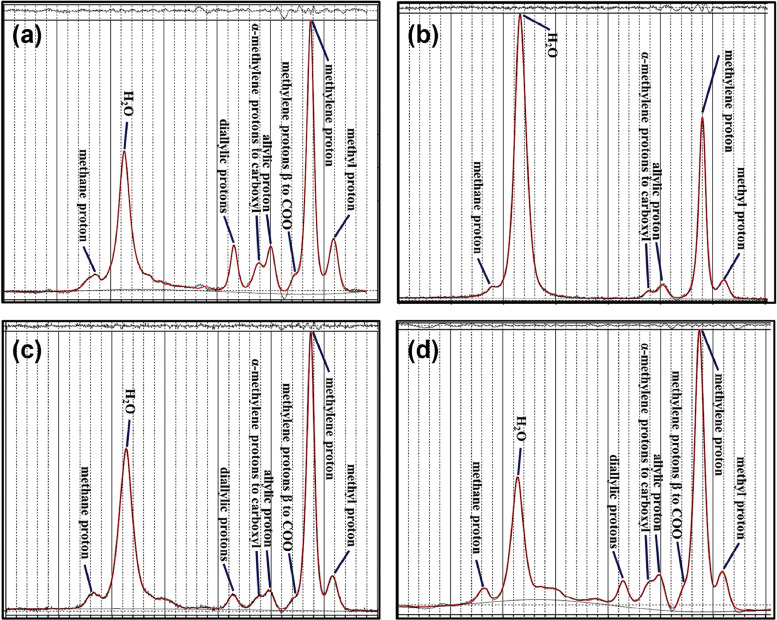
The seven lipid resonance WF values obtained from magnetic resonance spectroscopy data for three different oils (oleic, linoleic, and soybean) were different from each other. In lipid phantoms, except for the phantom containing oleic acid, changes in FP values were significantly different when WFs were changed in six-point interference Dixon fat percentage image. The seven lipid resonance WF values for the nonalcoholic fatty liver animal model were different from human subcutaneous adipose tissue lipid WF values.
Conclusions
WF affected the calculation of six-point interference Dixon-based fat percentage imaging value in phantom experiment. If WF of liver parenchyma FM which is specific to each liver disease is applied, the accuracy of six-point interference Dixon fat percentage imaging can be further increased.
Introduction
Hepatic steatosis is a common disease that affects nearly 30% of the world’s adult population . It can progress to liver fibrosis over time. It frequently causes liver cirrhosis or hepatic cellular carcinoma . Furthermore, transplantation of a moderately fatty liver can increase the risk of liver failure, making the evaluation of a donor’s liver fat deposition extremely important .
Although liver biopsy is considered the most reliable procedure for evaluating fatty liver, it cannot be repeatedly done as it is an invasive examination with limitations such as potential for sampling error and interobserver variations . As a result, noninvasive methods are increasingly used for the evaluation of fatty liver. Among those techniques, the use of ultrasound scan also has disadvantages because it is highly sonographer-dependent without providing quantitative results .
Get Radiology Tree app to read full this article<
Get Radiology Tree app to read full this article<
Get Radiology Tree app to read full this article<
Materials and Methods
Phantom Experiment and Magnetic Resonance Imaging (MRI)/Proton Magnetic Resonance Spectroscopy ( 1 H MRS) Acquisition
Get Radiology Tree app to read full this article<
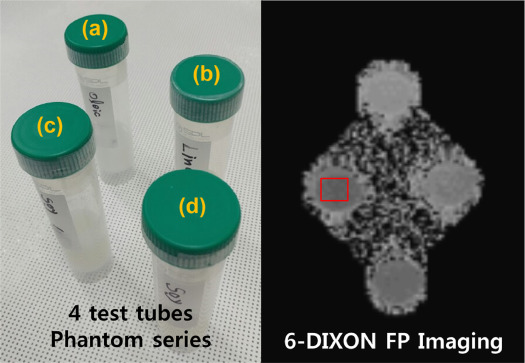
Get Radiology Tree app to read full this article<
WF Calculation From Phantom Series MRS Data
Get Radiology Tree app to read full this article<
IndividualFMweightingfactor=appropriatelipidprotonconcentration7peaklipidprotonsintergratedareas. Individual
FM
weighting
factor
=
appropriate
lipid
proton
concentration
7
peak
lipid
protons
intergrated
areas
.
Get Radiology Tree app to read full this article<
Get Radiology Tree app to read full this article<
Various WFs for Six-point Interference Dixon Fat Percentage Image Acquisition and Analysis
Get Radiology Tree app to read full this article<
|Sn|=∣∣(Mw+CnMf)⋅e−R∗2effTEn∣∣. |
S
n
|
=
|
(
M
w
+
C
n
M
f
)
·
e
−
R
2
e
f
f
*
T
E
n
|
.
Get Radiology Tree app to read full this article<
Get Radiology Tree app to read full this article<
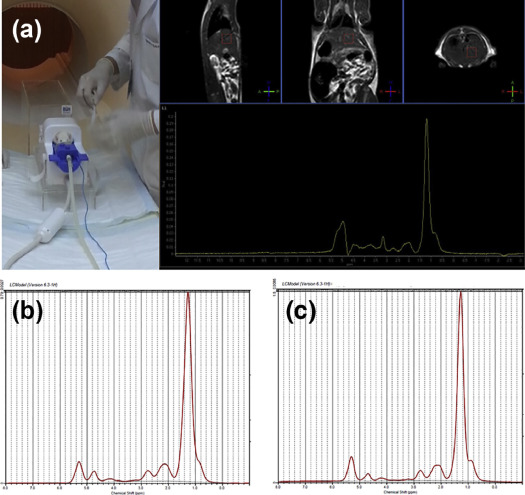
High-Fat Diet Fatty Liver Rat Model MRS Experimental Protocol and Analysis
Get Radiology Tree app to read full this article<
Results
WF Calculation According to Phantom MRS Data and Six-point Interference Dixon Fat Percentage Imaging Experiment
Get Radiology Tree app to read full this article<
TABLE 1
The Weighting Factor (WF) Values of Each Lipid Proton as the Fatty Acid Phantom Magnetic Resonance Spectroscopy Data
0.9 ppm 1.3 ppm 1.6 ppm 2.03 ppm 2.25 ppm 2.77 ppm 5.3 ppm WF ref 0.082 0.627 0.071 0.095 0.065 0.015 0.041 WF 1 0.0847 0.773 0.000 0.069 0.036 0.000 0.034 WF 2 0.126 0.549 0.022 0.088 0.077 0.092 0.043 WF 3 0.094 0.653 0.025 0.053 0.067 0.059 0.045 WF 4 0.097 0.643 0.029 0.058 0.075 0.061 0.034
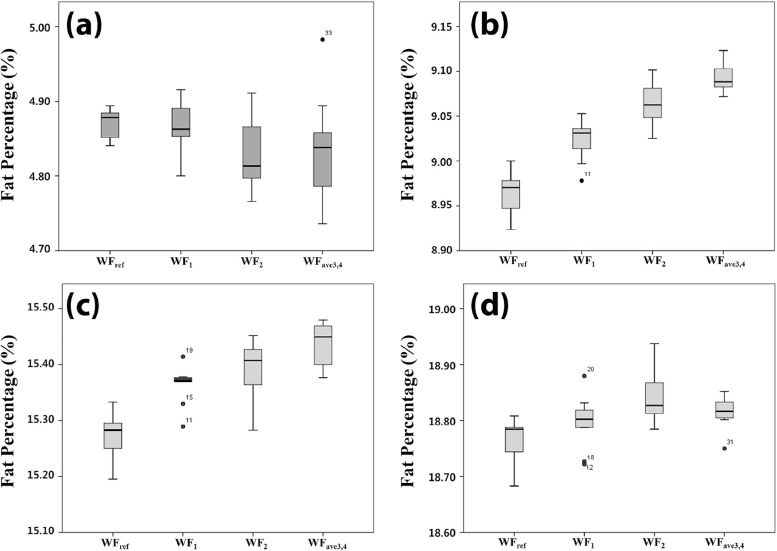
TABLE 2
The Analysis of Variance Test of Lipid Phantom Series Depending on the Applied Four Different WFs (WF ref , WF 1 , WF 2 , WF ave3,4 )
Test Tube Sum of Squares_P_ Value Intra-Group Inter-Group Oleic acid 1.232 7.765 .146 Linoleic acid 9.652 1.721 .000 Soybean oil 1 13.902 6.188 .000 Soybean oil 2 2.934 5.981 .002
Get Radiology Tree app to read full this article<
WF Values Change of High-fat Diet Fatty Liver Rat Model
Get Radiology Tree app to read full this article<
TABLE 3
The Mean Value Change of Individual Lipid Proton Weighting Factors (WFs) as Rat Fatty Liver FP Group
0.9 ppm 1.3 ppm 1.6 ppm 2.03 ppm 2.25 ppm 2.77 ppm 5.3 ppm 0%–10% 0.069 0.691 0.048 0.034 0.063 0.038 0.053 11%–20% 0.062 0.691 0.043 0.038 0.065 0.046 0.052 21%–30% 0.056 0.671 0.064 0.037 0.069 0.048 0.050 >31% 0.067 0.700 0.042 0.034 0.064 0.042 0.048 Average WF 0.064 0.688 0.049 0.036 0.065 0.043 0.051P value .078 .240 .045 .321 .500 .207 .520
Get Radiology Tree app to read full this article<
Inter-FM Concentration Correlation Analysis
Get Radiology Tree app to read full this article<
TABLE 4
The Correlation Analysis Between Seven Lipid Proton Concentrations
0.9 ppm 1.3 ppm 1.6 ppm 2.03 ppm 2.25 ppm 2.77 ppm 5.3 ppm 0.9 ppm 1.000 0.426 ( P = .038) −0.599 ( P = .002) −0.273 ( P = .197) −0.525 ( P = .008) −0.362 ( P = .082) 0.117 ( P = .585) 1.3 ppm 0.426 (P = .038) 1.000 −0.871 ( P = .000) −0.626 ( P = .001) −0.730 ( P = .000) −0.826 ( P = .000) 0.353 ( P = .091) 1.6 ppm −0.599 ( P = .002) −0.871 ( P = .000) 1.000 0.430 ( P = .036) 0.561 ( P = .004) 0.612 ( P = .001) −0.305 ( P = .147) 2.03 ppm −0.273 ( P = .197) −0.626 ( P = .001) 0.430 ( P = .036) 1.000 0.580 ( P = .003) 0.803 ( P = .000) −0.712 ( P = .000) 2.25 ppm −0.525 ( P = .008) −0.730 ( P = .000) 0.561 ( P = .004) 0.580 ( P = .003) 1.000 0.842 ( P = .000) −0.411 ( P = .046) 2.77 ppm −0.362 ( P = .082) −0.826 ( P = .000) 0.612 ( P = .001) 0.803 ( P = .000) 0.842 ( P = .000) 1.000 −0.641 ( P = .001) 5.3 ppm 0.117 ( P = .585) 0.353 ( P = .091) −0.305 ( P = .147) −0.712 ( P = .000) −0.411 ( P = .046) −0.641 ( P = .001) 1.000
Get Radiology Tree app to read full this article<
Discussion
Get Radiology Tree app to read full this article<
Get Radiology Tree app to read full this article<
Get Radiology Tree app to read full this article<
Acknowledgments
Get Radiology Tree app to read full this article<
Supplementary Data
Get Radiology Tree app to read full this article<
Appendix S1
Get Radiology Tree app to read full this article<
Get Radiology Tree app to read full this article<
References
1. Bataller R., Rombouts K., Altamirano J., et. al.: Fibrosis in alcoholic and nonalcoholic steatohepatitis. Best Pract Res Clin Gastroenterol 2011; 25: pp. 231-244.
2. Adams L.A., Lymp J.F., St Sauver J., et. al.: The natural history of nonalcoholic fatty liver disease: a population-based cohort study. Gastroenterology 2005; 129: pp. 113-121.
3. Marengo A., Jouness R.I., Bugianesi E.: Progression and natural history of nonalcoholic fatty liver disease in adults. Clin Liver Dis 2016; 20: pp. 313-324.
4. Wierzbicki A.S., Oben J.: Nonalcoholic fatty liver disease and lipids. Curr Opin Lipidol 2012; 23: pp. 345-352.
5. Han S., Ko J.S., Kwon G., et. al.: Effect of pure microsteatosis on transplant outcomes after living donor liver transplantation: a matched case-control study. Liver Transpl 2014; 20: pp. 473-482.
6. Brunt E.M., Kleiner D.E., Wilson L.A., et. al.: Portal chronic inflammation in nonalcoholic fatty liver disease (NAFLD): a histologic marker of advanced NAFLD-Clinicopathologic correlations from the nonalcoholic steatohepatitis clinical research network. Hepatology 2009; 49: pp. 809-820.
7. Kramer H., Pickhardt P.J., Kliewer M.A., et. al.: Accuracy of liver fat quantification with advanced CT, MRI, and ultrasound techniques: prospective comparison with MR spectroscopy. AJR Am J Roentgenol 2017; 208: pp. 92-100.
8. Patton H.M., Sirlin C., Behling C., et. al.: Pediatric nonalcoholic fatty liver disease: a critical appraisal of current data and implications for future research. J Pediatr Gastroenterol Nutr 2006; 43: pp. 413-427.
9. Bohte A.E., van Werven J.R., Bipat S., et. al.: The diagnostic accuracy of US, CT, MRI and 1 H-MRS for the evaluation of hepatic steatosis compared with liver biopsy: a meta-analysis. Eur Radiol 2011; 21: pp. 87-97.
10. Dixon W.T.: Simple proton spectroscopic imaging. Radiology 1984; 153: pp. 189-194.
11. Hayashi T., Saitoh S., Takahashi J., et. al.: Hepatic fat quantification using the two-point Dixon method and fat color maps based on non-alcoholic fatty liver disease activity score. Hepatol Res 2016; 47: pp. 455-464.
12. Ishizaka K., Oyama N., Mito S., et. al.: Comparison of 1H MR spectroscopy, 3-point DIXON, and multi-echo gradient echo for measuring hepatic fat fraction. Magn Reson Med Sci 2011; 10: pp. 41-48.
13. Rosenkrantz A.B., Raj S., Babb J.S., et. al.: Comparison of 3D two-point Dixon and standard 2D dual-echo breath-hold sequences for detection and quantification of fat content in renal angiomyolipoma. Eur J Radiol 2012; 81: pp. 47-51.
14. Wang Y., Li D., Haacke E.M., et. al.: A three-point Dixon method for water and fat separation using 2D and 3D gradient-echo techniques. J Magn Reson Imaging 1998; 8: pp. 703-710.
15. Kuhn J.P., Evert M., Friedrich N., et. al.: Noninvasive quantification of hepatic fat content using three-echo Dixon magnetic resonance imaging with correction for T2* relaxation effects. Invest Radiol 2011; 46: pp. 783-789.
16. Reeder S.B., Bice E.K., Yu H., et. al.: On the performance of T2* correction methods for quantification of hepatic fat content. Magn Reson Med 2012; 67: pp. 389-404.
17. Wells S.A.: Quantification of hepatic fat and iron with magnetic resonance imaging. Magn Reson Imaging Clin N Am 2014; 22: pp. 397-416. PMID 25086936
18. Lee S.S., Lee Y., Kim N., et. al.: Hepatic fat quantification using chemical shift MR imaging and MR spectroscopy in the presence of hepatic iron deposition: validation in phantoms and in patients with chronic liver disease. J Magn Reson Imaging 2011; 33: pp. 1390-1398.
19. Kang B.K., Yu E.S., Lee S.S., et. al.: Hepatic fat quantification: a prospective comparison of magnetic resonance spectroscopy and analysis methods for chemical-shift gradient echo magnetic resonance imaging with histologic assessment as the reference standard. Invest Radiol 2012; 47: pp. 368-375.
20. Keese D., Korkusuz H., Huebner F., et. al.: In vivo and ex vivo measurements: noninvasive assessment of alcoholic fatty liver using 1H-MR spectroscopy. Diagn Interv Radiol 2016; 22: pp. 13-21.
21. van Werven J.R., Schreuder T.C., Nederveen A.J., et. al.: Hepatic unsaturated fatty acids in patients with non-alcoholic fatty liver disease assessed by 3.0T MR spectroscopy. Eur J Radiol 2010; 75: pp. e102-e107.
22. Wong V.W., Chu W.C., Wong G.L., et. al.: Prevalence of non-alcoholic fatty liver disease and advanced fibrosis in Hong Kong Chinese: a population study using proton-magnetic resonance spectroscopy and transient elastography. Gut 2012; 61: pp. 409-415.
23. Hines C.D., Yu H., Shimakawa A., et. al.: T1 independent, T2* corrected MRI with accurate spectral modeling for quantification of fat: validation in a fat-water-SPIO phantom. J Magn Reson Imaging 2009; 30: pp. 1215-1222.
24. Ren J., Dimitrov I., Sherry A.D., et. al.: Composition of adipose tissue and marrow fat in humans by 1H NMR at 7 Tesla. J Lipid Res 2008; 49: pp. 2055-2062.
25. Strobel K., van den Hoff J., Pietzsch J.: Localized proton magnetic resonance spectroscopy of lipids in adipose tissue at high spatial resolution in mice in vivo. J Lipid Res 2008; 49: pp. 473-480.
26. Cheung J.S., Fan S.J., Gao D.S., et. al.: In vivo lipid profiling using proton magnetic resonance spectroscopy in an experimental liver fibrosis model. Acad Radiol 2011; 18: pp. 377-383.
27. Scorletti E., Bhatia L., McCormick K.G., et. al.: Design and rationale of the WELCOME trial: a randomised, placebo controlled study to test the efficacy of purified long chain omega-3 fatty acid treatment in non-alcoholic fatty liver disease. Contemp Clin Trials 2014; 37: pp. 301-311.
28. Pacifico L., Giansanti S., Gallozzi A., et. al.: Long chain omega-3 polyunsaturated fatty acids in pediatric metabolic syndrome. Mini Rev Med Chem 2014; 14: pp. 791-804.
29. Corbin I.R., Furth E.E., Pickup S., et. al.: In vivo assessment of hepatic triglycerides in murine non-alcoholic fatty liver disease using magnetic resonance spectroscopy. Biochim Biophys Acta 2009; 1791: pp. 757-763.