
Rationale and Objectives
Left ventricular hypertrophy (LVH) is associated with an increased risk of cardiac death. The present study evaluates whether using computed tomographic (CT)–derived criteria for normal myocardial mass can improve detection of LVH on CT angiography (CTA).
Materials and Methods
A total of 2238 subjects (63 ± 9 years, 27% female) who underwent CTA were studied. To identify normal limits for CT-derived myocardial mass, we studied normal subjects (those without diabetes, hypertension, congestive heart failure, or coronary artery disease). Left ventricular mass (LVM) was measured manually using two different workstations. The CT criteria of LVH was defined as LVM above the 97th percentile per gender and compared to echocardiographic criteria (110 g/m 2 in women; 124 g/m 2 in men), and specificity and sensitivity of both models to detect LVH were calculated.
Results
The LVM was higher in men than women in normal cohorts (75.5 ± 14.0 vs. 63.1 ± 12.8 g/m 2 , P = .001 with electron beam CTA and 78.5 ± 11.9 vs. 65.0 ± 9.2 g/m 2 , P = .001 with 64 multidetector [MD] CT, respectively). The coefficient of variation between electron beam CTA and 64 MDCT for measuring LVM was 3.1%. Comparing the new CTA/64 MDCT criteria of LVH (103.0 g/m 2 in men; 89.0 g/m 2 in women) to the previous echocardiographic criteria of LVH, the specificity in women and men decreased from 100% in both genders by echocardiography to 91.8% and 92.6%, respectively, but the sensitivity increased from 42.0% to 100% and from 41.1% to 100%.
Conclusion
This study suggests that CT-measured LVM has low variability and normal values based on CT criteria will potentially increase the early detection of LVH.
Left ventricular hypertrophy (LVH) is the earliest manifestation of cardiac damage in hypertension , and is an independent predictor of cardiovascular events . The detection and quantification of LVH is an important target to monitor the efficacy of antihypertensive therapies . Two-dimensional echocardiography has been used to measure left ventricular mass (LVM) for the past two decades , but because of significant improvement in measuring techniques, other modalities, including magnetic resonance imaging (MRI) , computed tomography (CT) , multiple detector row CT (MDCT) , and three-dimensional echocardiography have been accepted as alternatives for accurate LVH measurement. Electron beam (EB) computed tomographic angiographic (CTA) and 64 MDCT with high spatial resolution can accurately differentiate the endocardial and epicardial boundaries and provide detailed information of cardiac structures that should allow for precise measurement of the chamber volume and LVM without assumptions regarding geometry . Studies have used various criteria to measure LVH with different imaging modalities , but previous CT-defined criteria are still challenging and have a very low sensitivity to detect LVH . The present study evaluates whether a new criteria for LVH on CTA/MDCT can improve detection of LVH.
Methods
Study Population
We enrolled consecutive patients without known causes of increased LVM to define the normal and 97th percentiles for both men and women from among 2238 consecutive subjects (mean 63 ± 9 years, 27% women) who underwent CTA with EB and 458 subjects who underwent 64 MDCT. Excluded were those patients with known coronary artery disease, congestive heart failure or ejection fraction <50%, hypertension, or diabetes. The study protocol was approved by the Los Angeles Biomedical Research Institute at Harbor UCLA Medical Center, Torrance, CA.
EBCT Angiographic Study
Get Radiology Tree app to read full this article<
MDCT Study Protocol
Get Radiology Tree app to read full this article<
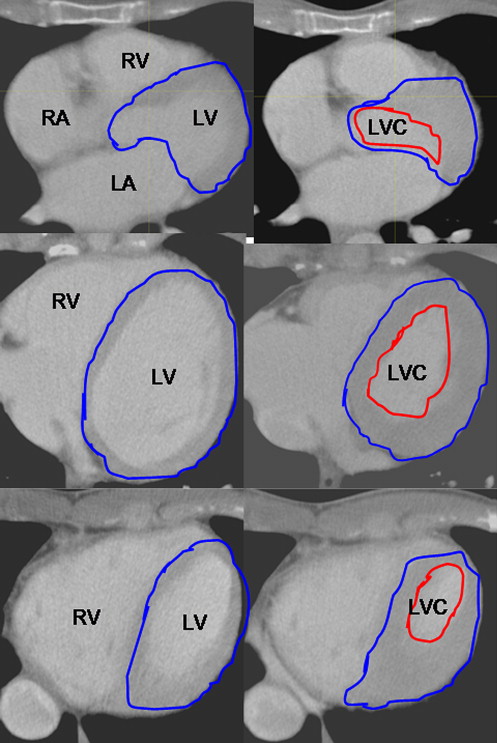
Measurement of LVM with CTA and 64 MDCT
Get Radiology Tree app to read full this article<
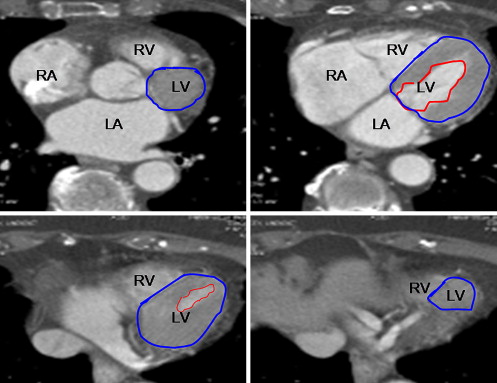
Table 1
Relationship between Left Ventricular Mass and Gender
Gender No. Age (y) Weight (lb) Height (in) BSA LVEF (%) LVM (G) Group 1A Female 247 60 67.3 162.1 1.72 69.4 63.1 (CTA) Male 551 58 82.5 176.5 1.99 68.3 75.5 Group 1B Female 166 61.7 159.0 63.4 1.75 66.1 65.0 (MDCT) Male 292 59.6 193.3 69.9 2.05 64.3 78.5 Group 2 Female 146 63 73.2 162.3 1.78 70.9 63.2 Male 283 63 87.4 176.0 2.04 69.1 75.3
BSA, body surface area; CTA, computed tomographic angiography; LVEF, left ventricular ejection fraction; LVM, left ventricular mass; MDCT, multiple detector row computed tomography.
Group 1A and 1B: normal; Group 2: hypertension with normal LVEF.
∗ Significant difference with normal group ( P < .001).
Get Radiology Tree app to read full this article<
Left Ventricular Ejection Fraction Measurement with Cine Image of CTA and 64 MDCT
Get Radiology Tree app to read full this article<
Get Radiology Tree app to read full this article<
Variability of LVM Measurement
Get Radiology Tree app to read full this article<
Table 2
Variability of Left Ventricular Mass Measurement
Variability No.R V CV Bland Altman plot ratio Interobserver 21 0.96 ∗ 6.1 3.7 0.99 (95%CI: 0.97–1.01) Interscan 27 0.96 ∗ 5.5 3.8 1.0 (95%CI: 0.98–1.03) Different phases (ES and ED) 71 0.98 ∗ 6.2 3.7 0.97 (95%CI: 0.95–0.98) Inter AW and Terarecon 865 0.93 ∗ 7.7 4.5 1.01 (95%CI: 0.99–1.02) Inter EBA and CTA 30 0.81 4.9 3.1 0.96 (95% CI: 0.93–0.97)
CV, coefficient of variation by Bland-Altman model; EBA, electron beam angiogram; ED, end diastolic; ES, end systolic; R , R value; V, variation between two measurements.
Get Radiology Tree app to read full this article<
Get Radiology Tree app to read full this article<
Statistical Analyses
Get Radiology Tree app to read full this article<
Results
Get Radiology Tree app to read full this article<
Table 3
Sensitivity and Specificity of New Criteria to Detect Left Ventricular Hypertrophy as Compared to the Previous Criteria
Group Left Ventricular Mass Women Men No. ≥110 g/m 2 <110 g/m 2 ≥89 g/m 2 <89 g/m 2 No. ≥124 g/m 2 <124 g/m 2 ≥103 g/m 2 <103 g/m 2 Group 1A 247 1 246 7 240 551 0 551 17 534 Group 1B 166 0 166 4 164 292 0 292 6 286 Group 2 146 3 243 9 137 283 7 276 19 264 617 Sen Spec Sen Spec 1621 Sen Spec Sen Spec (%) (%) (%) (%) (%) (%) (%) (%) LVH 42.0 100 100 91.8 41.1 100 100 92.6
LVH, left ventricular hypertrophy diagnosed by computed tomographic angiography; Sen, sensitivity; spec, specificity.
Group 1A and 1B: normal; Group 2: hypertension with normal left ventricular ejection fraction.
Get Radiology Tree app to read full this article<
Get Radiology Tree app to read full this article<
Discussion
Get Radiology Tree app to read full this article<
Standard Cut Point for LVH
Get Radiology Tree app to read full this article<
Table 4
Criteria of Left Ventricular Hypertrophy (2 SD above Mean LVM or 97th Percentile of LVM) with Different Imaging Modalities
Author No. LVM (g/m 2 ) Image Female Male Mao 798 89 103 EBT Verdecchia 1064 110 124 M-D Echo Devereux 94 110 134 M-D Echo Hees 336 115 135 MRI Lorenz 75 95 113 MRI Alfakin 60 77 96 MRI-TGE Alfakin 60 67 83 MRI-SSFP Rumberger – 134 134 EBT Lang – 95 115 Echo
EBT, electron beam computed tomography; echo, echocardiogram; LVM, left ventricular mass; MRI, magnetic resonance imaging; SSFP, steady-state free precession; TGE, turbo gradient echo.
Get Radiology Tree app to read full this article<
Variability of LVM Measurement
Get Radiology Tree app to read full this article<
Comparison among EBT, MRI, Three-dimensional Echocardiography, and MDCT
Get Radiology Tree app to read full this article<
Get Radiology Tree app to read full this article<
Limitations
Get Radiology Tree app to read full this article<
Conclusion
Get Radiology Tree app to read full this article<
Get Radiology Tree app to read full this article<
References
1. Cipriano C., Gosse P., Bemurat L., et. al.: Prognostic value of left ventricular mass and its evolution during treatment in the Bordeaux cohort of hypertensive patients. Am J Hypertens 2001; 14: pp. 524-529.
2. Koren M.J., Ulin R.J., Koren A.T., et. al.: Left ventricular mass change during treatment and outcome in patients with essential hypertension. Am J Hypertens 2002; 15: pp. 1021-1028.
3. Verdecchia P., Schillaci G., Borgioni C., et. al.: Prognostic value of left ventricular mass and geometry in systemic hypertension with left ventricular hypertrophy. Am J Cardiol 1996; 78: pp. 197-202.
4. Verdecchia P., Schillaci G., Borgioni C., et. al.: Prognostic significance of serial changes in left ventricular mass in essential hypertension. Circulation 1998; 97: pp. 48-54.
5. Haider A.W., Larson M.G., Benjamin E.J., et. al.: Increased left ventricular mass and hypertrophy are associated with increased risk for sudden death. J Am Coll Cardiol 1998; 32: pp. 1454-1459.
6. Muiesan M.L., Salvetti M., Paini A., et. al.: Inappropriate left ventricular mass changes during treatment adversely affects cardiovascular prognosis in hypertensive patients. Hypertension 2007; 49: pp. 1077-1083.
7. Taniguchi I., Kawai M., Date T., et. al.: Effects of spironolactone during an angiotensin II receptor blocker treatment on the left ventricular mass reduction in hypertensive patients with concentric left ventricular hypertrophy. Circ J 2006; 70: pp. 995-1000.
8. Verdecchia P., Angeli F., Borgioni C., et. al.: Changes in cardiovascular risk by reduction of left ventricular mass in hypertension: a meta-analysis. Am J Hypertens 2003; 16: pp. 895-899.
9. Devereux R.B., Lutas E.M., Casale P.N., et. al.: Standardization of M-mode echocardiographic left ventricular anatomic measurements. J Am Coll Cardiol 1984; 4: pp. 1222-1230.
10. Hees P.S., Fleg J.L., Lakatta E.G., et. al.: Left ventricular remodeling with age in normal men versus women: novel insights using three-dimensional magnetic resonance imaging. Am Cardiol 2002; 90: pp. 1231-1236.
11. Lorenz C.H., Walker E.S., Morgan V.L., et. al.: Normal human right and left ventricular mass, systolic function, and gender differences by cine magnetic resonance imaging. J Cardiovasc Magn Reson 1999; 1: pp. 7-21.
12. Alfakih K., Plein S., Thiele H., et. al.: Normal human left and right ventricular dimensions for MRI as assessed by turbo gradient echo and steady-state free precession imaging sequences. J Magn Reson Imaging 2003; 17: pp. 323-329.
13. Mao S., Takasu J., Child J., et. al.: Comparison of LV mass and volume measurements derived from electron beam tomography using cine imaging and angiographic imaging. Int J Cardiovasc Imaging 2003; 19: pp. 439-445.
14. Yamamuro M., Tadamura E., Kubo S., et. al.: Cardiac functional analysis with multi-detector row CT and segmental reconstruction algorithm: comparison with echocardiography, SPECT, and MR imaging. Radiology 2005; 234: pp. 381-390.
15. Rumberger J.A.: Use of electron beam tomography to quantify cardiac diastolic function. Cardiol Clin 2000; 18: pp. 547-556.
16. Chuang M.L., Hibberd M.G., Salton C.J., et. al.: Importance of imaging method over imaging modality in noninvasive determination of left ventricular volumes and ejection fraction: assessment by two- and three-dimensional echocardiography and magnetic resonance imaging. J Am Coll Cardiol 2000; 35: pp. 477-484.
17. Jung H.O., Sheehan F.H., Bolson E.L., et. al.: Evaluation of midwall systolic function in left ventricular hypertrophy: a comparison of 3-dimensional versus 2-dimensional echocardiographic indices. J Am Soc Echocardiogr 2006; 19: pp. 802-810.
18. Chuang M.L., Salton C.J., Hibberd M.G., et. al.: Relation between number of component views and accuracy of left ventricular mass determined by three-dimensional echocardiography. Am J Cardiol 2007; 99: pp. 1321-1324.
19. Budoff M.J.: Computed tomography.Budoff M.Shinbane J.Cardiac CT imaging: diagnosis of cardiovascular disease.2006.SpringerLondon, UK:
20. Lang R.M., Bierig M., Devereux R.B., et. al.: Chamber Quantification Writing Group; American Society of Echocardiography’s Guidelines and Standards Committee; European Association of Echocardiography. Recommendations for chamber quantification: a report from the American Society of Echocardiography’s Guidelines and Standards Committee and the Chamber Quantification Writing Group, developed in conjunction with the European Association of Echocardiography, a branch of the European Society of Cardiology. J Am Soc Echocardiogr 2005; 18: pp. 1440-1463.
21. Mao S., Budoff M.J., Bin L., et. al.: Optimal ECG trigger point in electron-beam CT studies: three methods for minimizing motion artifacts. Acad Radiol 2001; 8: pp. 1107-1115.
22. Budoff M.J., Shinbane J.S., Child J., et. al.: Multiphase contrast medium injection for optimization of computed tomographic coronary angiography. Acad Radiol 2006; 13: pp. 159-165.
23. Reichek N., Helak J., Plappert T., et. al.: Anatomic validation of left ventricular mass estimates from clinical two-dimensional echocardiography: initial results. Circulation 1983; 67: pp. 348-352.
24. Schmidt M.A., Freidlin R.Z., Ohazama C.J., et. al.: Anatomic validation of a novel method for left ventricular volume and mass measurements with use of real-time 3-dimensional echocardiography. J Am Soc Echocardiogr 2001; 14: pp. 1-10.
25. Francois C.J., Fieno D.S., Shors S.M., et. al.: Left ventricular mass: manual and automatic segmentation of true FISP and FLASH cine MR images in dogs and pigs. Radiology 2004; 230: pp. 389-395.
26. Feiring A.J., Rumberger J.A., Reiter S.J., Skorton D.J., et. al.: Determination of left ventricular mass in dogs with rapid-acquisition cardiac computed tomographic scanning. Circulation 1985; 72: pp. 1355-1364.
27. Dai S., Ayres N.A., Harrist R.B., et. al.: Validity of echocardiographic measurement in an epidemiological study. Project HeartBeat!. Hypertension 1999; 34: pp. 236-241.
28. Otto C.M.: Textbook of clinical echocardiography.2004.Elsevier SaundersPhiladelphia, PA
29. Myerson S.G., Montgomery H.E., World M.J., et. al.: Left ventricular mass: reliability of M-mode and 2-dimensional echocardiographic formulas. Hypertension 2002; 40: pp. 673-678.
30. Roig E., Georgiou D., Chomka E.V., et. al.: Reproducibility of left ventricular myocardial volume and mass measurements by ultrafast computed tomography. J Am Coll Cardiol 1991; 18: pp. 990-996.
31. Myerson S.G., Bellenger N.G., Pennell D.J.: Assessment of left ventricular mass by cardiovascular magnetic resonance. Hypertension 2002; 39: pp. 750-752.
32. Gopal A.S., Keller A.M., Shen Z., et. al.: Three-dimensional echocardiography: in vitro and in vivo validation of left ventricular mass and comparison with conventional echocardiographic methods. J Am Coll Cardiol 1994; 24: pp. 504-513.
33. Schmidt M.A., Ohazama C.J., Agyeman K.O., et. al.: Real-time three-dimensional echocardiography for measurement of left ventricular volumes. Am J Cardiol 1999; 84: pp. 1434-1439.
34. Higgins C.B., Roos A.D.: MRI and CT of the cardiovascular system.2nd ed2006.Lippincott Williams & WilkinsPhiladelphia, PA