
Rationale and Objectives
The aim of this study was to explore the reliability of osteopenia diagnosis based on digital radiographs of appendicular skeleton obtained as part of routine clinical practice as compared with dual-energy x-ray absorptiometry (DEXA) gold standard (Z-score <−1).
Materials and Methods
The study was an institutional review board‒approved retrospective study of 58 children (mean age 12 years [4–18]). Digital radiographs of appendicular skeleton obtained within 6 months of DEXA scanning were presented in a blinded fashion to two musculoskeletal radiologists who were instructed to grade the level of mineralization. Sensitivity and specificity of each reviewer’s osteopenia grading were calculated in comparison to lumbar DEXA Z-score values. Interobserver agreement was also calculated and significance evaluated with Bowker’s test.
Results
The reviewers correctly identified 28% of all patients with severe osteopenia (Z-score ≤−2.0) as well as 26% of all patients with mild osteopenia (−2< Z-score <−1). Interobserver agreement for the correct diagnosis of bone mineral density (BMD) category ranged from 71% for normal BMD (Z-score >−1) to 0 and 25% for mild and severe osteopenia respectively.
Conclusions
Visual diagnosis of osteopenia based on digital radiographs of appendicular skeleton has poor sensitivity and interobserver agreement. Clinical features and risk factors of pediatric patients should therefore guide DEXA evaluation and treatment recommendations.
In both adults and children, digital radiographs obtained as part of routine clinical practice may be the first modality that raises suspicion for low bone mineral density (BMD) when increased radiotranslucency of bones is demonstrated. In appendicular bones, objective criteria for the radiographic identification of osteopenia include relative cortical thickness related to overall bone caliber, cortical sharpness, qualitative determination of trabecular rarefaction, and density variations between bone and soft tissue . Radiologists will often use both such objective criteria as well as subjective overall image “gestalt” in determining the quality of BMD in appendicular bone.
Dual-energy x-ray absorptiometry (DEXA) is a reliable and accurate method to determine BMD in both adults and children. In the pediatric population, BMD values from DEXA are influenced by puberty, body habitus as well as sex and ethnic differences. DEXA BMD values for children should therefore use normative databases and Z-scores to account for demographic variations of bone mass in children . Some accepted indications for DEXA imaging in children include systemic long-term steroid use (>2 months), chronic inflammatory conditions, hypogonadism, osteogenesis imperfecta, and recurrent low trauma fractures .
Get Radiology Tree app to read full this article<
Method and materials
Patient Population
Get Radiology Tree app to read full this article<
Image Analysis
Get Radiology Tree app to read full this article<
Statistical Analysis
Get Radiology Tree app to read full this article<
Get Radiology Tree app to read full this article<
Get Radiology Tree app to read full this article<
Results
Get Radiology Tree app to read full this article<
Get Radiology Tree app to read full this article<
Table 1
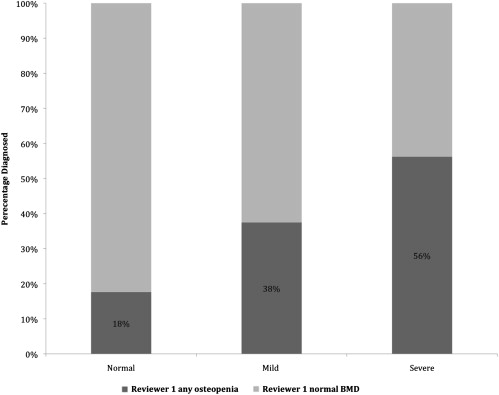
Reviewer 1 (R1) Visual Rating of Osteopenia as Compared to DEXA Determination of Bone Mineral
Normal Mild Severe DEXA Normal82% 15% 3% Mild 62%13% 25% Severe 43% 25%31%
DEXA, dual-energy x-ray absorptiometry.
The Bowker’s P value for R1 is not significant (0.16) indicating that radiologist is selecting the categories in similar proportions as the DEXA standard. Bold numbers represent agreement between R1 and DEXA bone density categories.
Get Radiology Tree app to read full this article<
Get Radiology Tree app to read full this article<
Table 2
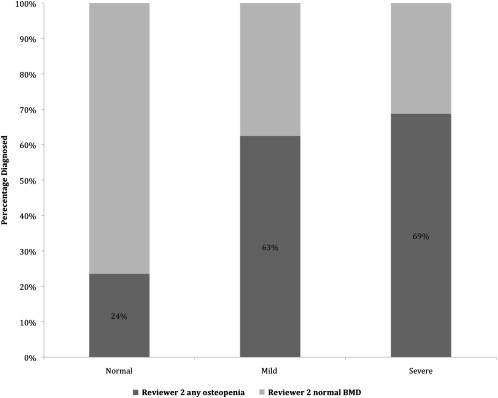
Reviewer 2 (R2) Visual Rating of Osteopenia as Compared with DEXA Determination of Bone Mineral Density
Normal Mild Severe DEXA Normal76% 24% 0% Mild 37.5%37.5% 25% Severe 31% 43%25%
DEXA, dual-energy x-ray absorptiometry.
The Bowker’s P value for R2 is significant (.018) indicating that radiologist is selecting the categories in differing proportions as the DEXA standard. Bold numbers represent agreement between R2 and DEXA bone density categories.
Get Radiology Tree app to read full this article<
Get Radiology Tree app to read full this article<
Table 3
Reviewer 1 (R1) vs. Reviewer 2 (R2) Interobserver Agreement by DEXA Determined Bone Mineral Density Categories
Reviewer 2 Normal Mild Severe Reviewer 1 Normal75% 22.5% 2.5% Mild 40%60% 0% Severe 0% 37.5%62.5%
DEXA, dual-energy x-ray absorptiometry.
Percentage agreement is calculated based on R1’s totals in each BMD category and is not correlated to DEXA standard. The Bowker’s P value for interobserver agreement is not significant (.1154) indicating that both radiologists are selecting categories in similar proportions. Bold numbers represent agreement between R1 and R2 visual bone density categories without correlation with DEXA standard.
Get Radiology Tree app to read full this article<
Discussion
Get Radiology Tree app to read full this article<
Get Radiology Tree app to read full this article<
Get Radiology Tree app to read full this article<
Get Radiology Tree app to read full this article<
Get Radiology Tree app to read full this article<
Acknowledgments
Get Radiology Tree app to read full this article<
References
1. Brant W.E., Helms C.A.: Fundamentals of diagnostic radiology.2007.Lippincott Williams & WilkinsPhiladelphia, Pa
2. Gordon C.M., Bachrach L.K., Carpenter T.O., et. al.: Dual energy X-ray absorptiometry interpretation and reporting in children and adolescents: the 2007 ISCD Pediatric Official Positions. J Clin Densitom 2008; 11: pp. 43-58.
3. Writing Group for the ISCD Position Development Conference: Diagnosis of osteoporosis in men, premenopausal women, and children. J Clin Densitom 2004; 7: pp. 17-26.
4. Binkovitz L.A., Henwood M.J.: Pediatric DXA: technique and interpretation. Pediatr Radiol 2007; 37: pp. 21-31.
5. Steelman J., Zeitler P.: Osteoporosis in pediatrics. Pediatr Rev 2001; 22: pp. 56-65.
6. Wagner S., Stabler A., Sittek H., et. al.: Diagnosis of osteoporosis: visual assessment on conventional versus digital radiographs. Osteoporos Int 2005; 16: pp. 1815-1822.