
Rationale and Objectives
Prostate volume (PV) determination provides important clinical information. We compared PVs determined by digital rectal examination (DRE), transrectal ultrasound (TRUS), magnetic resonance imaging (MRI) with or without three-dimensional (3D) segmentation software, and surgical prostatectomy weight (SPW) and volume (SPV).
Materials and Methods
This retrospective review from 2010 to 2016 included patients who underwent radical prostatectomy ≤1 year after multiparametric prostate MRI. PVs from DRE and TRUS were obtained from urology clinic notes. MRI-based PVs were calculated using bullet and ellipsoid formulas, automated 3D segmentation software (MRI-A3D), manual segmentation by a radiologist (MRI-R3D), and a third-year medical student (MRI-S3D). SPW and SPV were derived from pathology reports. Intraclass correlation coefficients compared the relative accuracy of each volume measurement.
Results
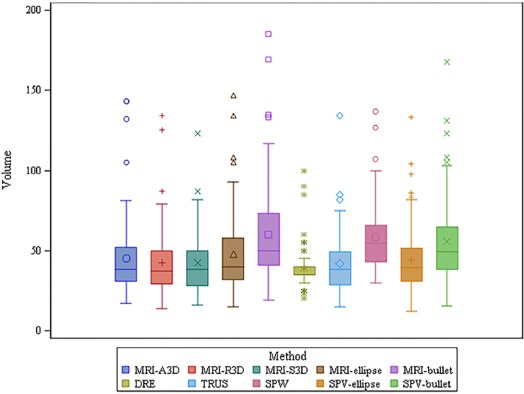
Ninety-nine patients were analyzed. Median PVs were DRE 35 mL, TRUS 35 mL, MRI-bullet 49 mL, MRI-ellipsoid 39 mL, MRI-A3D 37 mL, MRI-R3D 36 mL, MRI-S3D 36 mL, SPW 54 mL, SPV-bullet 47 mL, and SPV-ellipsoid 37 mL. SPW and bullet formulas had consistently large PV, and formula-based PV had a wider spread than PV based on segmentation. Compared to MRI-R3D, the intraclass correlation coefficient was 0.91 for MRI-S3D, 0.90 for MRI-ellipsoid, 0.73 for SPV-ellipsoid, 0.72 for MRI-bullet, 0.71 for TRUS, 0.70 for SPW, 0.66 for SPV-bullet, 0.38 for MRI-A3D, and 0.33 for DRE.
Conclusions
With MRI-R3D measurement as the reference, the most reliable methods for PV estimation were MRI-S3D and MRI-ellipsoid formula. Automated segmentations must be individually assessed for accuracy, as they are not always truly representative of the prostate anatomy. Manual segmentation of the prostate does not require expert training.
Introduction
Prostate volume (PV) determination is an essential component of evaluation and management of prostatic disease, including benign prostatic hypertrophy (BPH) and prostate cancer (PCa). With respect to BPH, PV estimation can provide objective data for the purposes of treatment planning, monitoring response to therapy, and surgical technique. For example, treatment options for lower urinary tract symptoms secondary to BPH depend on gland size, with larger glands (>40 mL) recommended for 5-alpha reductase inhibitors and smaller glands (<30 mL) often treated with alpha-adrenergic receptor blockers alone . PV may be a predictor of BPH complications, such as urinary retention, hydronephrosis, and renal injury, which may also influence therapy . Treatment effectiveness can be evaluated with serial PV estimations and can be stratified based on zonal anatomy as well . Furthermore, PV frequently affects the choice of surgical approach for BPH when considering between ablative procedures, transurethral resection, minimally invasive surgery, and open prostatectomy .
For patients with PCa, PV is helpful for risk stratification during screening and risk assessment, especially when used in conjunction with prostate-specific antigen (PSA). Although PSA values correlate with risk of PCa, elevations in PSA can also be due to BPH and inflammatory benign prostatic diseases, such as prostatitis, limiting the specificity . Biopsies performed based on elevated PSA alone can result in biopsy rates negative for malignancy in up to 76% of cases . In addition, overdiagnosis rates as high as 60% have been reported, as patients may suffer from unnecessary morbidity from treatment of clinically indolent, low-grade PCa . Multiple studies have shown that PSA derivatives that incorporate volume, such as PSA density , outperform PSA in predicting overall and clinically significant PCa , as larger prostates not only have greater rates of smaller volume PCa but also less-aggressive tumors across a variety of pathologic variables . Another PSA derivative is the PV index, equal to the ratio of transitional zone to peripheral zone volume, which is inversely correlated with PCa risk . Use of an approach to risk stratification that includes PV helps to select the most appropriate patients for active surveillance and may reduce overtreatment of low-risk tumors .
Get Radiology Tree app to read full this article<
Get Radiology Tree app to read full this article<
Get Radiology Tree app to read full this article<
Get Radiology Tree app to read full this article<
Materials and Methods
Get Radiology Tree app to read full this article<
Get Radiology Tree app to read full this article<
Get Radiology Tree app to read full this article<
Get Radiology Tree app to read full this article<
Get Radiology Tree app to read full this article<
Results
Get Radiology Tree app to read full this article<
TABLE 1
Clinical, Radiographic, and Pathologic Characteristics
Variable N (%) or Median (IQR) Median age, y (IQR) 63 (59–68) Median pretreatment PSA, ng/mL (IQR) 6.6 (4.3–11.4) Biopsy Gleason group \* 1 (3 + 3) 29 (32.2%) 2 (3 + 4) 25 (27.8%) 3 (4 + 3) 13 (14.4%) 4 (8) 14 (15.6%) 5 (9–10) 9 (10.0%) Pathologic stage pT2 and below 63 (63.6%) pT3 and above 36 (36.4%) Surgical Gleason group † 1 (3 + 3) 6 (6.1%) 2 (3 + 4) 43 (43.9%) 3 (4 + 3) 28 (28.6%) 4 (8) 11 (11.2%) 5 (9–10) 10 (10.2%) Extraprostatic extension † 30 (30.6%) Seminal vesicle invasion † 12 (12.2%) Lymph node involvement † 22 (22.4%)
IQR, interquartile range; PSA, prostate-specific antigen.
Get Radiology Tree app to read full this article<
Get Radiology Tree app to read full this article<
Get Radiology Tree app to read full this article<
Get Radiology Tree app to read full this article<
TABLE 2
Prostate Volume Calculations (mL)
Variable N Mean Standard Deviation Median Lower Quartile Upper Quartile Quartile Range DRE 87 38.0 12.8 35.0 35.0 40.0 5.0 TRUS 85 40.4 18.8 35.0 28.0 46.0 18.0 MRI-A3D 99 46.3 35.2 37.0 29.0 51.0 22.0 MRI-R3D 99 40.8 20.1 36.0 26.0 48.0 22.0 MRI-S3D 99 39.8 18.2 36.0 27.0 47.0 20.0 MRI-ellipse 99 45.1 23.6 39.0 29.0 53.0 24.0 MRI-bullet 99 56.9 29.7 49.0 37.0 66.0 29.0 SPV-ellipse 99 38.9 23.2 37.4 26.2 47.0 20.8 SPV-bullet 99 49.0 29.2 47.1 33.0 59.2 26.2 SPW 89 57.8 21.2 54.0 42.0 65.0 23.0
DRE, digital rectal examination; MRI-A3D, magnetic resonance imaging with automated 3D segmentation software; MRI-R3D, magnetic resonance imaging with manual segmentation by a radiologist; MRI-S3D, magnetic resonance imaging with manual segmentation by a third-year medical student; TRUS, transrectal ultrasound; SPV, surgical prostatectomy volume; SPW, surgical prostatectomy weight.
Get Radiology Tree app to read full this article<
Get Radiology Tree app to read full this article<
TABLE 3
Prostate Volume Measurement Inter-rater Reliability Correlations
Volume Calculation Method Compared to MRI-R3D Shrout-Fleiss Reliability MRI-S3D 0.91 MRI-ellipse 0.90 SPV-ellipse 0.73 MRI-bullet 0.72 TRUS 0.71 SPW 0.70 SPV-bullet 0.66 MRI-A3D 0.38 DRE 0.33
DRE, digital rectal examination; MRI-A3D, magnetic resonance imaging with automated 3D segmentation software; MRI-S3D, magnetic resonance imaging with manual segmentation by a third-year medical student; TRUS, transrectal ultrasound; SPV, surgical prostatectomy volume; SPW, surgical prostatectomy weight.
Get Radiology Tree app to read full this article<
Get Radiology Tree app to read full this article<
Discussion
Get Radiology Tree app to read full this article<
Get Radiology Tree app to read full this article<
Get Radiology Tree app to read full this article<
Get Radiology Tree app to read full this article<
Get Radiology Tree app to read full this article<
Get Radiology Tree app to read full this article<
Conclusions
Get Radiology Tree app to read full this article<
Acknowledgments
Get Radiology Tree app to read full this article<
References
1. McConnell J.D., Bruskewitz R., Walsh P., et. al.: The effect of finasteride on the risk of acute urinary retention and the need for surgical treatment among men with benign prostatic hyperplasia. Finasteride Long-Term Efficacy and Safety Study Group. N Engl J Med 1998; 338: pp. 557-563.
2. Garvey B., Turkbey B., Truong H., et. al.: Clinical value of prostate segmentation and volume determination on MRI in benign prostatic hyperplasia. Diagn Interv Radiol 2014; 20: pp. 229-233.
3. Oesterling J.E.: Prostate specific antigen: a critical assessment of the most useful tumor marker for adenocarcinoma of the prostate. J Urol 1991; 145: pp. 907-923.
4. Schroder F.H., Hugosson J., Roobol M.J., et. al.: Screening and prostate-cancer mortality in a randomized European study. N Engl J Med 2009; 360: pp. 1320-1328.
5. Welch H.G., Black W.C.: Overdiagnosis in cancer. J Natl Cancer Inst 2010; 102: pp. 605-613.
6. Roobol M.J., Schroder F.H., Hugosson J., et. al.: Importance of prostate volume in the European Randomised Study of Screening for Prostate Cancer (ERSPC) risk calculators: results from the prostate biopsy collaborative group. World J Urol 2012; 30: pp. 149-155.
7. Bul M., Zhu X., Valdagni R., et. al.: Active surveillance for low-risk prostate cancer worldwide: the PRIAS study. Eur Urol 2013; 63: pp. 597-603.
8. Roobol M.J., van Vugt H.A., Loeb S., et. al.: Prediction of prostate cancer risk: the role of prostate volume and digital rectal examination in the ERSPC risk calculators. Eur Urol 2012; 61: pp. 577-583.
9. Pierorazio P.M., Kinnaman M.D., Wosnitzer M.S., et. al.: Prostate volume and pathologic prostate cancer outcomes after radical prostatectomy. Urology 2007; 70: pp. 696-701.
10. Porcaro A.B., Novella G., Molinari A., et. al.: Prostate volume index and chronic inflammation of the prostate type IV with respect to the risk of prostate cancer. Urol Int 2015; 94: pp. 270-285.
11. Cher M.L., Dhir A., Auffenberg G.B., et. al.: Appropriateness criteria for active surveillance of prostate cancer. J Urol 2017; 197: pp. 67-74.
12. Eskicorapci S.Y., Guliyev F., Akdogan B., et. al.: Individualization of the biopsy protocol according to the prostate gland volume for prostate cancer detection. J Urol 2005; 173: pp. 1536-1540.
13. Kucway R., Vicini F., Huang R., et. al.: Prostate volume reduction with androgen deprivation therapy before interstitial brachytherapy. J Urol 2002; 167: pp. 2443-2447.
14. Roehrborn C.G., Girman C.J., Rhodes T., et. al.: Correlation between prostate size estimated by digital rectal examination and measured by transrectal ultrasound. Urology 1997; 49: pp. 548-557.
15. Ghose S., Oliver A., Marti R., et. al.: Statistical shape and texture model of quadrature phase information for prostate segmentation. Int J Comput Assist Radiol Surg 2012; 7: pp. 43-55.
16. Toth R., Bloch B.N., Genega E.M., et. al.: Accurate prostate volume estimation using multifeature active shape models on T2-weighted MRI. Acad Radiol 2011; 18: pp. 745-754.
17. Eri L.M., Thomassen H., Brennhovd B., et. al.: Accuracy and repeatability of prostate volume measurements by transrectal ultrasound. Prostate Cancer Prostatic Dis 2002; 5: pp. 273-278.
18. Littrup P.J., Kane R.A., Williams C.R., et. al.: Determination of prostate volume with transrectal US for cancer screening. Part I. Comparison with prostate-specific antigen assays. Radiology 1991; 178: pp. 537-542.
19. Smith W.L., Lewis C., Bauman G., et. al.: Prostate volume contouring: a 3D analysis of segmentation using 3DTRUS, CT, and MR. Int J Radiat Oncol Biol Phys 2007; 67: pp. 1238-1247.
20. Ghose S., Oliver A., Marti R., et. al.: A survey of prostate segmentation methodologies in ultrasound, magnetic resonance and computed tomography images. Comput Methods Programs Biomed 2012; 108: pp. 262-287.
21. Turkbey B., Fotin S.V., Huang R.J., et. al.: Fully automated prostate segmentation on MRI: comparison with manual segmentation methods and specimen volumes. AJR Am J Roentgenol 2013; 201: pp. W720-W729.
22. Mazaheri Y., Goldman D.A., Di Paolo P.L., et. al.: Comparison of prostate volume measured by endorectal coil MRI to prostate specimen volume and mass after radical prostatectomy. Acad Radiol 2015; 22: pp. 556-562.
23. Paterson N.R., Lavallee L.T., Nguyen L.N., et. al.: Prostate volume estimations using magnetic resonance imaging and transrectal ultrasound compared to radical prostatectomy specimens. Can Urol Assoc J 2016; 10: pp. 264-268.
24. Lee J.S., Chung B.H.: Transrectal ultrasound versus magnetic resonance imaging in the estimation of prostate volume as compared with radical prostatectomy specimens. Urol Int 2007; 78: pp. 323-327.
25. Schned A.R., Wheeler K.J., Hodorowski C.A., et. al.: Tissue-shrinkage correction factor in the calculation of prostate cancer volume. Am J Surg Pathol 1996; 20: pp. 1501-1506.
26. Hsieh T.F., Chang C.H., Chen W.C., et. al.: Correlation of Gleason scores between needle-core biopsy and radical prostatectomy specimens in patients with prostate cancer. J Chin Med Assoc 2005; 68: pp. 167-171.