
Rationale and Objectives
The study aimed to determine the relationship between T2-weighted magnetic resonance imaging (MRI) signal and histologic sub-patterns in prostate cancer areas with different Gleason grades.
Materials and Methods
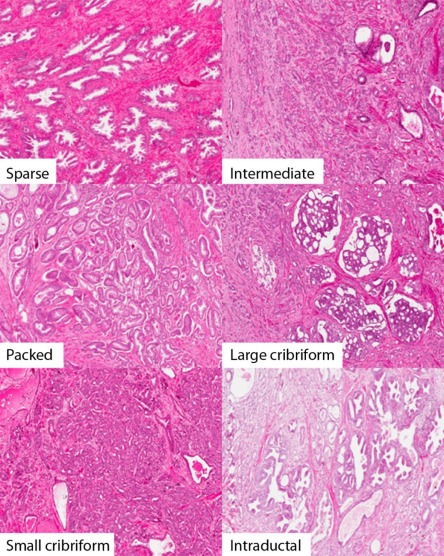
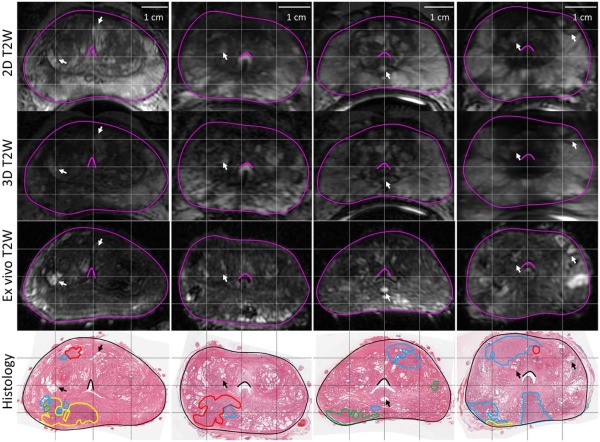
MR images of prostates ( n = 25) were obtained prior to radical prostatectomy. These were processed as whole-mount specimens with tumors and the peripheral zone was annotated digitally by two pathologists. Gleason grade 3 was the most prevalent grade and was subdivided into packed, intermediate, and sparse based on gland-to-stroma ratio. Large cribriform, intraductal carcinoma, and small cribriform glands (grade 4 group) were separately annotated but grouped together for statistical analysis. The log MRI signal intensity for each contoured region ( n = 809) was measured, and pairwise comparisons were performed using the open-source software R version 3.0.1.
Results
Packed grade 3 sub-pattern has a significantly lower MRI intensity than the grade 4 group ( P < 0.00001). Sparse grade 3 has a significantly higher MRI intensity than the packed grade 3 sub-pattern ( P < 0.0001). No significant difference in MRI intensity was observed between the Gleason grade 4 group and the sparse sub-pattern grade 3 group ( P = 0.54). In multivariable analysis adjusting for peripheral zone, the P values maintained significance (packed grade 3 group vs grade 4 group, P < 0.001; and sparse grade 3 sub-pattern vs packed grade 3 sub-pattern, P < 0.001).
Conclusions
This study demonstrated that T2-weighted MRI signal is dependent on histologic sub-patterns within Gleason grades 3 and 4 cancers, which may have implications for directed biopsy sampling and patient management.
Introduction
Prostatic adenocarcinoma is the most frequently diagnosed solid organ tumor in men and the second most common cause of male mortality in the western world . Early diagnosis facilitates appropriate management and may improve patient outcome . Transrectal ultrasound guided biopsy is performed to confirm the diagnosis following a serum prostate-specific antigen test and digital rectal examination. This technique randomly samples a small percentage of the prostate and may underestimate the aggressiveness of the disease . As the Gleason score of the biopsy will help dictate management, improved targeting and sampling of tumor foci will help refine individual patient options, specifically by differentiating patients with cancer requiring radical therapy (surgery and external beam radiotherapy) from those who may benefit from newer focal therapies (high intensity focused ultrasound, interstitial brachytherapy, etc), and also help appropriately stratify patients to active surveillance .
T2-weighted (T2W) magnetic resonance imaging (MRI) is an important part of the current multiparametric MRI paradigm but by itself localizes tumors within the prostate with insufficient accuracy . Studies addressing the correlation of MRI findings and histopathologic tumor assessment at radical prostatectomy have been performed , and specifically previous papers have shown that several pathologic characteristics can be determined with MRI-derived parameters, including tumor volume , cell density , intermixed benign tissue , stromal type , percentage area of tissue components , cancer aggressiveness , and histologic architecture .
Get Radiology Tree app to read full this article<
Materials and Methods
Subjects
Get Radiology Tree app to read full this article<
Table 1
Clinicopathologic Features of 25 Study Participants
Patient Age Biopsy Gleason Score Days Between MRI and Surgery Gland Volume (cc) Preoperative PSA (ng/mL) Prostatectomy Gleason Score T-stage Margins 1 62 3 + 3 9 35.9 5.45 4 + 3 pT2c Negative 2 64 3 + 4 27 31.0 4.3 3 + 4 pT3a Negative 3 59 3 + 4 34 37.1 4.46 3 + 4 pT2c Negative 4 53 3 + 3 7 26.0 3.71 3 + 4 pT2c Negative 5 64 3 + 3 14 39.2 10.26 3 + 4 pT3a Negative 6 56 NA 2 23.1 3.93 3 + 3 pT3a Positive 7 67 3 + 3 15 41.0 5.29 3 + 3 pT2c Negative 8 44 3 + 3 34 23.6 1.25 3 + 3 pT2c Positive 9 58 3 + 3 16 40.2 5.33 3 + 3 pT2c Negative 10 64 3 + 3 8 52.1 6.32 3 + 4 pT3a Negative 11 53 3 + 3 15 34.2 5.15 3 + 4 pT2c Negative 12 62 3 + 4 13 52.5 3.46 3 + 4 pT2c Negative 13 60 3 + 3 2 33.8 4.39 3 + 3 pT3a Negative 14 60 3 + 4 20 29.4 4.81 3 + 4 pT2c Negative 15 63 3 + 4 5 22.9 4.66 3 + 3 pT2c Positive 16 69 3 + 3 1 41.6 4.12 3 + 4 pT2c Negative 17 66 3 + 4 9 61.9 4.3 3 + 4 pT2c Negative 18 70 3 + 4 6 34.4 9.03 3 + 4 pT3b Negative 19 64 3 + 3 9 29.2 7.1 3 + 4 pT3a Negative 20 71 3 + 4 6 29.3 4.22 3 + 4 pT3a Negative 21 59 3 + 3 9 47.5 4.41 3 + 4 pT2c Negative 22 58 3 + 3 34 42.5 18.76 3 + 3 pT2c Positive 23 63 3 + 3 15 46.4 4.71 3 + 3 pT2c Negative 24 56 3 + 3 15 28.8 4.57 3 + 4 pT2c Positive 25 67 3 + 4 20 48.4 11.23 3 + 4 pT2c Negative
MRI, magnetic resonance imaging; PSA, prostate-specific antigen.
Due to potential sampling issues and possible undergrading on biopsy, the option of radical prostatectomy was made available to men with biopsy Gleason score 6 prostate cancer.
Get Radiology Tree app to read full this article<
MRI
Get Radiology Tree app to read full this article<
Table 2
T2W Protocol Parameters
Sequence Clinical T2W High-resolution T2W Ex Vivo T1W Ex Vivo T2W Protocol Fast spin echo (FSE) 3D fast spin echo (3D FSE) 3D spoiled gradient echo 3D fast spin echo (3D FSE) Repetition time (ms) 3800–12,800 2000 6.4–6.5 2000 Echo time (ms) 155–165 144–177 2.3–2.8 146–170 Bandwidth (kHz) 31.25 125 31.25 62.5–125 Number of excitations 2 0.5–2 8–16 3–8 Field of view (cm) 14 14 14 14 Slice thickness (mm) 2.2 1.4 0.4–0.6 0.4–0.6 Slice spacing (mm) 2.2 0.7 0.2–0.3 0.2–0.3 Matrix 320 × 192 320 × 192 256 × 192 320 × 192 Number of slices 29–46 84–144 204–312 204–312 Flip angle (°) 90 90 15 90
3D, three-dimensional; T1W, T1-weighted; T2W, T2-weighted.
Get Radiology Tree app to read full this article<
Get Radiology Tree app to read full this article<
Histology
Get Radiology Tree app to read full this article<
Annotations
Get Radiology Tree app to read full this article<
Get Radiology Tree app to read full this article<
Coregistration
Get Radiology Tree app to read full this article<
Get Radiology Tree app to read full this article<
Get Radiology Tree app to read full this article<
Get Radiology Tree app to read full this article<
on a total of 1482 control point pairs across 25 patient image pairs), the rigid coregistration of the in vivo images (0.7 ± 0.1 mm, measured using identified pairs of homologous landmarks across three patient images), and the histology reconstruction (0.7 ± 0.4 mm, previously quantified ).
Get Radiology Tree app to read full this article<
Get Radiology Tree app to read full this article<
Statistics
Get Radiology Tree app to read full this article<
Get Radiology Tree app to read full this article<
Get Radiology Tree app to read full this article<
Results
Get Radiology Tree app to read full this article<
Get Radiology Tree app to read full this article<
Get Radiology Tree app to read full this article<
Table 3
Pairwise Comparisons of Annotations, n = 809 Contours
Average Difference in MRI Intensity, Log Scale 95% CI_P_ value Overall <0.0001 LC/IDC/SC versus intermediate grade 3 0.17 0.06 to 0.28 2.8 × 10 −3 Packed grade 3 versus intermediate grade 3 −0.16 −0.28 to −0.04 0.011 Sparse grade 3 versus intermediate grade 3 0.13 0.04 to 0.23 7.1 × 10 −3 Packed grade 3 versus LC/IDC/SC −0.33 −0.47 to −0.19 2.5 × 10 −6 Sparse grade 3 versus LC/IDC/SC −0.04 −0.16 to 0.09 0.54 Sparse grade 3 versus packed grade 3 0.29 0.15 to 0.43 3.4 × 10 −5
CI, confidence interval; IDC, intraductal carcinoma; LC, large cribriform; MRI, magnetic resonance imaging; SC, small cribriform.
Get Radiology Tree app to read full this article<
Get Radiology Tree app to read full this article<
Table 4
Pairwise Comparisons of Annotations by Subgroup, n = 809 Contours
Average Difference in MRI Intensity, Log Scale 95% CI_P_ value PZ contours, n = 554 0.26 LC/IDC/SC versus intermediate grade 3 0.08 −0.04 to 0.19 0.21 Packed grade 3 versus intermediate grade 3 −0.09 −0.24 to 0.07 0.27 Sparse grade 3 versus intermediate grade 3 0.03 −0.07 to 0.14 0.52 Packed grade 3 versus LC/IDC/SC −0.16 −0.33 to 0.005 0.058 Sparse grade 3 versus LC/IDC/SC −0.04 −0.18 to 0.09 0.55 Sparse grade 3 versus packed grade 3 0.12 −0.05 to 0.29 0.16 Non-PZ contours, n = 255 LC/IDC/SC versus intermediate grade 3 0.15 −0.03 to 0.34 0.10 Packed grade 3 versus intermediate grade 3 −0.17 −0.33 to 0.001 0.051 Sparse grade 3 versus intermediate grade 3 0.05 −0.07 to 0.18 0.40 Packed grade 3 versus LC/IDC/SC −0.32 −0.53 to −0.11 0.0031 Sparse grade 3 versus LC/IDC/SC −0.10 −0.29 to 0.09 0.31 Sparse grade 3 versus packed grade 3 0.22 0.03 to 0.41 0.021
CI, confidence interval; IDC, intraductal carcinoma; LC, large cribriform; MRI, magnetic resonance imaging; PZ, peripheral zone; SC, small cribriform.
Get Radiology Tree app to read full this article<
Get Radiology Tree app to read full this article<
Get Radiology Tree app to read full this article<
Table 5
Pairwise Comparisons of Annotations, Adjusted for Peripheral Zone, n = 809 Contours
Average Difference in MRI Intensity, Log Scale 95% CI_P_ value Annotation <0.0001 LC/IDC/SC versus intermediate grade 3 0.12 0.02 to 0.22 0.023 Packed grade 3 versus intermediate grade 3 −0.13 −0.24 to −0.01 0.032 Sparse grade 3 versus intermediate grade 3 0.11 0.03 to 0.20 0.011 Packed grade 3 versus LC/IDC/SC −0.25 −0.38 to −0.11 0.00019 Sparse grade 3 versus LC/IDC/SC −0.0063 −0.12 to 0.11 0.92 Sparse grade 3 versus packed grade 3 0.24 0.11 to 0.37 0.00026 Peripheral zone 0.36 0.29 to 0.43 <0.0001
CI, confidence interval; IDC, intraductal carcinoma; LC, large cribriform; MRI, magnetic resonance imaging; SC, small cribriform.
Get Radiology Tree app to read full this article<
Discussion
Get Radiology Tree app to read full this article<
Get Radiology Tree app to read full this article<
Get Radiology Tree app to read full this article<
Get Radiology Tree app to read full this article<
Get Radiology Tree app to read full this article<
Get Radiology Tree app to read full this article<
Get Radiology Tree app to read full this article<
Get Radiology Tree app to read full this article<
Get Radiology Tree app to read full this article<
Conclusions
Get Radiology Tree app to read full this article<
Supplementary Data
Get Radiology Tree app to read full this article<
Appendix S1
Get Radiology Tree app to read full this article<
Get Radiology Tree app to read full this article<
Get Radiology Tree app to read full this article<
References
1. Siegel R., Ma J., Zou Z., et. al.: Cancer statistics, 2014. CA Cancer J Clin 2014; 64: pp. 9-29.
2. LaSpina M., Haas G.P.: Update on the diagnosis and management of prostate cancer. Can J Urol 2008; 15: pp. 3-13.
3. Kvale R., Moller B., Wahlqvist R., et. al.: Concordance between Gleason scores of needle biopsies and radical prostatectomy specimens: a population based study. BJU Int 2009; 103: pp. 1647-1654.
4. Steinberg D.M., Sauvageot J., Piantadosi S., et. al.: Correlation of prostate needle biopsy and radical prostatectomy Gleason grade in academic and community settings. Am J Surg Pathol 1997; 21: pp. 566-576.
5. Klotz L., Emberton M.: Management of low risk prostate cancer: active surveillance and focal therapy. Nat Rev Clin Oncol 2014; 11: pp. 324-334.
6. Haider M.A., van der Kwast T.H., Tanguay J., et. al.: Combined T2-weighted and diffusion weighted MRI for localization of prostate cancer. AJR Am J Roentgenol 2007; 189: pp. 323-328.
7. Wu L.M., Xu J.R., Ye Y.Q., et. al.: The clinical value of diffusion-weighted imaging in combination with T2-weighted imaging in diagnosing prostate carcinoma: a systematic review and meta-analysis. AJR Am J Roentgenol 2012; 199: pp. 103-110.
8. Graser A., Heuck A., Sommer B., et. al.: Per-sextant localization and staging of prostate cancer: correlation of imaging findings with whole-mount step section histopathology. AJR Am J Roentgenol 2007; 188: pp. 84-90.
9. Rosenkrantz A.B., Mendrinos S., Babb J.S., et. al.: Prostate cancer foci detected on multiparametric magnetic resonance imaging are histologically distinct from those not detected. J Urol 2012; 187: pp. 2032-2038.
10. Wefer A.E., Hricak H., Vigneron D.B., et. al.: Sextant localization of prostate cancer: comparison of sextant biopsy, magnetic resonance imaging and magnetic resonance spectroscopic imaging with step section histology. J Urol 2000; 164: pp. 400-404.
11. Mazaheri Y., Hricak H., Fine S.W., et. al.: Prostate tumor volume measurement with combined T2-weighted imaging and diffusion weighted MR: correlation with pathologic tumor volume. Radiology 2009; 252: pp. 449.
12. Gibbs P., Liney T., Pickles M.D., et. al.: Correlation of ADC and T2 measurements with cell density in prostate cancer at 3.0 Tesla. Invest Radiol 2009; 44: pp. 572.
13. Langer D.L., van der Kwast T.H., Evans A.J., et. al.: Intermixed normal tissue within prostate cancer: effect on MR imaging measurements of apparent diffusion coefficient and T2-sparse versus dense cancers. Radiology 2008; 249: pp. 900-908.
14. Langer D.L., van der Kwast T.H., Evans A.J., et. al.: Prostate tissue composition and MR measurements: investigating the relationships between ADC, T2, K trans , v e and corresponding histologic features. Radiology 2010; 255: pp. 485-494.
15. Vos E.K., Litjens G.J.S., Kobus T., et. al.: Assessment of prostate cancer aggressiveness using dynamic contrast-enhanced magnetic resonance imaging at 3T. Eur Urol 2013; 64: pp. 448-455.
16. Bratan F., Niaf E., Melodelima C., et. al.: Influence of imaging and histological factors on prostate cancer detection and localisation on multiparametric MRI: a prospective study. Eur Radiol 2013; 23: pp. 2019-2029.
17. Trudel D., Downes M.R., Sykes J., et. al.: Prognostic impact of intraductal carcinoma and large cribriform carcinoma architecture after prostatectomy in a contemporary cohort. Eur J Cancer 2014; 50: pp. 1610-1616.
18. Dong F., Yang P., Wang C., et. al.: Architectural heterogeneity and cribriform pattern predict adverse clinical outcome for Gleason grade 4 prostatic adenocarcinoma. Am J Surg Pathol 2013; 37: pp. 1855-1861.
19. Kryvenko O.N., Gupta N.S., Virani N., et. al.: Gleason score 7 adenocarcinoma of the prostate with lymph node metastases: analysis of 184 radical prostatectomy specimens. Arch Pathol Lab Med 2013; 137: pp. 610-617.
20. Epstein J.I., Allsbrook W.C., Amin M.B., et. al.: The 2005 International Society of Urological Pathology (ISUP) consensus conference on Gleason grading of prostatic carcinoma. Am J Surg Pathol 2005; 29: pp. 1228-1242.
21. Gibson E., Crukley C., Gaed M., et. al.: Registration of prostate histology images to ex-vivo MR images via strand-shaped fiducials. J Magn Reson Imaging 2012; 36: pp. 1402-1412.
22. Ward A.D., Crukley C., McKenzie C.A., et. al.: Prostate: registration of digital histopathologic images to in vivo MR images acquired by using endorectal receive coil. Radiology 2012; 263: pp. 856-864.
23. Tustison N.J., Gee J.C.: N4ITK: Nick’s N3 ITK implementation for MRI bias field correction. Insight J 2009; Available at: http://hdl.handle.net/10380/3053
24. Samaratunga H., Montironi R., True L., et. al.: International Society of Urological Pathology (ISUP) consensus conference on handling and staging of radical prostatectomy specimens. Working group 1: specimen handling. Mod Pathol 2011; 24: pp. 6-15.
25. Gibson E., Gaed M., Gómez J.A., et. al.: 3D prostate histology image reconstruction: quantifying the impact of tissue deformation and histology section location. J Pathol Inform 2013; 4: pp. 31.
26. Bookstein F.L.: Principal warps: thin-plate splines and the decomposition of deformations. IEEE Trans Pat Anal Mach Intel 1989; 11: pp. 567-585.
27. Cheung M.R., Krishnan K.: Interactive deformation registration of endorectal prostate MRI using ITK thin plate splines. Acad Radiol 2009; 16: pp. 351-357.
28. R Core Team : R: a language and environment for statistical computing.2013.R Foundation for Statistical ComputingVienna, Austria Available at: http://www.R-project.org/
29. Phillips M.E., Kressel H.Y., Spritzer C.E., et. al.: Normal prostate and adjacent structures: MR imaging at 1.5T. Radiology 1987; 164: pp. 381-385.
30. Hricak H., Dooms G.C., McNeal J.E., et. al.: MR imaging of the prostate gland: normal anatomy. AJR Am J Roentgenol 1987; 148: pp. 51-58.
31. Ali J.H., Wang W.B., Zevallos M., et. al.: Near infrared spectroscopy and imaging to probe differences in water content in normal and cancer human prostate tissues. Technol Cancer Res Treat 2004; 3: pp. 491-497.
32. Wang L., Mazaheri Y., Zhang J., et. al.: Assessment of biologic aggressiveness of prostate cancer: correlation of MR signal intensity with Gleason grade after radical prostatectomy. Radiology 2008; 246: pp. 168-176.
33. Fuchsjager M., Shukla-Dave A., Akin O., et. al.: Prostate cancer imaging. Acta Radiol 2008; 49: pp. 107-120.
34. Foltz W.D., Chopra S., Chung P., et. al.: Clinical prostate T2 quantification using magnetization-prepared spiral imaging. Magn Reson Med 2010; 64: pp. 1155-1161.
35. Dregely I., Margolis D.A., Sung K., et. al.: Rapid quantitative T2 mapping of the prostate using three-dimensional dual echo steady state MRI at 3T. Magn Reson Med 2016;
36. Rosenkrantz A.B., Taneja S.S.: Radiologist, be aware: ten pitfalls that confound the interpretation of multiparametric prostate MRI. AJR Am J Roentgenol 2014; 202: pp. 109-120.
37. Weinreb J.C., Barentsz J.O., Choyke P.L., et. al.: PI-RADS prostate imaging-reporting and data system: 2015. Eur Urol 2016; 69: pp. 16-40.
38. Vos P.C., Hambrock T., Barenstz J.O., et. al.: Computer-assisted analysis of peripheral zone prostate lesions using T2-weighted and dynamic contrast enhanced T1-weighted MRI. Phys Med Biol 2010; 55: pp. 1719-1734.
39. Noworolski S.M., Reed G.D., Kurhanewicz J., et. al.: Post-processing correction of the endorectal coil reception effects in MR spectroscopic imaging of the prostate. J Magn Reson Imaging 2010; 32: pp. 654-662.
40. Akin O., Sala E., Moskowitz C.S., et. al.: Transition zone prostate cancers: features, detection, localization and staging at endorectal MR imaging. Radiology 2006; 239: pp. 784-792.
41. Gibson E., Fenster A., Ward A.D., et. al.: The impact of registration accuracy on imaging validation study design: a novel statistical power calculation. Med Image Anal 2013; 17: pp. 805-815.
42. Kobus T., Hambrock T., Hulsbergen-van de Kaa C.A., et. al.: In vivo assessment of prostate cancer aggressiveness using magnetic resonance spectroscopic imaging at 3T with an endorectal coil. Eur Urol 2011; 60: pp. 1074-1080.
43. Padhani A.R., Gapinski C.J., Macvicar D.A., et. al.: Dynamic contrast enhanced MRI of prostate cancer; correlation with morphology and tumor stage, histological grade and PSA. Clin Radiol 2000; 55: pp. 99-109.
44. Hambrock T., Somford D.M., Huisman H.J., et. al.: Relationship between apparent diffusion coefficients at 3.0-T MR imaging and Gleason grade in peripheral zone prostate cancer. Radiology 2011; 259: pp. 453-461.
45. Vargas H.A., Akin O., Franiel T., et. al.: Diffusion-weighted endorectal MR imaging at 3T for prostate cancer: tumor detection and assessment of aggressiveness. Radiology 2011; 259: pp. 775-784.
46. Kimura K., Tsuzuki T., Kato M., et. al.: Prognostic value of intraductal carcinoma of the prostate in radical prostatectomy specimens. Prostate 2014; 74: pp. 680-687.
47. Barentsz J.O., Weinreb J.C., Verma S., et. al.: Synopsis of the PI-RADS v2 guidelines for multiparametric prostate magnetic resonance imaging and recommendations for use. Eur Urol 2016; 69: pp. 41-49.