
Rationale and Objectives
Development and evaluation of a software tool for the insertion of simulated hypodense liver lesions in multidetector-row computed tomography (CT) datasets.
Materials and Methods
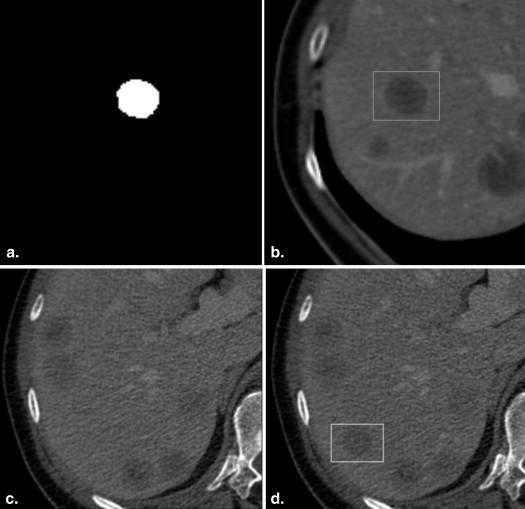
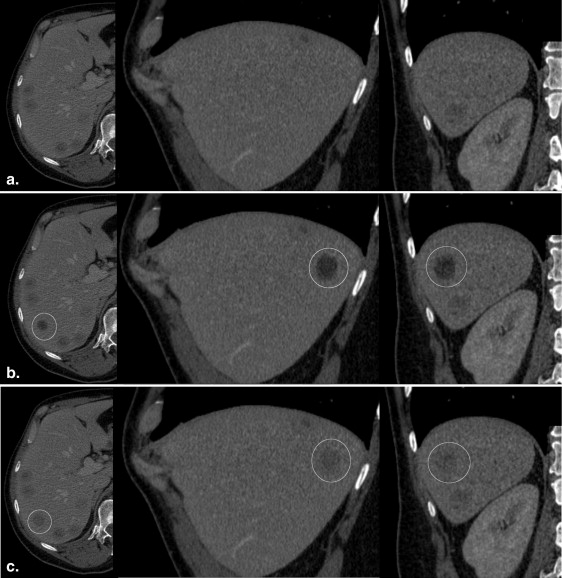
Forty software-generated hypodense liver lesions were inserted at random locations in 20 CT datasets by using the “alpha blending” technique and compared with 40 real metastatic lesions. The location, diameter (5–20 mm) and density of the simulated lesions were individually adjusted to closely resemble real lesions in each patient. Three blinded readers evaluated all 80 lesions twice in a 2-week interval using a five-point Likert confidence scale under standardized conditions. Nonparametric tests were used to statistically evaluate possible differences in scoring between real and simulated lesions. The correctness of the observer rating for real and simulated lesions was compared to chance distribution using the chi-squared statistics. The inter- and intraobserver variability was determined using Kendall’s coefficient of concordance.
Results
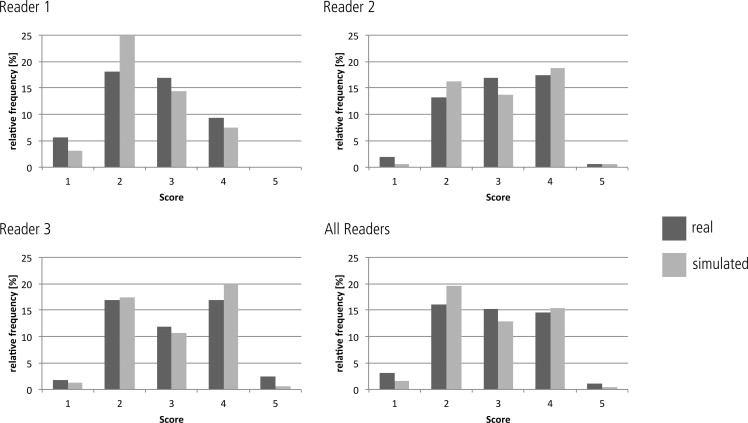
The observer study did not reveal significant differences between the scoring for real versus simulated lesions for any of the readers ( P > .05). The distribution of correct and false scoring of the lesions was not significantly different from chance distribution ( P > .05). Inter- and intraobserver agreement was poor (Kendall W coefficient = 0.12/0.13).
Conclusion
The proposed algorithm is suitable for creating realistic virtual liver lesions in CT datasets.
Since its introduction in 1972, computed tomography (CT) has become an indispensable diagnostic tool of modern medicine. Its use has increased rapidly, especially during the last two decades, mainly driven by an enormous technical development that continuously broadens its diagnostic possibilities . State-of-the-art multidetector CT (MDCT) scanners allow the routine acquisition of nearly isotropic datasets with submillimeter voxel dimensions at a comfortable breathhold of less than 10 seconds. To manage the resultant increasing amount of image data, computer-based visualization and analysis tools have been developed that aim at supporting radiologists . Computer-aided detection (CAD) algorithms in chest CT , virtual colonoscopy , and breast diagnostics are even intended to act as a second independent reader to improve diagnostic accuracy. Other tools assist liver imaging by providing means for automated lesion detection and characterization as well as lesion quantification during longitudinal follow-up . These tools need to be carefully evaluated before they can be introduced into routine clinical use. Therefore, large well-defined lesion databases are desirable which are time-consuming and cost-intensive to develop. Computer-generated software phantoms have been proposed to facilitate the systematic testing and validation of postprocessing tools and they have been successfully used in chest CT . Because soft-tissue organs such as the liver are frequently affected by metastatic disease and lesion size is regarded as a surrogate marker of tumor response during longitudinal follow-up, a comprehensive database of virtual lesions is of potential benefit as well .
Therefore, the aim of our study was to develop a software tool for the creation of virtual liver lesions and to evaluate whether these simulated lesions are distinguishable from real lesions by human readers.
Materials and methods
Software Phantom
Get Radiology Tree app to read full this article<
Get Radiology Tree app to read full this article<
Get Radiology Tree app to read full this article<
Get Radiology Tree app to read full this article<
Get Radiology Tree app to read full this article<
C=αAA+(1−αAA)B C
=
α
A
A
+
(
1
−
α
A
A
)
B
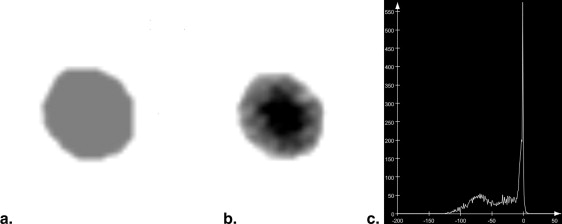
where A is the density value of the lesion to be inserted, α__A is the opacity of A , B is the density value of the background, and C is the resulting density value.
Get Radiology Tree app to read full this article<
Get Radiology Tree app to read full this article<
Phantom Evaluation
Get Radiology Tree app to read full this article<
Get Radiology Tree app to read full this article<
Get Radiology Tree app to read full this article<
Statistical Analysis
Get Radiology Tree app to read full this article<
Results
Get Radiology Tree app to read full this article<
Get Radiology Tree app to read full this article<
Get Radiology Tree app to read full this article<
Get Radiology Tree app to read full this article<
Discussion
Get Radiology Tree app to read full this article<
Get Radiology Tree app to read full this article<
Get Radiology Tree app to read full this article<
Get Radiology Tree app to read full this article<
Get Radiology Tree app to read full this article<
Get Radiology Tree app to read full this article<
Get Radiology Tree app to read full this article<
Get Radiology Tree app to read full this article<
Conclusion
Get Radiology Tree app to read full this article<
References
1. Mettler F.A., Bhargavan M., Faulkner K., et. al.: Radiologic and nuclear medicine studies in the United States and worldwide: frequency, radiation dose, and comparison with other radiation sources–1950-2007. Radiology 2009; 253: pp. 520-531.
2. Rubin G.D.: 3-D imaging with MDCT. Eur J Radiol 2003; 45: pp. 37-41.
3. Dalrymple N.C., Prasad S.R., Freckleton M.W., et. al.: Informatics in radiology (infoRAD): introduction to the language of three-dimensional imaging with multidetector CT. Radiographics 2005; 25: pp. 1409-1428.
4. Rubin G.D., Lyo J.K., Paik D.S., et. al.: Pulmonary nodules on multi-detector row CT scans: performance comparison of radiologists and computer-aided detection. Radiology 2005; 234: pp. 274-283.
5. White C.S., Pugatch R., Koonce T., et. al.: Lung nodule CAD software as a second reader: a multicenter study. Acad Radiol 2008; 15: pp. 326-333.
6. Beyer F., Zierott L., Fallenberg E.M., et. al.: Comparison of sensitivity and reading time for the use of computer-aided detection (CAD) of pulmonary nodules at MDCT as concurrent or second reader. Eur Radiol 2007; 17: pp. 2941-2947.
7. Koshkin V.S., Hinshaw J.L., Wroblewski K., et. al.: CAD-associated reader error in CT colonography. Acad Radiol 2012; 19: pp. 801-810.
8. Halligan S., Mallett S., Altman D.G., et. al.: Incremental benefit of computer-aided detection when used as a second and concurrent reader of CT colonographic data: multiobserver study. Radiology 2011; 258: pp. 469-476.
9. Dromain C., Boyer B., Ferré R., et. al.: Computed-aided diagnosis (CAD) in the detection of breast cancer. Eur J Radiol 2012 Aug 29; [Epub ahead of print] PubMed PMID: 22939365
10. Onega T., Aiello Bowles E.J., Miglioretti D.L., et. al.: Radiologists’ perceptions of computer aided detection versus double reading for mammography interpretation. Acad Radiol 2010; 17: pp. 1217-1226.
11. Huang Y.L., Chen J.H., Shen W.C.: Diagnosis of hepatic tumors with texture analysis in nonenhanced computed tomography images. Acad Radiol 2006; 13: pp. 713-720.
12. Bilello M., Gokturk S.B., Desser T., et. al.: Automatic detection and classification of hypodense hepatic lesions on contrast-enhanced venous-phase CT. Med Phys 2004; 31: pp. 2584-2593.
13. Kalkmann J., Ladd S.C., de Greiff A., et. al.: Suitability of semi-automated tumor response assessment of liver metastases using a dedicated software package. Rofo 2010; 182: pp. 581-588.
14. Punwani S., Zhang J., Davies W., et. al.: Paediatric CT: the effects of increasing image noise on pulmonary nodule detection. Pediatr Radiol 2008; 38: pp. 192-201.
15. Moltz J.H., D’Anastasi M., Kießling A., et. al.: Workflow-centred evaluation of an automatic lesion tracking software for chemotherapy monitoring by CT. Eur Radiol 2012; 22: pp. 2759-2767.
16. MeVisLab. Available at: http://www.mevislab.de . Accessed November 12, 2012.
17. Porter T, Duff T. Compositing digital images. Computer Graphics (SIGGRAPH 84 Processings) 1984; 18:254–259.
18. Landis J.R., Koch G.G.: The measurement of observer agreement for categorical data. Biometrics 1977; 33: pp. 159-174.
19. Fleiss J.L.: Statistical Methods for Rates and Proportions.2nd ed.1981.John WileyNew York, NY
20. von Falck C., Galanski M., Shin H.O.: Informatics in radiology: sliding-thin-slab averaging for improved depiction of low-contrast lesions with radiation dose savings at thin-section CT. Radiographics 2010; 30: pp. 317-326.
21. Boedeker K.L., McNitt-Gray M.F.: Application of the noise power spectrum in modern diagnostic MDCT: part II. Noise power spectra and signal to noise. Phys Med Biol 2007; 52: pp. 4047-4061.
22. Bolte H., Riedel C., Müller-Hülsbeck S., et. al.: Precision of computer-aided volumetry of artificial small solid pulmonary nodules in ex vivo porcine lungs. Br J Radiol 2007; 80: pp. 414-421.
23. Farag A., Elhabian S., Graham J., et. al.: Modeling of the lung nodules for detection in LDCT scans. Conf Proc IEEE Eng Med Biol Soc 2010; 2010: pp. 3618-3621.
24. von Falck C., Rodt T., Waldeck S., et. al.: A systematic approach towards the objective evaluation of low-contrast performance in MDCT: combination of a full-reference image fidelity metric and a software phantom. Eur J Radiol 2012; 81: pp. 3166-3171.
25. Hoe C.L., Samei E., Frush D.P., et. al.: Simulation of liver lesions for pediatric CT. Radiology 2006; 238: pp. 699-705.
26. Funama Y., Awai K., Miyazaki O., et. al.: A computer-simulated liver phantom (virtual liver phantom) for multidetector computed tomography evaluation. Eur Radiol 2006; 16: pp. 837-845.