
Rationale and Objectives
The aim of this study was to assess the performance of a newly developed dual-energy (DE) chest radiographic system in comparison to digital radiographic (DR) imaging in the detection and characterization of lung nodules.
Materials and Methods
An experimental prototype was developed for high-performance DE chest imaging, with total dose equivalent to a single posterior-anterior DR image. Projections at low and high peak kilovoltage were used to decompose DE soft tissue and bone images. A cohort of 55 patients (31 men, 24 women; mean age, 65.6 years) was drawn from an ongoing trial involving patients referred for percutaneous computed tomography–guided biopsy of suspicious lung nodules. DE and DR images were acquired of each patient prior to biopsy. Image quality was assessed by means of human observer tests involving five radiologists independently rating the detection and characterization of lung nodules on a nine-point scale. Results were analyzed in terms of the fraction of cases at or above a given rating, and statistical significance was evaluated using Wilcoxon’s signed-rank test. Performance was analyzed for all cases pooled as well as by stratification of nodule size, density, lung region, and chest thickness.
Results
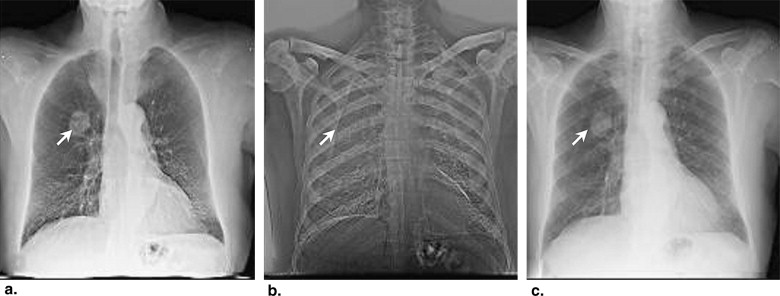
The studies demonstrated a significant performance advantage for DE imaging compared to DR imaging ( P < .001) in the detection and characterization of lung nodules. DE imaging improved the detection of both small and large nodules and exhibited the most significant improvement in regions of the upper lobes, where overlying anatomic noise (ribs and clavicles) are believed to reduce nodule conspicuity on DR imaging.
Conclusions
DE imaging outperformed DR imaging overall, particularly in the detection of small, solid nodules. DE imaging also performed better in regions dominated by anatomic noise, such as the lung apices. The potential for improved nodule detection and characterization at radiation doses equivalent to DR imaging is encouraging and could augment the broader use of DE imaging. Future studies will extend the initial cohort and rating scale tests to a larger cohort evaluated by receiver-operating characteristic analysis and will evaluate DE imaging in comparison and as an adjuvant to low-dose computed tomography.
Because the prognosis for advanced-stage lung cancer is extremely poor, early detection is a major priority . X-ray projection imaging (screen film, computed radiography, or digital radiography) is still the most common tool in chest radiology, in part because of its low dose, low cost, and high work flow efficiency, but it is known to exhibit poor sensitivity in the detection of small, subtle pulmonary nodules . A major limiting factor is anatomic clutter superimposed within the projection, which can impede the detection and characterization of subtle lung nodules . To mitigate this limitation, dual-energy (DE) imaging acquires two projections of the patient at different x-ray energies and selectively decomposes the image into soft tissue and bone components. The former presents soft tissue structures in a context that is largely free from the main source of anatomic clutter (the ribs and clavicles), thus improving the conspicuity of subtle nodules . Furthermore, because the presence of calcification is an important indicator of benignancy, DE imaging could help characterize benign lesions with a higher level of specificity .
Previous studies have investigated single- and dual-exposure DE imaging in comparison to conventional chest radiography , with each demonstrating increased detectability of lung nodules in DE images. A variety of DE imaging systems are commercially available and are finding broad clinical utilization, including single-shot computed radiographic systems (FCR XU-D1; Fujifilm, Tokyo, Japan) and double-shot flat-panel detector systems (XQ/I Revolution, GE Healthcare, Milwaukee, WI) featuring a 200-ms delay between low- and high-energy exposures. Kelcz et al established the advantage of DE images in terms of both the detection of nodules and the improved visibility of nodule calcification. More recently, investigators have described the use of a flat-panel detector in DE imaging to improve the detectability of lung nodules even further because of higher detective quantum efficiency compared to screen-film and computed radiographic systems . Higher detective quantum efficiency implies reduced image noise at equivalent dose or, alternatively, equivalent image quality at reduced dose, suggesting the possibility of lower dose DE imaging without a loss of diagnostic information.
Get Radiology Tree app to read full this article<
Get Radiology Tree app to read full this article<
Materials and methods
Volunteer Patient Cohort
Get Radiology Tree app to read full this article<
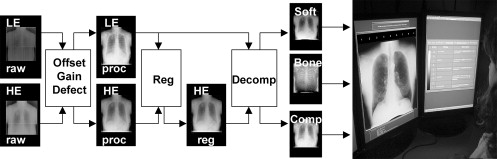
DE Imaging System
Get Radiology Tree app to read full this article<
Get Radiology Tree app to read full this article<
Get Radiology Tree app to read full this article<
Get Radiology Tree app to read full this article<
Get Radiology Tree app to read full this article<
ln(IDEsoft)=ln(IH)−wsln(IL), ln
(
I
soft
DE
)
=
ln
(
I
H
)
−
w
s
ln
(
I
L
)
,
ln(IDEbone)=ln(IH)+wbln(IL), ln
(
I
bone
DE
)
=
ln
(
I
H
)
+
w
b
ln
(
I
L
)
,
and
ln(IDEcomp)=ln(IH)+wcln(IL), ln
(
I
comp
DE
)
=
ln
(
I
H
)
+
w
c
ln
(
I
L
)
,
where the tissue cancellation parameters ( w s , w b , and w c ) were selected according to previous work that identified optimal settings (dependent on kVp selection) and were qualitatively validated during image decomposition by an expert observer (who was not among the observers in the performance evaluation described later). For this initial study, values of w s = 0.20 , w b = 0.57, and w c = 0.9 were identified as optimal and were judged to give acceptable tissue cancellation across all 55 patients. Future work will include more advanced means of patient-specific, automatically selected, spatially varying parameter selection and will consider the incorporation of w s and w b as parameters that may be freely varied by radiologists in a manner analogous to window level and width.
Get Radiology Tree app to read full this article<
Get Radiology Tree app to read full this article<
Get Radiology Tree app to read full this article<
Get Radiology Tree app to read full this article<
Get Radiology Tree app to read full this article<
Get Radiology Tree app to read full this article<
Observer Study
Get Radiology Tree app to read full this article<
Table 1
Satisfaction Rating Scale and Descriptions
Score Rating Description 9 Very satisfied The abnormality is perfectly obvious and easily characterized. 8 7 Satisfied The abnormality is visible and can be well characterized. 6 5 Neither satisfied nor dissatisfied The abnormality is reasonably well seen and characterized. 4 3 Dissatisfied The abnormality is visible, but detection and characterization of subtle features are a bit challenging . 2 1 Very dissatisfied The abnormality could be overlooked or mischaracterized.
This table was displayed to observers on a second monitor during all tests, as shown in Figure 1 .
Get Radiology Tree app to read full this article<
Get Radiology Tree app to read full this article<
Get Radiology Tree app to read full this article<
Get Radiology Tree app to read full this article<
Statistical Analysis
Fraction of Responses at or Above a Given Rating
Get Radiology Tree app to read full this article<
Get Radiology Tree app to read full this article<
∑Ndκ=0(Nκ)pκU(1−pU)N−κ=α2 ∑
κ
=
0
N
d
(
N
κ
)
p
U
κ
(
1
−
p
U
)
N
−
κ
=
α
2
and the lower bound as
∑Nd−1κ=0(Nκ)pκL(1−pL)N−κ=1−α2, ∑
κ
=
0
N
d
−
1
(
N
κ
)
p
L
κ
(
1
−
p
L
)
N
−
κ
=
1
−
α
2
,
where N is the total sample size, N d is the number of samples with the outcome of interest, p is the proportion of samples with the outcome of interest, p U is the upper bound of p , p L is the lower bound of p , and α (commonly fixed at 5%) is the type 1 error (ie, the probability of rejecting the null hypothesis when in fact the null hypothesis is correct). The results were similarly interpreted in terms of the P value (ie, the probability of obtaining the measured results if the null hypothesis were correct, also commonly taken as a statistically significant difference for P < .05). The data were complemented by 95% confidence intervals, as in Equations 2a and 2b , and plotted as error bars to indicate the limits within which the true difference between groups was expected to lie. The upper and lower bounds were calculated using the Newton-Raphson method in Matlab (The MathWorks, Natick, MA) to a precision of 1 × 10 −6 .
Get Radiology Tree app to read full this article<
Statistical Significance: P Value From Wilcoxon’s Signed-Rank Test
Get Radiology Tree app to read full this article<
Get Radiology Tree app to read full this article<
Stratification of the Results
Get Radiology Tree app to read full this article<
Table 2
Summary of Cases and Stratifications of the Data
Stratification Description Number of Cases Number of Readings_P_ Value All pooled 55 275 <.001 Lesion size (cm) ≤3 36 180 <.001 >3 19 95 .0264 Lesion density (Hounsfield units) <20 9 45 .0968 ≥20 46 230 <.001 Chest thickness (cm) ≤26 47 235 <.001 >26 8 40 .0015 Gender Male 31 155 <.001 Female 24 120 .0137 Region Right upper 20 100 .0012 Left upper 5 25 .0067 Right middle 4 20 .1800 Left middle 2 10 .0313 Right lower 8 40 .3625 Left lower 9 45 .0010 Mediastinum 7 35 .2455
The P values relate to the statistical significance in the difference between satisfaction with dual-energy and digital radiographic images, regarded as significant for P < .05.
Get Radiology Tree app to read full this article<
Results
All Cases Pooled
Get Radiology Tree app to read full this article<
Get Radiology Tree app to read full this article<
Stratification by Lesion Size
Get Radiology Tree app to read full this article<
Get Radiology Tree app to read full this article<
Stratification by Lesion Density
Get Radiology Tree app to read full this article<
![Figure 5, Diagnostic satisfaction in dual-energy (DE) and digital radiographic (DR) image readings stratified by lesion density. The curves show the fraction of responses at or above a given rating score for (a) nonsolid lesions (<20 Hounsfield units [HU]) and (b) solid lesions (≥20 HU). The error bars reflect 95% confidence intervals.](https://storage.googleapis.com/dl.dentistrykey.com/clinical/DevelopmentofaHighperformanceDualenergyChestImagingSystem/4_1s20S1076633208005758.jpg)
Get Radiology Tree app to read full this article<
Stratification by Chest Thickness
Get Radiology Tree app to read full this article<
Get Radiology Tree app to read full this article<
Stratification by Gender
Get Radiology Tree app to read full this article<
Get Radiology Tree app to read full this article<
Stratification by Region
Get Radiology Tree app to read full this article<
Get Radiology Tree app to read full this article<
Discussion
Get Radiology Tree app to read full this article<
Get Radiology Tree app to read full this article<
Get Radiology Tree app to read full this article<
Get Radiology Tree app to read full this article<
Get Radiology Tree app to read full this article<
Get Radiology Tree app to read full this article<
Get Radiology Tree app to read full this article<
Get Radiology Tree app to read full this article<
Get Radiology Tree app to read full this article<
Acknowledgments
Get Radiology Tree app to read full this article<
References
1. Kido S., Kuriyama K., Kuroda C., et. al.: Detection of simulated pulmonary nodules by single-exposure dual-energy computed radiography of the chest: effect of a computer-aided diagnosis system. Eur J Radiol 2002; 44: pp. 205-209.
2. Niklason L., Hickey N., Chakraborty D., et. al.: Simulated pulmonary nodules: Detection with dual-energy digital versus conventional radiography. Radiology 1986; 160: pp. 589-593.
3. Fraser R., Barnes G., Hickey N., et. al.: Potential value of digital radiography: preliminary observations on the use of dual-energy subtraction in the evaluation of pulmonary nodules. Chest 1986; 89: pp. 249S-252S.
4. Tagashira H., Arakawa K., Yoshimoto M., Mochizuki T., Murase K.: Detectability of lung nodules using flat panel dual energy subtraction by two shot method: evaluation by ROC method. Eur J Radiol 2007; 64: pp. 279-284.
5. Kundel H., Revesz G.: Lesion conspicuity, structured noise, and film reader error. AJR Am J Roentgenol 1976; 126: pp. 1233-1238.
6. Samei E., Flynn M.J., Eyler W.R.: Detection of subtle lung nodules: relative influence of quantum and anatomic noise on chest radiographs. Radiology 1999; 213: pp. 727-734.
7. Brody W.R., Butt G., Hall A., Macovski A.: A method for selective tissue and bone visualization using dual energy scanned projection radiography. Med Phys 1981; 8: pp. 353-357.
8. Fraser R., Hickey N., Niklason L., et. al.: Calcification in pulmonary nodules: detection with dual-energy digital radiography. Radiology 1986; 160: pp. 595-601.
9. Kelcz F., Zink F., Peppler W., Kruger D., Ergun D., Mistretta C.: Conventional chest radiography vs. dual-energy computed radiography in the detection and characterization of pulmonary nodules. AJR Am J Roentgenol 1994; 162: pp. 271-278.
10. Ricke J., Fischbach F., Freund T., et. al.: Clinical result of CsI-detector-based dual-exposure dual-energy subtraction chest radiography. Eur Radiol 2003; 13: pp. 2577-2582.
11. Ide K., Mogami H., Murakami T., Yasuhara Y., Miyagawa M., Mochizuki T.: Detection of lung cancer using single-exposure dual-energy subtraction chest radiography. Radiat Med 2007; 25: pp. 195-201.
12. Uemura M., Miyagawa M., Yasuhara Y., et. al.: Clinical evaluation of pulmonary nodules with dual-exposure dual-energy subtraction chest radiography. Radiat Med 2005; 23: pp. 391-397.
13. Shkumat N.A., Siewerdsen J.H., Dhanantwari A.C., et. al.: Optimization of image acquisition techniques for dual-energy imaging of the chest. Med Phys 2007; 34: pp. 3904-3915.
14. Shkumat N.A., Siewerdsen J.H., Richard S., et. al.: Dual-energy imaging of the chest: optimization of image acquisition techniques for the “bone-only” image. Med Phys 2008; 35: pp. 629-632.
15. Richard S., Siewerdsen J.H.: Optimization of dual-energy imaging systems using generalized NEQ and imaging task. Med Phys 2007; 34: pp. 127-139.
16. Richard S., Siewerdsen J.H., Jaffray D.A., Moseley D.J., Bakhtiar B.: Generalized DQE analysis of radiographic and dual-energy imaging using flat-panel detectors. Med Phys 2005; 32: pp. 1397-1413.
17. Richard S., Siewerdsen J.H.: Cascaded systems analysis of noise reduction algorithms in dual-energy imaging. Med Phys 2008; 35: pp. 586-601.
18. Gohari A., Haramati L.B.: Complication of CT scan-guided lung biopsy. Chest 2004; 126: pp. 666-668.
19. Boone J.M., Shaber G.S., Tecotzky M.: Approximate is better than “exact” for interval estimation of binomial proportions. Am Stat 1998; 52: pp. 119-126.
20. Dhanantwari A., Siewerdsen J., Shkumat N., et. al.: Multi-resolution, multi-scale mutual information technique for registration of a high- and low-kVp projections in dual-energy imaging. Med Phys 2007; 34: pp. 2517.
21. Van Metter R., Foos D.: Enhanced latitude for digital projection radiography. Proc SPIE Conf Image Display 1999; 3658: pp. 468-483.
22. Agresti A., Coull B.A.: Dual-energy mammography: a detector analysis. Med Phys 1990; 17: pp. 665-675.
23. Rosner B., Glynn R., Lee M.T.: The Wilcoxon signed rank test for paired comparisons of clustered data. Biometrics 2006; 62: pp. 185-192.
24. Kuhlman J.E., Collins J., Brooks G.N., Yandow D.R., Broderick L.S.: Dual-energy subtraction chest radiography: what to look for beyond calcified nodules. Radiographics 2006; 26: pp. 79-92.