
Rationale and Objectives
This study aims to assess the use of skeletal muscle mass measurements at two thoracic levels to diagnose sarcopenia on computed tomography (CT) chest examinations and to analyze the impact of these measurements on clinical outcome parameters following transcatheter aortic valve replacement.
Materials and Methods
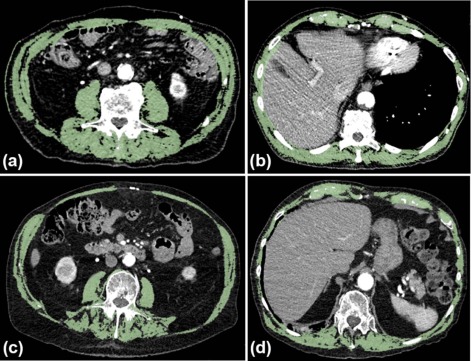
This study retrospectively included 157 patients who underwent preoperative CT examinations. The total muscle area was measured on transverse CT images at the 3rd lumbar and 7th and 12th thoracic levels with skeletal muscle indices (SMIs) calculated at each level. SMIs were then compared to clinical outcome parameters, and thoracic cutoff values for sarcopenia at the 7th and 12th thoracic levels were calculated.
Results
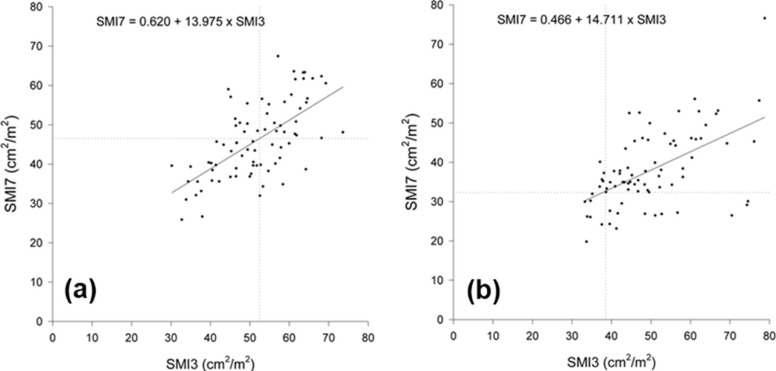
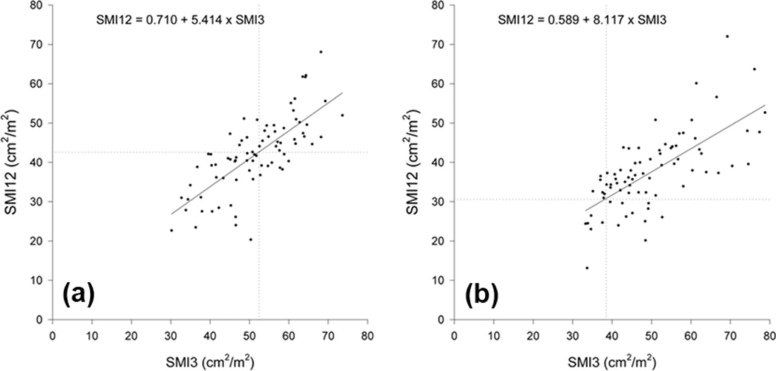
Correlation between SMIs at the third lumbar vertebra (L3) and the 12th thoracic vertebra (T12) was stronger ( r = 0.724, P < 0.001) than that between L3 and the seventh thoracic vertebra (T7) ( r = 0.594, P < 0.001). SMIs at L3 and T12 significantly correlated with prolonged length of stay. Thoracic cutoff values for the 12th thoracic level were 42.6 cm 2 /m 2 (men) and 30.6 cm 2 /m 2 (women), and those for the 7th thoracic level were 46.5 cm 2 /m 2 (men) and 32.3 cm 2 /m 2 (women).
Conclusions
Skeletal muscle measurements at the T12 level could permit the diagnosis of sarcopenia and could be used to correlate sarcopenia with outcome parameters in patients undergoing CT limited to the chest.
Introduction
Sarcopenia is a syndrome characterized by the generalized loss of skeletal muscle mass and a decrease in strength . Sarcopenia is a well-documented factor causing poor clinical outcomes in surgical, oncological, and cardiovascular patients with increased infection rate, prolonged hospital stay, higher risk of falling, and decreased overall survival .
Morphologically, with increasing age, sarcopenia causes progressive atrophy of type II muscle fibers and their replacement by connective tissue and fat . Comorbidities, poor nutrition, and reduced physical activity can accelerate the development of sarcopenia . Therefore, the assessment of body composition is important in the clinical evaluation of sarcopenia.
Get Radiology Tree app to read full this article<
Get Radiology Tree app to read full this article<
Materials and Methods
Get Radiology Tree app to read full this article<
Patients and Methods Study Population
Get Radiology Tree app to read full this article<
Get Radiology Tree app to read full this article<
Get Radiology Tree app to read full this article<
CT Image Acquisition
Get Radiology Tree app to read full this article<
Image Evaluation
Get Radiology Tree app to read full this article<
Get Radiology Tree app to read full this article<
Get Radiology Tree app to read full this article<
Get Radiology Tree app to read full this article<
Get Radiology Tree app to read full this article<
Get Radiology Tree app to read full this article<
Get Radiology Tree app to read full this article<
Statistical Analysis
Get Radiology Tree app to read full this article<
Get Radiology Tree app to read full this article<
Get Radiology Tree app to read full this article<
Get Radiology Tree app to read full this article<
Get Radiology Tree app to read full this article<
Get Radiology Tree app to read full this article<
Get Radiology Tree app to read full this article<
Results
Get Radiology Tree app to read full this article<
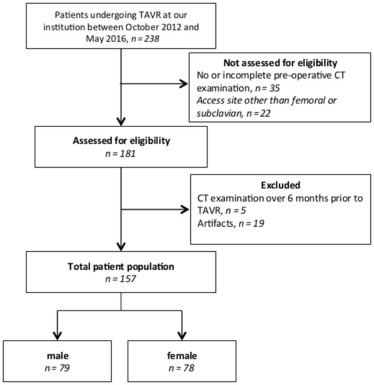
TABLE 1
Baseline Characteristics of the Patient Population
All
n = 157 Gender_P_ Value Female
n = 78 Male
n = 79 Age (y) 82.3 ± 10.0 82.9 ± 8.8 81.7 ± 11.0 0.469 \* Height (cm) 165.5 ± 11.2 157.8 ± 7.9 173.1 ± 8.4 <0.001 \* Weight (kg) 62.4 ± 12.5 53.2 ± 4.5 72.8 ± 10.1 0.037 \* BMI (kg/m 2 ) 27.3 ± 6.1 29.01 ± 7.0 25.6 ± 4.3 <0.001 \* ≤20.0 8 (5%) 3 (4%) 5 (6%) >20.0–24.9 56 (36%) 24 (30%) 32 (41%) ≥25.0 93 (59%) 51 (55%) 42 (45%) STS score 7.1 ± 5.3 7.3 ± 5.7 6.9 ± 4.8 0.669 \* Diabetes 50 (32%) 18 (23%) 32 (41%) 0.025 †
BMI, body mass index; STS, Society for Thoracic Surgeons 2008 Cardiac Surgery Risk Models.
Get Radiology Tree app to read full this article<
Get Radiology Tree app to read full this article<
TABLE 2
Computed Tomography Measurements, Skeletal Muscle Indices, and Amount of Sarcopenia
All
n = 157 Gender_P_ Value Female
n = 78 Male
n = 79 Total muscle area at L3 (cm 2 ) 138.9 ± 31.6 123.3 ± 26.7 154.4 ± 28.3 <0.001 \* Skeletal muscle index at L3 (cm 2 /m 2 ) 50.8 ± 10.7 49.8 ± 11.4 51.7 ± 9.8 0.271 \* Total muscle area at T7 (cm 2 ) 115.9 ± 33.8 93.8 ± 22.9 137.6 ± 28.3 <0.001 \* Skeletal muscle index at T7 (cm 2 /m 2 ) 42.0 ± 10.4 37.9 ± 9.7 46.0 ± 9.6 <0.001 \* Total muscle area at T12 (cm 2 ) 109.6 ± 31.4 93.0 ± 24.6 125.9 ± 28.9 <0.001 \* Skeletal muscle index at T12 (cm 2 /m 2 ) 39.8 ± 9.8 37.5 ± 9.8 42.1 ± 9.4 <0.001 \* Visceral fat area (cm 2 ) 43.7 ± 28.9 39.4 ± 26.8 47.8 ± 30.4 <0.001 \* Subcutaneous fat area (cm 2 ) 82.0 ± 50.8 106.5 ± 54.7 57.8 ± 31.8 <0.001 \* Sarcopenia, n (%) L3 53 (34) 12 (15) 41 (52) <0.001 † T7 62 (39) 19 (24) 43 (54) <0.001 † T12 58 (36) 16 (21) 42 (53) <0.001 †
L3, third lumbar vertebra; T7, seventh thoracic vertebra; T12, 12th thoracic vertebra.
Get Radiology Tree app to read full this article<
Get Radiology Tree app to read full this article<
Get Radiology Tree app to read full this article<
Get Radiology Tree app to read full this article<
Get Radiology Tree app to read full this article<
Get Radiology Tree app to read full this article<
Get Radiology Tree app to read full this article<
Get Radiology Tree app to read full this article<
TABLE 3
Results of Logistic Regression Analysis for Outcome Parameters with Computed Tomography Measurements and BMI
SMI—L3 SMI—Th7 SMI—Th12 VF SC BMI OR (95% CI)P Value OR (95% CI)P Value OR (95% CI)P Value OR (95% CI)P Value OR (95% CI)P Value OR (95% CI)P Value Prolonged length of stay 0.95 (0.90–0.99) 0.013 0.95 (0.91–1.00) 0.065 0.95 (0.91–1.00) 0.032 1.00 (0.99–1.00) 0.809 1.00 (0.99–1.00) 0.532 0.99 (0.93–1.07) 0.923 Perioperative death 1.06 (0.96–1.19) 0.205 0.92 (0.81–1.06) 0.274 1.02 (0.91–1.14) 0.740 1.00 (0.99–1.02) 0.643 1.00 (0.99–1.01) 0.097 1.08 (0.93–1.25) 0.332 Postoperative renal failure 0.97 (0.92–1.02) 0.284 0.98 (0.93–1.03) 0.396 0.98 (0.93–1.03) 0.509 1.00 (0.99–1.00) 0.310 1.00 (0.99–1.00) 0.232 1.02 (0.94–1.09 0.696 Postoperative stroke 1.02 (0.96–1.08) 0.454 1.01 (0.95–1.07) 0.630 1.02 (0.97–1.08) 0.444 1.00 (0.99–1.00) 0.877 1.00 (0.99–1.00) 0.484 1.06 (0.97–1.15) 0.189 Postoperative bleeding 0.97 (0.93–1.00) 0.129 0.98 (0.95–1.02) 0.440 0.98 (0.94–1.02) 0.367 1.00 (0.99–1.00) 0.274 1.00 (0.99–1.00) 0.270 1.03 (0.97–1.15) 0.277 Mortality—30 d 0.97 (0.89–1.06) 0.563 1.01 (0.93–1.10) 0.667 0.99 (0.91–1.09) 0.979 1.01 (1.00–1.02) 0.015 1.00 (0.99–1.00) 0.532 1.09 (0.97–1.23) 0.137 Mortality—1 y 0.95 (0.90–1.00) 0.061 1.00 (0.95–1.06) 0.785 0.99 (0.95–1.05) 0.945 1.00 (1.00–1.01) 0.046 0.99 (0.99–1.00) 0.220 0.94 (0.85–1.03) 0.332
BMI, body mass index; CI, confidence interval; OR, odds ratio; SC, subcutaneous tissue area; SMI, skeletal muscle index; VF, visceral adipose tissue area.
Get Radiology Tree app to read full this article<
Get Radiology Tree app to read full this article<
TABLE 4
Results of Logistic Regression Analysis for Outcome Parameter with Sarcopenia at L3 and T12 Levels
L3 OR (95% CI)P Value Th12 OR (95% CI)P Value Sarcopenia No sarcopenia Sarcopenia No sarcopenia Prolonged LOS 11/28 (39%) 42/129 (33%) 1.34 (0.57–3.11) 0.496 13/28 (46%) 45/129 (35%) 1.61 (0.71–3.69) 0.254 Perioperative death 0/52 (0%) 3/103 (3%) N/A \* 0.551 † 0/57 (0%) 3/98 (3%) N/A \* 0.298 † Postoperative renal failure 7/53 (13%) 11/103 (11%) 1.27 (0.46–3.49) 0.640 8/58 (14%) 10/98 (10%) 1.41 (0.52–3.79) 0.499 Postoperative stroke 1/53 (2%) 11/103 (11%) 0.16 (0.20–1.28) 0.084 1/58 (2%) 11/98 (11%) 0.14 (0.17–1.10) 0.062 Postoperative bleeding 10/53 (19%) 21/103 (20%) 0.91 (0.39–2.10) 0.822 11/58 (19%) 20/98 (20%) 0.91 (0.40–2.07) 0.827 Mortality—30 d 2/53 (4%) 3/103 (3%) 1.31 (0.21–8.07) 0.773 2/58 (3%) 3/98 (3%) 1.13 (0.18–6.98) 0.895 Mortality—1 y 8/29 (28%) 9/66 (14%) 2.41 (0.82–7.07) 0.109 7/37 (19%) 10/58 (17%) 1.12 (0.38–3.26) 0.835
CI, confidence interval; L3, third lumbar vertebra; LOS, length of stay; OR, odds ratio; T12, 12th thoracic vertebra.
Get Radiology Tree app to read full this article<
Get Radiology Tree app to read full this article<
Get Radiology Tree app to read full this article<
Discussion
Get Radiology Tree app to read full this article<
Get Radiology Tree app to read full this article<
Get Radiology Tree app to read full this article<
Get Radiology Tree app to read full this article<
Get Radiology Tree app to read full this article<
Get Radiology Tree app to read full this article<
Get Radiology Tree app to read full this article<
Get Radiology Tree app to read full this article<
Get Radiology Tree app to read full this article<
Get Radiology Tree app to read full this article<
Acknowledgment
Get Radiology Tree app to read full this article<
Get Radiology Tree app to read full this article<
References
1. Cruz-Jentoft A.J., Baeyens J.P., Bauer J.M., et. al.: Sarcopenia: European consensus on definition and diagnosis: report of the European Working Group on Sarcopenia in Older People. Age Ageing 2010; 39: pp. 412-423.
2. Goodpaster B.H., Park S.W., Harris T.B., et. al.: The loss of skeletal muscle strength, mass, and quality in older adults: the health, aging and body composition study. J Gerontol A Biol Sci Med Sci 2006; 61: pp. 1059-1064.
3. Kumar A., Moynagh M.R., Multinu F., et. al.: Muscle composition measured by CT scan is a measurable predictor of overall survival in advanced ovarian cancer. Gynecol Oncol 2016; 142: pp. 311-316.
4. Englesbe M.J., Lee J.S., He K., et. al.: Analytic morphomics, core muscle size, and surgical outcomes. Ann Surg 2012; 256: pp. 255-261.
5. Psutka S.P., Carrasco A., Schmit G.D., et. al.: Sarcopenia in patients with bladder cancer undergoing radical cystectomy: impact on cancer-specific and all-cause mortality. Cancer 2014; 120: pp. 2910-2918.
6. Onoue Y., Izumiya Y., Hanatani S., et. al.: A simple sarcopenia screening test predicts future adverse events in patients with heart failure. Int J Cardiol 2016; 215: pp. 301-306.
7. Gariballa S., Alessa A.: Sarcopenia: prevalence and prognostic significance in hospitalized patients. Clin Nutr 2013; 32: pp. 772-776.
8. Hong W., Cheng Q., Zhu X., et. al.: Prevalence of sarcopenia and its relationship with sites of fragility fractures in elderly Chinese men and women. PLoS ONE 2015; 10: pp. e0138102.
9. Dahya V., Xiao J., Prado C.M., et. al.: Computed tomography-derived skeletal muscle index: a novel predictor of frailty and hospital length of stay after transcatheter aortic valve replacement. Am Heart J 2016; 182: pp. 21-27.
10. Lieffers J.R., Bathe O.F., Fassbender K., et. al.: Sarcopenia is associated with postoperative infection and delayed recovery from colorectal cancer resection surgery. Br J Cancer 2012; 107: pp. 931-936.
11. Lexell J.: Human aging, muscle mass, and fiber type composition. J Gerontol A Biol Sci Med Sci 1995; 50: pp. 11-16. Spec No
12. Baumgartner R.N., Waters D.L., Gallagher D., et. al.: Predictors of skeletal muscle mass in elderly men and women. Mech Ageing Dev 1999; 107: pp. 123-136.
13. Fearon K., Strasser F., Anker S.D., et. al.: Definition and classification of cancer cachexia: an international consensus. Lancet Oncol 2011; 12: pp. 489-495.
14. Shen W., Punyanitya M., Wang Z., et. al.: Total body skeletal muscle and adipose tissue volumes: estimation from a single abdominal cross-sectional image. J Appl Physiol 2004; 97: pp. 2333-2338.
15. Metzler B., Winkler B.: SYNTAX, STS and EuroSCORE—how good are they for risk estimation in atherosclerotic heart disease?. Thromb Haemost 2012; 108: pp. 1065-1071.
16. Mitsiopoulos N., Baumgartner R.N., Heymsfield S.B., et. al.: Cadaver validation of skeletal muscle measurement by magnetic resonance imaging and computerized tomography. J Appl Physiol 1998; 85: pp. 115-122.
17. Prado C.M., Lieffers J.R., Bowthorpe L., et. al.: Sarcopenia and physical function in overweight patients with advanced cancer. Can J Diet Pract Res 2013; 74: pp. 69-74.
18. Mourtzakis M., Prado C.M., Lieffers J.R., et. al.: A practical and precise approach to quantification of body composition in cancer patients using computed tomography images acquired during routine care. Appl Physiol Nutr Metab 2008; 33: pp. 997-1006.
19. Kuroki L.M., Mangano M., Allsworth J.E., et. al.: Pre-operative assessment of muscle mass to predict surgical complications and prognosis in patients with endometrial cancer. Ann Surg Oncol 2015; 22: pp. 972-979.
20. Higashi T., Hayashi H., Taki K., et. al.: Sarcopenia, but not visceral fat amount, is a risk factor of postoperative complications after major hepatectomy. Int J Clin Oncol 2016; 21: pp. 310-319.
21. Kim E.Y., Kim Y.S., Park I., et. al.: Evaluation of sarcopenia in small-cell lung cancer patients by routine chest CT. Support Care Cancer 2016; 24: pp. 4721-4726.
22. Oh J.K., Ahn M.I., Kim H.L., et. al.: Retrodiaphragmatic portion of the lung: how deep is the posterior costophrenic sulcus on posteroanterior chest radiography?. Clin Radiol 2009; 64: pp. 786-791.
23. Suwatanapongched T., Gierada D.S., Slone R.M., et. al.: Variation in diaphragm position and shape in adults with normal pulmonary function. Chest 2003; 123: pp. 2019-2027.
24. Salgado R.A., Leipsic J.A., Shivalkar B., et. al.: Preprocedural CT evaluation of transcatheter aortic valve replacement: what the radiologist needs to know. Radiographics 2014; 34: pp. 1491-1514.
25. Mok M., Allende R., Leipsic J., et. al.: Prognostic value of fat mass and skeletal muscle mass determined by computed tomography in patients who underwent transcatheter aortic valve implantation. Am J Cardiol 2016; 117: pp. 828-833.
26. Paknikar R., Friedman J., Cron D., et. al.: Psoas muscle size as a frailty measure for open and transcatheter aortic valve replacement. J Thorac Cardiovasc Surg 2016; 151: pp. 745-750.
27. Morley J.E., Anker S.D., von Haehling S.: Prevalence, incidence, and clinical impact of sarcopenia: facts, numbers, and epidemiology-update 2014. J Cachexia Sarcopenia Muscle 2014; 5: pp. 253-259.
28. Chiba Y., Saitoh S., Takagi S., et. al.: Relationship between visceral fat and cardiovascular disease risk factors: the Tanno and Sobetsu study. Hypertens Res 2007; 30: pp. 229-236.
29. Despres J.P.: Cardiovascular disease under the influence of excess visceral fat. Crit Pathw Cardiol 2007; 6: pp. 51-59.
30. Despres J.P.: Body fat distribution and risk of cardiovascular disease: an update. Circulation 2012; 126: pp. 1301-1313.
31. Stenholm S., Harris T.B., Rantanen T., et. al.: Sarcopenic obesity: definition, cause and consequences. Curr Opin Clin Nutr Metab Care 2008; 11: pp. 693-700.