
Rationale and Objectives
To compare computer-generated interpretation of coronary computed tomography angiography (cCTA) by commercially available COR Analyzer software with expert human interpretation.
Materials and Methods
This retrospective Health Insurance Portability and Accountability Act‑compliant study was approved by the institutional review board. Among 225 consecutive cCTA examinations, 207 were of adequate quality for automated evaluation. COR Analyzer interpretation was compared to human expert interpretation for detection of stenosis defined as ≥50% vessel diameter reduction in the left main, left anterior descending (LAD), circumflex (LCX), right coronary artery (RCA), or a branch vessel (diagonal, ramus, obtuse marginal, or posterior descending artery).
Results
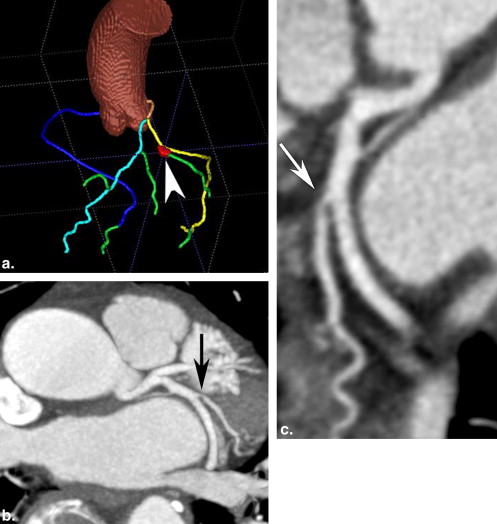
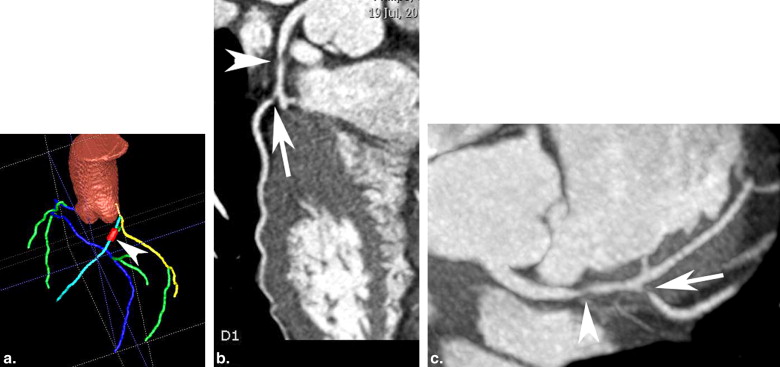
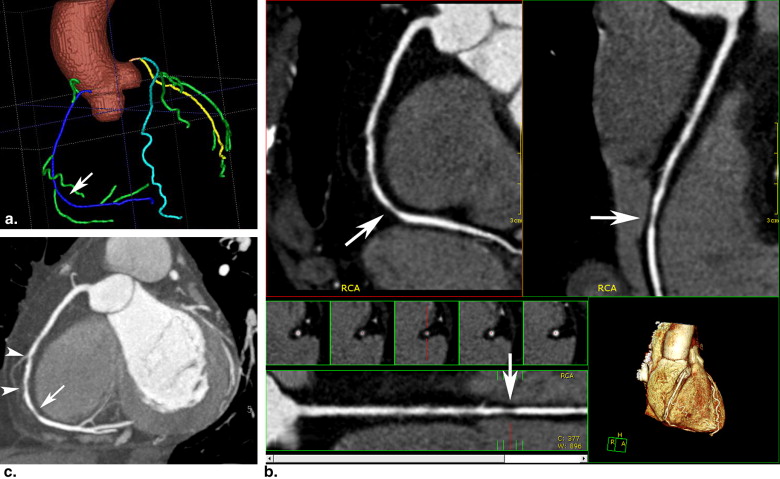
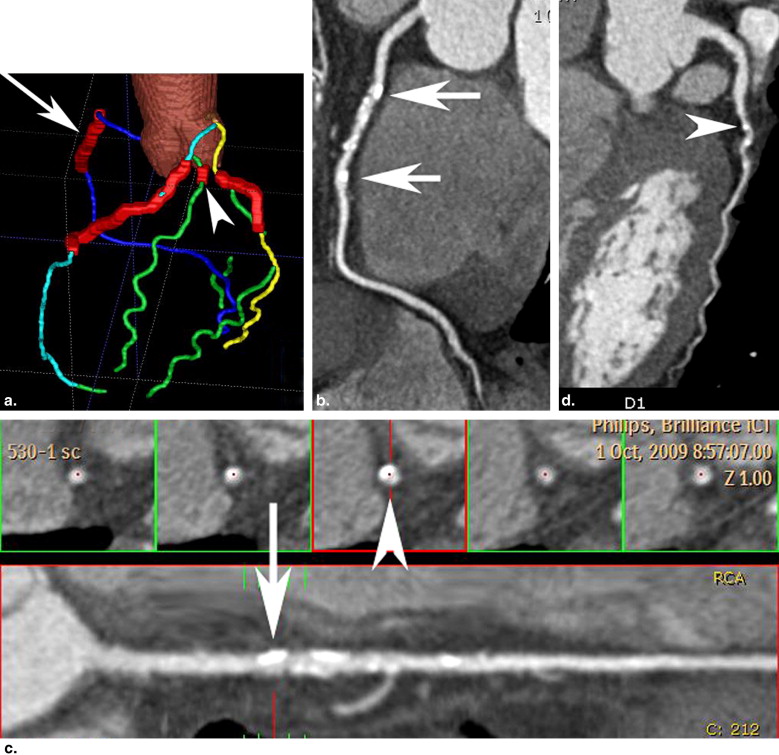
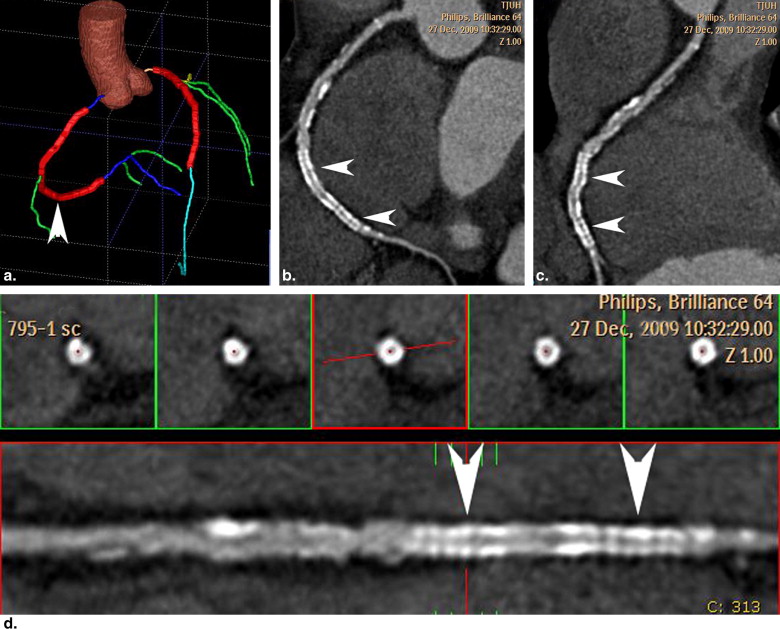
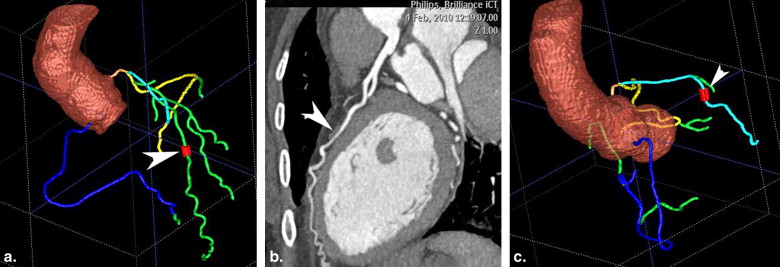
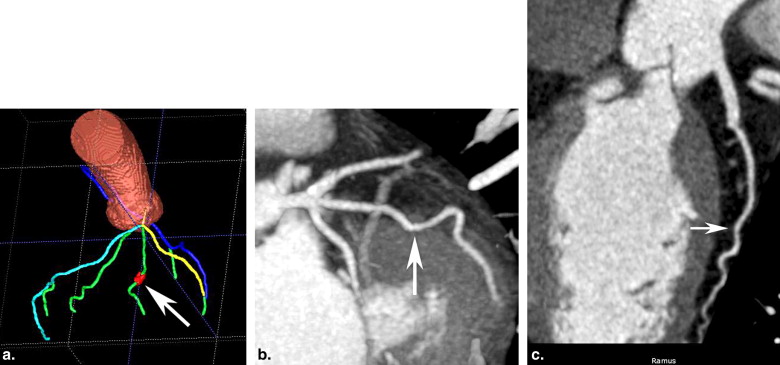
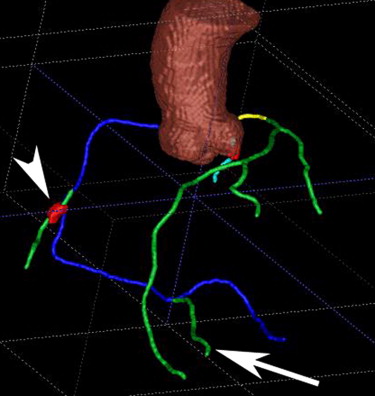
Among 207 cases evaluated by COR Analyzer, human expert interpretation identified 48 patients with stenosis. COR Analyzer identified 44/48 patients (sensitivity 92%) with a specificity of 70%, a negative predictive value of 97% and a positive predictive value of 48%. COR Analyzer agreed with the expert interpretation in 75% of patients. With respect to individual segments, COR Analyzer detected 9/10 left main lesions, 33/34 LAD lesions, 14/15 LCX lesions, 27/31 RCA lesions, and 8/11 branch lesions. False-positive interpretations were localized to the left main (n = 16), LAD (n = 26), LCX (n = 21), RCA (n = 21), and branch vessels (n = 23), and were related predominantly to calcified vessels, blurred vessels, misidentification of vessels and myocardial bridges.
Conclusions
Automated computer interpretation of cCTA with COR Analyzer provides high negative predictive value for the diagnosis of coronary disease in major coronary arteries as well as first-order arterial branches. False-positive automated interpretations are related to anatomic and image quality considerations.
Although catheter angiography is the accepted “gold standard” for the diagnosis of coronary disease, a negative coronary computed tomography angiography (cCTA) study is sufficient to exclude obstructive coronary artery disease because of the high sensitivity and negative predictive value of cCTA . Several recent studies suggest that cCTA is a cost-effective examination for evaluation of low- to intermediate-risk patients with suspected acute coronary syndrome presenting to the emergency department . The diagnostic accuracy and reproducibility of interpretation for cCTA, however, is directly related to the experience of the interpreting physician . A major limitation of cCTA for evaluation of emergency room chest pain patients is the lack of available experienced readers, especially during night time and weekend hours.
The fundamental task required for the interpretation of coronary angiography is identification and quantification of stenosis within the coronary circulation. This task is facilitated by computer-aided vessel tracking and image reconstruction techniques available on CT workstations that improve visualization of the vascular lumen and assist the interpreting physician to quantify the degree of stenosis. The presence and degree of stenosis must be evaluated in the major coronary arteries—including the left main (LM) artery, left anterior descending (LAD) artery, left circumflex (LCX) artery, right coronary artery (RCA), posterior descending artery (PDA)—as well as the diagonal branches of the LAD (D1 and D2) and obtuse marginal branches of the LCX (OM1 and OM2). Because this task is well defined and quantitative, and because computer-aided techniques are currently used to facilitate human observers, it seems reasonable that this task may be amenable to automated computer diagnosis.
Get Radiology Tree app to read full this article<
Methods
Patient Selection
Get Radiology Tree app to read full this article<
Vessel Analysis Software
Get Radiology Tree app to read full this article<
Get Radiology Tree app to read full this article<
Get Radiology Tree app to read full this article<
cCTA Studies
Get Radiology Tree app to read full this article<
Get Radiology Tree app to read full this article<
Get Radiology Tree app to read full this article<
Get Radiology Tree app to read full this article<
Results
Get Radiology Tree app to read full this article<
Get Radiology Tree app to read full this article<
Table 1
Associated Findings in False-negative Cases
Left Main LAD LCX RCA Branch Vessels Stenosis close to 50% 1 1 3 Vessel misidentification 2 Left dominant coronary system (with small RCA <1.5 mm) 1 Small vessel (<1.5 mm) 1
LAD, left anterior descending artery; LCX, circumflex artery; RCA, right coronary artery.
Get Radiology Tree app to read full this article<
Get Radiology Tree app to read full this article<
Table 2
Associated Findings in False-positive Cases
Left Main LAD LCX RCA Branch Vessels Stenosis close to 50% 1 1 1 1 Vessel misidentification 1 1 4 1 10 Anomalous coronary artery 2 Left dominant coronary system (with small RCA <1.5 mm) 2 Small vessel (<1.5 mm) 2 4 Vascular calcification 11 15 7 5 5 Coronary stent 1 2 Blurred vessel 1 8 10 2 Streak from pacemaker wire 1 1 Poor contrast opacification 2 1 3 2 Myocardial bridging 6 1
LAD, left anterior descending artery; LCX, circumflex artery; RCA, right coronary artery.
Get Radiology Tree app to read full this article<
Get Radiology Tree app to read full this article<
Get Radiology Tree app to read full this article<
Discussion
Get Radiology Tree app to read full this article<
Get Radiology Tree app to read full this article<
Get Radiology Tree app to read full this article<
Get Radiology Tree app to read full this article<
Get Radiology Tree app to read full this article<
Get Radiology Tree app to read full this article<
References
1. Stein P.D., Yaekoub A.Y., Matta F., et. al.: 64-slice CT for diagnosis of coronary artery disease: a systematic review. Am J Med 2008; 121: pp. 715-725.
2. Mowatt G., Cook J.A., Hillis G.S., et. al.: 64-slice computed tomography angiography in the diagnosis and assessment of coronary artery disease: systematic review and meta-analysis. Heart 2008; 94: pp. 1386-1393.
3. Abdulla J., Abildstrom S.Z., Gotzsche O., et. al.: 64-multislice detector computed tomography coronary angiography as potential alternative to conventional coronary angiography: a systematic review and meta-analysis. Eur Heart J 2007; 28: pp. 3042-3050.
4. Gopalakrishnan P., Wilson G.T., Tak T.: Accuracy of multislice computed tomography coronary angiography: a pooled estimate. Cardiol Rev 2008; 16: pp. 189-196.
5. Goldstein J.A., Gallagher M.J., O’Neill W.W., et. al.: A randomized controlled trial of multi-slice coronary computed tomography for evaluation of acute chest pain. J Am Coll Cardiol 2007; 49: pp. 863-871.
6. Ladapo J.A., Hoffmann U., Bamberg F., et. al.: Cost-effectiveness of coronary MDCT in the triage of patients with acute chest pain. AJR Am J Roentgenol 2008; 191: pp. 455-463.
7. Ovrehus K.A., Munkholm H., Bøttcher M., et. al.: Coronary computed tomographic angiography in patients suspected of coronary artery disease: impact of observer experience on diagnostic performance and interobserver reproducibility. J Cardiovasc Comput Tomogr 2010; 4: pp. 186-194.
8. Klette R., Zamperoni P.: Handbook of Image Processing Operators.1996.John Wiley & Sons
9. Arnoldi E., Gebregziabher M., Schoepf U.J., et. al.: Automated computer-aided stenosis detection at coronary CT angiography: initial experience. Eur Radiol 2010; 20: pp. 1160-1167.
10. Busch S., Johnson T.R., Nikolaou K., et. al.: Visual and automatic grading of coronary artery stenoses with 64-slice CT angiography in reference to invasive angiography. Eur Radiol 2007; 17: pp. 1445-1451.
11. Reimann A.J., Tsiflikas I., Brodoefel H., et. al.: Efficacy of computer aided analysis in detection of significant coronary artery stenosis in cardiac using dual source computed tomography. Int J Cardiovasc Imaging 2009; 25: pp. 195-203.
12. Zhang S., Levin D.C., Halpern E.J., et. al.: Accuracy of multidetector CT in assessing the degree of stenosis caused by calcified coronary artery plaques. AJR Am J Roentgenol 2008; 191: pp. 1676-1683.
13. Kang D.K., Im N.J., Park S.M., et. al.: CT comparison of visual and computerised quantification of coronary stenosis according to plaque composition. Eur Radiol 2010 Oct 2; [Epub ahead of print]