
Rationale and Objectives
The aim of this study is to assess the usefulness of computer-aided three-dimensional (3D) measurement of volume and computed tomography (CT) attenuation values of nodes for diagnosing nodal metastases of lung cancer.
Materials and Methods
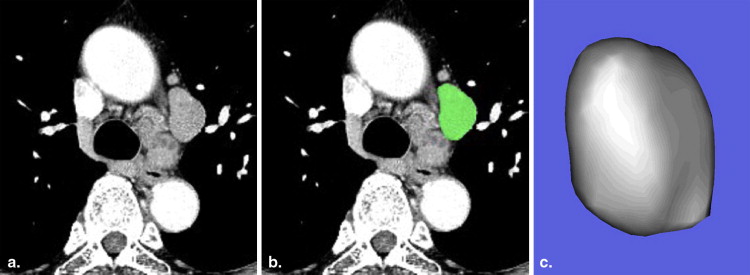
We measured three diameters, their ratios, volume, and CT values in 3D images of 191 nodes (64 malignant; 162 of <1 cm in short diameter) in 26 consecutive patients who underwent contrast-enhanced, thin-section, multidetector row CT before surgery. We separately studied statistically significant factors in a group of all nodes and in another group of nodes of <1 cm in short diameter with logistic modeling and evaluated their diagnostic accuracy.
Results
Significant factors were CT values ( P < .001) and short diameter ( P = .001) for the total node group, and CT values ( P = .030) and 3D volume ( P = .035) for the <1 cm node group. Optimal 83% accuracy was obtained with a criterion of short diameter of >7.4 mm and CT values of >103 Hounsfield unit (HU) for the total node group, whereas optimal 76% accuracy was obtained with a criterion of 3D volume of >1282 mm 3 or CT values of >103 HU for the <1 cm node group.
Conclusion
3D measurement may be useful for diagnosing nodal metastases.
Non–small-cell lung cancer (NSCLC) is staged based on the TNM classification system, because appropriate therapy depends on the staging of cancer as determined by this system and because prognosis of patients correlates well with the staging of NSCLC . Presence or absence of lymph node metastasis and its site (N-staging) are one of the three major factors of TNM system. Overall survival rates decrease as N-staging of NSCLC advances; a 5-year survival rate (56%) of patients with pathological N0 (pN0) disease was significantly better than that (38%) with pN1 disease, which was significantly better than that (22%) with pN2 disease .
Although various noninvasive and (semi)invasive procedures are used for staging NSCLC, computed tomography (CT) is initially employed and a widely used imaging technique for this purpose . Diagnosis with CT of nodal metastasis in NSCLC depends only on the diameters of nodes in two-dimensional images; at present, transverse short diameter of 1 cm is generally adopted for prediction of nodal metastasis . However, a meta-analysis reported poor sensitivity of 51% with 86% specificity of CT for identifying mediastinal node metastasis . To our knowledge, there is no literature in which three-dimensional (3D) measurements with computer-aided volume and CT attenuation values of regional nodes were applied to predict nodal metastasis in NSCLC.
Get Radiology Tree app to read full this article<
Materials and methods
Patient and CT Technique
Get Radiology Tree app to read full this article<
Get Radiology Tree app to read full this article<
Image Analysis
Get Radiology Tree app to read full this article<
Get Radiology Tree app to read full this article<
Get Radiology Tree app to read full this article<
Get Radiology Tree app to read full this article<
Statistical Analysis
Get Radiology Tree app to read full this article<
Get Radiology Tree app to read full this article<
Results
Get Radiology Tree app to read full this article<
Get Radiology Tree app to read full this article<
Get Radiology Tree app to read full this article<
Table 1
Comparison of Eight Measurement Results in CT Images between Benign and Metastatic Nodes in the Total Node Group
Factors (Mean ± SD) Benign ( n = 127) Malignant ( n = 64)P Transverse greatest diameter (mm) 10.2 ± 3.1 12.5 ± 4.2 <.001 Transverse short diameter (mm) 6.1 ± 1.8 8.7 ± 2.9 <.001 Vertical diameter (mm) 11.8 ± 3.9 15.5 ± 7.5 <.001 Volume of nodes (mm 3 ) 434 ± 348 1,047 ± 1,495 .002 Ratio of transverse short to greatest diameter .64 ± .19 .72 ± .17 .005 Ratio of transverse greatest to vertical diameter .92 ± .30 .90 ± .30 NS Ratio of transverse short to vertical diameter .57 ± .23 .63 ± .23 NS CT value (HU) .64 ± .25 .79 ± .23 <.001
CT, computed tomography; HU, Hounsfield unit; NS, not significant; SD, standard deviation.
Table 2
Comparison of Eight Measurement Results in CT Images between Benign and Metastatic Nodes in the <1 cm Node Group
Factors (Mean ± SD) Benign ( n = 119) Malignant ( n = 43)P Transverse greatest diameter (mm) 10.0 ± 3.0 10.9 ± 2.9 NS Transverse short diameter (mm) 5.9 ± 1.4 7.2 ± 1.2 <.001 Vertical diameter (mm) 11.6 ± 3.7 12.5 ± 5.5 NS Volume of nodes (mm 3 ) 388 ± 269 490 ± 345 .042 Ratio of transverse short to greatest diameter .62 ± .18 .69 ± .18 .027 Ratio of transverse greatest to vertical diameter .91 ± .31 .94 ± .29 NS Ratio of transverse short to vertical diameter .55 ± .20 .64 ± .21 .024 CT value (HU) .64 ± .25 .77 ± .25 .005
CT, computed tomography; HU, Hounsfield unit; NS, not significant; SD, standard deviation.
Get Radiology Tree app to read full this article<
Get Radiology Tree app to read full this article<
Get Radiology Tree app to read full this article<
Get Radiology Tree app to read full this article<
Table 3
Diagnostic Statistics of Two Significant Factors for Predicting Metastatic Node Determined with Logistic Modeling in the Total Node Group
Factors Sensitivity (%) Accuracy (%) Specificity (%) Transverse short diameter (mm) >4.4 100 43 15 >7.4 61 74 81 >9.9 32 94 73 >11.4 13 71 100 CT value (HU) >4 100 35 2 >102 14 69 97 >123 3 68 100 Transverse short diameter of >7.4 mm and CT value of >102 HU 8 69 100 Transverse short diameter of >7.4 mm or CT value of >102 HU 67 83 91
CT, computed tomography; HU, Hounsfield unit.
Get Radiology Tree app to read full this article<
Get Radiology Tree app to read full this article<
Table 4
Diagnostic Statistics of two Significant Factors for Predicting Metastatic node Determined with Logistic Modeling in the <1 cm Node Group
Factors Sensitivity (%) Accuracy (%) Specificity (%) Volume of nodes (mm 3 ) >484 100 30 4 >1282 5 74 99 >1960 0 73 100 CT value (HU) >4 100 27 2 >102 16 75 97 >123 0 73 100 Nodal volume of >1282 mm 3 and CT value of >102 HU 2 74 100 Nodal volume of >1282 mm 3 or CT value of >102 HU 18 76 97
CT, computed tomography; HU, Hounsfield unit.
Get Radiology Tree app to read full this article<
Get Radiology Tree app to read full this article<
Discussion
Get Radiology Tree app to read full this article<
Get Radiology Tree app to read full this article<
Get Radiology Tree app to read full this article<
Get Radiology Tree app to read full this article<
Get Radiology Tree app to read full this article<
Get Radiology Tree app to read full this article<
Get Radiology Tree app to read full this article<
Get Radiology Tree app to read full this article<
Get Radiology Tree app to read full this article<
References
1. Groome P.A., Bolejack V., Crowley J.J., et. al.: The IASLC Lung Cancer Staging Project: validation of the proposals for revision of the T, N, and M descriptors and consequent stage groupings in the forthcoming (seventh) edition of the TNM classification of malignant tumours. J Thorac Oncol 2007; 2: pp. 694-705.
2. Rusch V.W., Crowley J., Giroux D.J., et. al.: The IASLC Lung Cancer Staging Project: proposals for the revision of the N descriptors in the forthcoming seventh edition of the TNM classification for lung cancer. J Thorac Oncol 2007; 2: pp. 603-612.
3. Silvestri G.A., Gould M.K., Margolis M.L., et. al.: Noninvasive staging of non-small cell lung cancer: ACCP evidenced-based clinical practice guidelines (2nd edition). Chest 2007; 132: pp. 178S-201S.
4. Vansteenkiste J., Dooms C., De Leyn P.: Early stage non-small-cell lung cancer: challenges in staging and adjuvant treatment: evidence-based staging. Ann Oncol 2010; 21: pp. 189-195.
5. Gross B.H., Glazer G.M., Orringer M.B., et. al.: Bronchogenic carcinoma metastatic to normal-sized lymph nodes: frequency and significance. Radiology 1988; 166: pp. 71-74.
6. Arita T., Kuramitsu T., Kawamura M., et. al.: Bronchogenic carcinoma: incidence of metastases to normal sized lymph nodes. Thorax 1995; 50: pp. 1267-1269.
7. Kamiyoshihara M., Kawashima O., Ishikawa S., et. al.: Mediastinal lymph node evaluation by computed tomographic scan in lung cancer. J Cardiovasc Surg 2001; 42: pp. 119-124.
8. Suzuki K., Nagai K., Yoshida J., et. al.: Clinical predictors of N2 disease in the setting of a negative computed tomographic scan in patients with lung cancer. J Thorac Cardiovasc Surg 1999; 117: pp. 593-598.
9. Funakoshi Y., Maeda H., Takeda S., et. al.: Tumor histology affects the accuracy of clinical evaluative staging in primary lung cancer. Lung Cancer 2010; 70: pp. 195-199.
10. Kerr K.M., Lamb D., Wathen C.G., et. al.: Pathological assessment of mediastinal lymph nodes in lung cancer: implications for non-invasive mediastinal staging. Thorax 1992; 47: pp. 337-341.
11. Takashima S., Sone S., Nomura N., et. al.: Nonpalpable lymph nodes of the neck: assessment with US and US-guided fine-needle aspiration biopsy. J Clin Ultrasound 1997; 25: pp. 283-292.
12. Steinkamp H.J., Hosten N., Richter C., et. al.: Enlarged cervical lymph nodes at helical CT. Radiology 1994; 191: pp. 795-798.
13. Puesken M., Buerke B., Gerss J., et. al.: Prediction of lymph node manifestations in malignant lymphoma: significant role of volumetric compared with established metric lymph node analysis in multislice computed tomography. J Comput Assist Tomogr 2010; 34: pp. 564-569.
14. Fabel M., von Tengg-Kobligk H., Giesel F.L., et. al.: Semi-automated volumetric analysis of lymph node metastases in patients with malignant melanoma stage III/IV–a feasibility study. Eur Radiol 2008; 18: pp. 1114-1122.
15. Swensen S.J., Viggiano R.W., Midthun D.E., et. al.: Lung nodule enhancement at CT: multicenter study. Radiology 2000; 214: pp. 73-80.
16. Yi C.A., Lee K.S., Kim E.A., et. al.: Solitary pulmonary nodules: dynamic enhanced multi-detector row CT study and comparison with vascular endothelial growth factor and microvessel density. Radiology 2004; 233: pp. 191-199.
17. Li Y., Yang Z.G., Chen T.W., et. al.: Peripheral lung carcinoma: correlation of angiogenesis and first-pass perfusion parameters of 64-detector row CT. Lung Cancer 2008; 61: pp. 44-53.
18. Ohno Y., Koyama H., Matsumoto K., et. al.: Differentiation of malignant and benign pulmonary nodules with quantitative first-pass 320-detector row perfusion CT versus FDG PET/CT. Radiology 2011; 258: pp. 599-609.
19. Miles K.A.: Perfusion CT for the assessment of tumour vascularity: which protocol?. Br J Radiol 2003; 76: pp. S36-S42.
20. Vahlensieck M., Overlack A., Muller K.M.: Computed tomographic high-attenuation mediastinal lymph nodes after aluminum exposition. Eur Radiol 2000; 10: pp. 1945-1946.
21. Brink J.J.A.: Use of high concentration contrast media (HCCM): principles and rationale-body CT. Eur J Radiol 2003; 45: pp. S53-S58.