
Rationale and Objectives
This study aimed to evaluate the diagnostic performance of dynamic contrast-enhanced magnetic resonance imaging (DCE-MRI) in differentiation of four spinal lesions by using heuristic and pharmacokinetic parameters analyzed from DCE signal intensity time course.
Materials and Methods
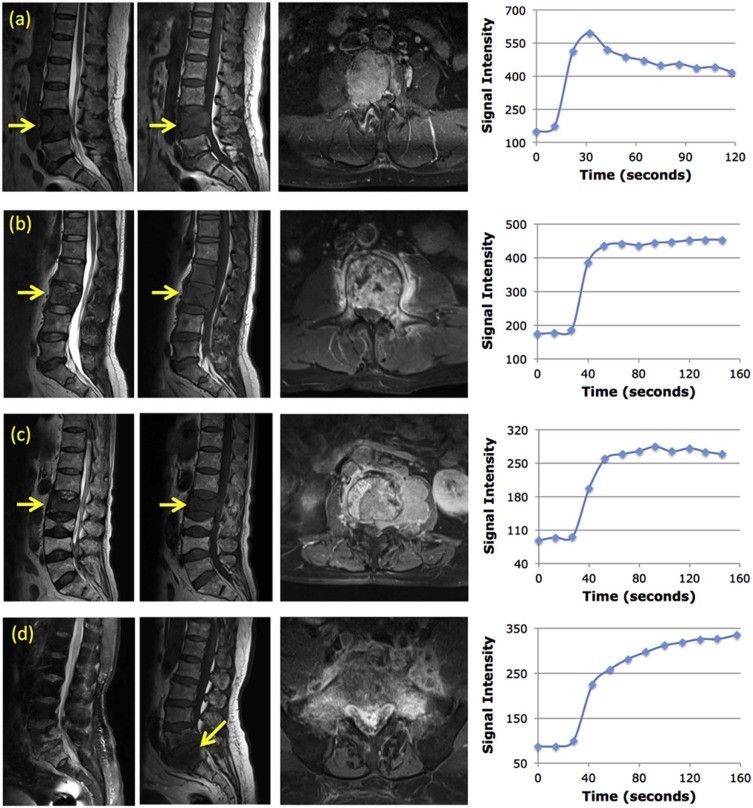
DCE-MRI of 62 subjects with confirmed myeloma ( n = 9), metastatic cancer ( n = 22), lymphoma ( n = 7), and inflammatory tuberculosis (TB) ( n = 24) in the spine were analyzed retrospectively. The region of interest was placed on strongly enhanced tissues. The DCE time course was categorized as the “wash-out,” “plateau,” or “persistent enhancement” pattern. The maximum enhancement, steepest wash-in enhancement, and wash-out slope using the signal intensity at 67 seconds after contrast injection as reference were measured. The Tofts 2-compartmental pharmacokinetic model was applied to obtain K trans and k ep . Pearson correlation between heuristic and pharmacokinetic parameters was evaluated, and receiver operating characteristic curve analysis was performed for pairwise group differentiation.
Results
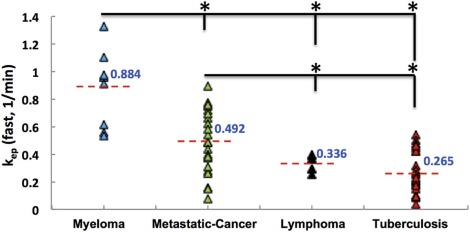
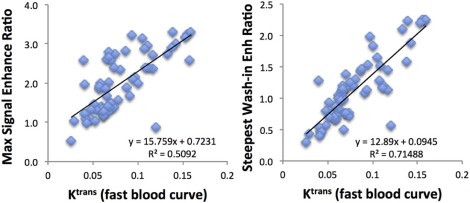
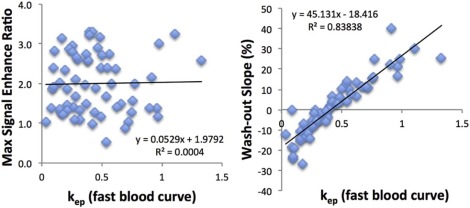
The mean wash-out slope was −22% ± 10% for myeloma, 1% ± 0.4% for metastatic cancer, 3% ± 3% for lymphoma, and 7% ± 10% for TB, and it could significantly distinguish myeloma from metastasis (area under the curve [AUC] = 0.884), lymphoma (AUC = 1.0), and TB (AUC = 1.0) with P = .001, and distinguish metastasis from TB (AUC = 0.741) with P = .005. The k ep and wash-out slope were highly correlated (r = 0.92), and they showed a similar diagnostic performance. The K trans was significantly correlated with the maximum enhancement (r = 0.71) and the steepest wash-in enhancement (r = 0.85), but they had inferior diagnostic performance compared to the wash-out slope.
Conclusions
DCE-MRI may provide additional diagnostic information, and a simple wash-out slope had the best diagnostic performance. The heuristic and pharmacokinetic parameters were highly correlated.
Introduction
Dynamic contrast-enhanced magnetic resonance imaging (DCE-MRI) is the standard method widely used for diagnosis of breast and prostate cancer . Because it can be easily performed, many studies have applied this method to characterize soft tissue lesions in other organs . In this study DCE-MRI was used to characterize four lesions in the spine, including myeloma, metastatic cancer, lymphoma, and inflammatory tuberculosis (TB). In DCE-MRI, multiple sets of images were acquired before and after injection of contrast agents, and the measured signal intensity time course (or, the enhancement kinetics) reflected the vascular and cellular properties of the lesion. The heuristic parameters, such as maximum enhancement, wash-in slope, and wash-out slope can be directly measured from the DCE kinetics. The more sophisticated two-compartmental model can be used to analyze the transport of contrast agents between the vascular space and the interstitial space to obtain pharmacokinetic parameters such as K trans and k ep . Many different methods have been applied to analyze the DCE kinetics, but there is no consensus on which method is the best . It is in general agreed that as long as characteristic parameters can be reliably extracted, they may provide helpful information for a correct diagnosis as well as surgical planning.
DCE-MRI has been applied to diagnose different spinal lesions and distinguish between hypervascular (eg, renal cell carcinoma) and hypovascular (eg, prostate cancer) metastases . It has also been used to characterize vascular properties of hematologic malignancies (eg, myeloma and lymphoma) with different grades of bone marrow involvement, as well as to evaluate changes after various therapies for predicting treatment outcome and prognosis . These studies used different DCE-MRI analysis methods to generate heuristic parameters or pharmacokinetic parameters. So far there is no published study to systematically compare the different DCE parameters for spinal lesions analyzed using different approaches. The purpose of this study is to investigate the correlation of DCE-MRI parameters obtained by using heuristic and pharmacokinetic analyses and to investigate further their diagnostic performance for differentiating four spinal lesions. The obtained DCE-MRI diagnostic parameters may provide information for characterizing the extent of disease for guiding biopsy and planning of surgery and subsequent adjuvant treatments.
Materials and Methods
Patients
Get Radiology Tree app to read full this article<
MRI Protocol
Get Radiology Tree app to read full this article<
Heuristic Parameters Analyzed From DCE Kinetics
Get Radiology Tree app to read full this article<
Get Radiology Tree app to read full this article<
MaximumEnhancementRatio=[(Smax−S0)/S0] Maximum
Enhancement
Ratio
=
[
(
S
max
−
S
0
)
/
S
0
]
SteepestWash-inEnhancementRatio=[(S2−S1)/S0] Steepest
Wash-in
Enhancement
Ratio
=
[
(
S
2
−
S
1
)
/
S
0
]
Get Radiology Tree app to read full this article<
Get Radiology Tree app to read full this article<
Wash-outSlope=[(Slast−Speak)/Speak]×100%or,[(Slast−S67seconds)/S67seconds]×100% Wash-out
Slope
=
[
(
S
last
−
S
peak
)
/
S
peak
]
×
100
%
or
,
[
(
S
last
−
S
67
seconds
)
/
S
67
seconds
]
×
100
%
Get Radiology Tree app to read full this article<
Get Radiology Tree app to read full this article<
Get Radiology Tree app to read full this article<
Pharmacokinetic Analysis to Obtain K trans and k ep
Get Radiology Tree app to read full this article<
Cb=D[a1exp(−m1t)+a2exp(−m2t)] C
b
=
D
[
a
1
exp
(
−
m
1
t
)
+
a
2
exp
(
−
m
2
t
)
]
where D was the injection dose, 0.1 [mmol/kg]. The parameters used for fast, medium, and slow blood curves were taken from the commercial DCE analysis program SygnoTissue4D (Siemens Healthcare, Erlangen, Germany). For the fast blood curve, a 1 = 92.0 [kg/L], a 2 = 6.4 [kg/L], m 1 = 5.3 [1/min], and m 2 = 0.016 [1/min]; for the medium blood curve, a 1 = 24.0 [kg/L], a 2 = 6.2 [kg/L], m 1 = 3.0 [1/min], and m 2 = 0.016 [1/min]; for the slow blood curve, a 1 = 3.99 [kg/L], a 2 = 4.78 [kg/L], m 1 = 0.144 [1/min], and m 2 = 0.011 [1/min].
Get Radiology Tree app to read full this article<
Statistical Analyses
Get Radiology Tree app to read full this article<
Results
Lesion Group Comparisons
Get Radiology Tree app to read full this article<
TABLE 1
The Distribution of Enhancement Kinetic Patterns in the Four Lesion Groups
Wash-out
n (%) Plateau
n (%) Persistent
n (%) Myeloma
( n = 9) 9(100) 0 0 Metastasis
( n = 22) 7(32) 11(50) 4(18) Lymphoma
( n = 7) 0 7(100) 0 Tuberculosis
( n = 24) 1(4) 12(50) 11(46)
Get Radiology Tree app to read full this article<
Get Radiology Tree app to read full this article<
TABLE 2
Heuristic Parameters Analyzed From DCE Enhancement Kinetics of Lesions in Four Disease Groups, and the Pharmacokinetic Parameters Obtained by Using the Fast, Medium, and Slow Blood Curves (Mean ± Standard Deviation Is Shown)
Maximum Enhancement Ratio Wash-in Enhancement Ratio Wash-out Slope K trans -Fast
(1/min) K trans -Medium
(1/min) K trans -Slow
(1/min) k ep -Fast
(1/min) k ep -Medium
(1/min) k ep -Slow
(1/min) Myeloma
( n = 9) 2.3 ± 0.7 1.7 ± 0.5 −22±10% 0.114 ± 0.036 0.29 ± 0.15 1.24 ± 0.77 0.88 ± 0.26 1.86 ± 0.88 6.50 ± 3.13 Metastasis
( n = 22) 1.7 ± 0.6 1.1 ± 0.4 1 ± 0.4% 0.077 ± 0.028 0.18 ± 0.07 0.66 ± 0.32 0.49 ± 0.23 1.09 ± 0.39 4.22 ± 1.46 Lymphoma
( n = 7) 2.7 ± 0.4 1.0 ± 0.3 3 ± 3% 0.068 ± 0.016 0.16 ± 0.03 0.67 ± 0.17 0.34 ± 0.06 0.83 ± 0.07 4.27 ± 0.79 Tuberculosis
( n = 24) 2.0 ± 0.8 1.0 ± 0.6 7 ± 10% 0.077 ± 0.036 0.17 ± 0.08 0.77 ± 0.63 0.27 ± 0.15 0.72 ± 0.25 3.90 ± 2.23
DCE, dynamic contrast-enhanced.
Get Radiology Tree app to read full this article<
Get Radiology Tree app to read full this article<
Get Radiology Tree app to read full this article<
ROC Diagnostic Comparisons
Get Radiology Tree app to read full this article<
TABLE 3
The Area Under the ROC Curve (AUC) to Differentiate Between Different Disease Groups Using Heuristic and Pharmacokinetic Parameters Measured From DCE Kinetics
Maximum Enhancement Ratio Wash-in Enhancement Ratio Wash-out Slope K trans -Fast
(1/min) k ep -Fast
(1/min) AUC (95% CI)P Value AUC (95% CI)P Value AUC (95% CI)P Value AUC (95% CI)P Value AUC (95% CI)P Value Myeloma vs. metastasis0.810\* (0.658–.963).0070.803\* (0.638–0.968).0090.884\* (0.766–1.00).0010.798\* (0.632–0.964).0100.864\* (0.717–1.00).002 Myeloma vs lymphoma 0.683(0.408–0.957) .2230.810\* (0.588–1.00).0391.000\* (1.00–1.00).0010.841\* (0.636–1.00).0231.000\* (1.00–1.00).001 Myeloma vs tuberculosis(TB) 0.583(0.373–0.793) .4670.737\* (0.533–0.942).0411.000\* (1.00–1.00).0010.782\* (0.617–0.948).0140.995\* (0.980–1.00).001 Metastasis vs lymphoma0.909\* (0.793–1.00).001 0.435(0.200–0.671) .610 0.734(0.558–0.910) .067 0.487(0.263–0.711) .919 0.734(0.558–0.910) .067 Metastasis vs TB 0.631(0.466–0.796) .129 0.602(0.433–0.771) .2350.741\* (0.595–0.886).005 0.464(0.293–0.636) .6760.780\* (0.643–0.918).001 Lymphoma vs TB 0.702(0.521–0.884) .108 0.521(0.299–0.742) .869 0.607(0.419–0.796) .395 0.512(0.300–0.724) .925 0.673(0.490–0.855) .171
95% CI: 95% confidence intervals shown in brackets.
Get Radiology Tree app to read full this article<
Get Radiology Tree app to read full this article<
Get Radiology Tree app to read full this article<
Get Radiology Tree app to read full this article<
Correlation of DCE Heuristic Parameters and K trans , k ep
Get Radiology Tree app to read full this article<
Get Radiology Tree app to read full this article<
Discussion
Get Radiology Tree app to read full this article<
Get Radiology Tree app to read full this article<
Get Radiology Tree app to read full this article<
Get Radiology Tree app to read full this article<
Get Radiology Tree app to read full this article<
Get Radiology Tree app to read full this article<
Get Radiology Tree app to read full this article<
Conclusions
Get Radiology Tree app to read full this article<
Acknowledgments
Get Radiology Tree app to read full this article<
References
1. Turnbull L.W.: Dynamic contrast-enhanced MRI in the diagnosis and management of breast cancer. NMR Biomed 2009; 22: pp. 28-39.
2. Verma S., Turkbey B., Muradyan N., et. al.: Overview of dynamic contrast-enhanced MRI in prostate cancer diagnosis and management. AJR Am J Roentgenol 2012; 198: pp. 1277-1288.
3. Su M.Y., Chen J.H.: Quantitative measurements of tracer transport parameters using dynamic contrast-enhanced MRI as vascular perfusion and permeability indices in cancer imaging. Chapter10Tugan Muftuler L.Quantifying morphology and physiology of the human body using MRI.2013.Taylor & FrancisBoca Raton, FL:
4. Khalifa F., Soliman A., El-Baz A., et. al.: Models and methods for analyzing DCE-MRI: a review. Med Phys 2014; 41: pp. 124301.
5. Tofts P.S., Kermode A.G.: Measurement of the blood-brain barrier permeability and leakage space using dynamic MR imaging. 1. Fundamental concepts. Magn Reson Med 1991; 17: pp. 357-367.
6. Tofts P.S.: Modeling tracer kinetics in dynamic Gd-DTPA MR imaging. J Magn Reson Imaging 1997; 7: pp. 91-101.
7. Taylor J.S., Tofts P.S., Port R., et. al.: MR imaging of tumor microcirculation: promise for the new millennium. J Magn Reson Imaging 1999; 10: pp. 903-907.
8. Moulopoulos L.A., Maris T.G., Papanikolaou N., et. al.: Detection of malignant bone marrow involvement with dynamic contrast-enhanced magnetic resonance imaging. Ann Oncol 2003; 14: pp. 152-158.
9. Rahmouni A., Montazel J.L., Divine M., et. al.: Bone marrow with diffuse tumor infiltration in patients with lymphoproliferative diseases: dynamic gadolinium-enhanced MR imaging. Radiology 2003; 229: pp. 710-717.
10. Lang N., Su M.Y., Yu H.J., et. al.: Differentiation of myeloma and metastatic cancer in the spine using dynamic contrast-enhanced MRI. Magn Reson Imaging 2013; 31: pp. 1285-1291.
11. Lang N., Su M.Y., Yu H.J., et. al.: Differentiation of tuberculosis and metastatic cancer in the spine using dynamic contrast-enhanced MRI. Eur Spine J 2015; 24: pp. 1729-1737.
12. Khadem N.R., Karimi S., Peck K.K., et. al.: Characterizing hypervascular and hypovascular metastases and normal bone marrow of the spine using dynamic contrast-enhanced MR imaging. AJNR Am J Neuroradiol 2012; 33: pp. 2178-2185.
13. Saha A., Peck K.K., Lis E., et. al.: Magnetic resonance perfusion characteristics of hypervascular renal and hypovascular prostate spinal metastases: clinical utilities and implications. Spine 2014; 39: pp. E1433-E1440.
14. Stäbler A., Baur A., Bartl R., et. al.: Contrast enhancement and quantitative signal analysis in MR imaging of multiple myeloma: assessment of focal and diffuse growth patterns in marrow correlated with biopsies and survival rates. AJR Am J Roentgenol 1996; 167: pp. 1029-1036.
15. Zha Y., Li M., Yang J.: Dynamic contrast enhanced magnetic resonance imaging of diffuse spinal bone marrow infiltration in patients with hematological malignancies. Korean J Radiol 2010; 11: pp. 187-194.
16. Dutoit J.C., Vanderkerken M.A., Verstraete K.L.: Value of whole body MRI and dynamic contrast enhanced MRI in the diagnosis, follow-up and evaluation of disease activity and extent in multiple myeloma. Eur J Radiol 2013; 82: pp. 1444-1452.
17. Hillengass J., Wasser K., Delorme S., et. al.: Lumbar bone marrow microcirculation measurements from dynamic contrast-enhanced magnetic resonance imaging is a predictor of event-free survival in progressive multiple myeloma. Clin Cancer Res 2007; 13: pp. 475-481.
18. Chen B.B., Hsu C.Y., Yu C.W., et. al.: Dynamic contrast-enhanced MR imaging measurement of vertebral bone marrow perfusion may be indicator of outcome of acute myeloid leukemia patients in remission. Radiology 2011; 258: pp. 821-831.
19. Zechmann C.M., Traine L., Meissner T., et. al.: Parametric histogram analysis of dynamic contrast-enhanced MRI in multiple myeloma: a technique to evaluate angiogenic response to therapy?. Acad Radiol 2012; 19: pp. 100-108.
20. Chu S., Karimi S., Peck K.K., et. al.: Measurement of blood perfusion in spinal metastases with dynamic contrast-enhanced magnetic resonance imaging: evaluation of tumor response to radiation therapy. Spine 2013; 38: pp. E1418-E1424.
21. Parker G.J., Roberts C., Macdonald A., et. al.: Experimentally-derived functional form for a population-averaged high-temporal-resolution arterial input function for dynamic contrast-enhanced MRI. Magn Reson Med 2006; 56: pp. 993-1000.
22. Orton M.R., d’Arcy J.A., Walker-Samuel S., et. al.: Computationally efficient vascular input function models for quantitative kinetic modelling using DCE-MRI. Phys Med Biol 2008; 53: pp. 1225-1239.
23. Weinmann H.J., Laniado M., Mützel W.: Pharmacokinetics of GdDTPA/dimeglumine after intravenous injection into healthy volunteers. Physiol Chem Phys Med NMR 1984; 16: pp. 167-172.
24. Cheng H.L.: Investigation and optimization of parameter accuracy in dynamic contrast-enhanced MRI. J Magn Reson Imaging 2008; 28: pp. 736-743.
25. Ashton E., Raunig D., Ng C., et. al.: Scan-rescan variability in perfusion assessment of tumors in MRI using both model and data-derived arterial input functions. J Magn Reson Imaging 2008; 28: pp. 791-796.
26. Zheng C.Y., Liu D.X., Luo S.W., et. al.: Imaging presentation highly manifested as tuberculosis in a case of spinal metastatic carcinoma. Orthopedics 2011; 34: pp. e436-e438.
27. Yu Y., Wang X., Du B., et. al.: Isolated atypical spinal tuberculosis mistaken for neoplasia: case report and literature review. Eur Spine J 2013; 22 Suppl 3: pp. S302-S305.
28. Erlemann R., Reiser M.F., Peters P.E., et. al.: Musculoskeletal neoplasms: static and dynamic Gd-DTPA-enhanced MR imaging. Radiology 1989; 171: pp. 767-773.
29. Lang P., Honda G., Roberts T., et. al.: Musculoskeletal neoplasm: perineoplastic edema versus tumor on dynamic postcontrast MR images with spatial mapping of instantaneous enhancement rates. Radiology 1995; 197: pp. 831-839.
30. May D.A., Good R.B., Smith D.K., et. al.: MR imaging of musculoskeletal tumors and tumor mimickers with intravenous gadolinium: experience with 242 patients. Skeletal Radiol 1997; 26: pp. 2-15.
31. Geirnaerdt M.J., Hogendoorn P.C., Bloem J.L., et. al.: Cartilaginous tumors: fast contrast-enhanced MR imaging. Radiology 2000; 214: pp. 539-546.
32. Sarin H.: Physiologic upper limits of pore size of different blood capillary types and another perspective on the dual pore theory of microvascular permeability. J Angiogenes Res 2010; 2: pp. 14.
33. Moehler T.M., Neben K., Ho A.D., et. al.: Angiogenesis in hematologic malignancies. Ann Hematol 2001; 80: pp. 695-705.
34. Rajkumar S.V., Leong T., Roche P.C., et. al.: Prognostic value of bone marrow angiogenesis in multiple myeloma. Clin Cancer Res 2000; 6: pp. 3111-3116.
35. Munshi N.C., Wilson C.: Increased bone marrow microvessel density in newly diagnosed multiple myeloma carries a poor prognosis. Semin Oncol 2001; 28: pp. 565-569.
36. Kimlinger T., Kline M., Kumar S., et. al.: Differential expression of vascular endothelial growth factors and their receptors in multiple myeloma. Haematologica 2006; 91: pp. 1033-1040.
37. Moehler T.M., Hawighorst H., Neben K., et. al.: Bone marrow microcirculation analysis in multiple myeloma by contrast-enhanced dynamic magnetic resonance imaging. Int J Cancer 2001; 93: pp. 862-868.
38. Baur A., Stäbler A., Nagel D., et. al.: Magnetic resonance imaging as a supplement for the clinical staging system of Durie and Salmon?. Cancer 2002; 95: pp. 1334-1345.