
Rationale and Objectives
There have been a large number of case-control studies using diffusion tensor imaging (DTI) in amyotrophic lateral sclerosis (ALS). The objective of this study was to perform an individual patient data (IPD) meta-analysis for the estimation of the diagnostic accuracy measures of DTI in the diagnosis of ALS using corticospinal tract data.
Materials and Methods
MEDLINE, EMBASE, CINAHL, and Cochrane databases (1966–April 2011) were searched. Studies were included if they used DTI region of interest or tractography techniques to compare mean cerebral corticospinal tract fractional anisotropy values between ALS subjects and healthy controls. Corresponding authors from the identified articles were contacted to collect individual patient data. IPD meta-analysis and meta-regression were performed using Stata. Meta-regression covariate analysis included age, gender, disease duration, and Revised Amyotrophic Lateral Sclerosis Functional Rating Scale scores.
Results
Of 30 identified studies, 11 corresponding authors provided IPD and 221 ALS patients and 187 healthy control subjects were available for study. Pooled area under the receiver operating characteristic curve (AUC) was 0.75 (95% CI: 0.66–0.83), pooled sensitivity was 0.68 (95% CI: 0.62–0.75), and pooled specificity was 0.73 (95% CI: 0.66–0.80). Meta-regression showed no significant differences in pooled AUC for each of the covariates. There was moderate to high heterogeneity of pooled AUC estimates. Study quality was generally high. Data from 19 of the 30 eligible studies were not ascertained, raising possibility of selection bias.
Conclusion
Using corticospinal tract individual patient data, the diagnostic accuracy of DTI appears to lack sufficient discrimination in isolation. Additional research efforts and a multimodal approach that also includes ALS mimics will be required to make neuroimaging a critical component in the workup of ALS.
Amyotrophic lateral sclerosis (ALS) is a fatal degenerative motor neuron disease involving the motor cortex, corticospinal tract (CST), and spinal anterior horn neurons. Clinical presentation of the disease is variable, contributing diagnostic uncertainty and delay . More than 40% of ALS patients undergo inappropriate medical treatment, including surgery . Electromyography can help confirm the diagnosis of lower motor neuron involvement. There is a high interest in developing upper motor neuron diagnostic biomarkers to facilitate an accurate diagnosis at an earlier stage .
A promising biomarker for ALS is diffusion tensor imaging (DTI), an advanced magnetic resonance imaging (MRI) application. Fractional anisotropy (FA), a scalar measurement of water diffusivity, is a key DTI metric. FA reductions have been reported in diseases that degrade white matter tracts, including ALS . Although several studies have reported FA decreases in ALS patients, only a few have addressed test accuracy measures with relative small subject numbers . We have recently completed a group-level meta-analysis of test accuracy measures of DTI for the diagnosis of ALS . However, individual patient data (IPD) meta-analysis approaches are generally considered superior to group-level approaches because more rigorous statistical methods can be employed, including covariate adjustment . Our study objective was to compare ALS patients who underwent DTI to healthy controls to determine diagnostic accuracy measures of FA using IPD meta-analysis techniques.
Methods
Eligibility Criteria
Get Radiology Tree app to read full this article<
Get Radiology Tree app to read full this article<
Selection and Quality Assessment
Get Radiology Tree app to read full this article<
Data Extraction and Synthesis
Get Radiology Tree app to read full this article<
Retrospective Study
Get Radiology Tree app to read full this article<
Statistical Analysis
Get Radiology Tree app to read full this article<
Get Radiology Tree app to read full this article<
Get Radiology Tree app to read full this article<
Results
Study Selection
Get Radiology Tree app to read full this article<
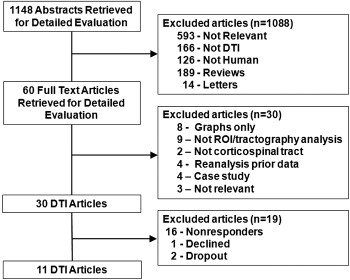
Get Radiology Tree app to read full this article<
Study Characteristics
Get Radiology Tree app to read full this article<
Table 1
Individual Study Characteristics
Study Number Author MRI B Value Number of Directions Analysis Method Brain Region Average Disease Duration (months) 1 Bartels 2.9 T 1000 24 ROI-tractography CST ∗ 20 ± 10 2 Ciccarelli 1.5 T 1150 54 Tractography CST 21 ± 16 3 Cosottini 1.5 T 1000 25 ROI-visual CST 33 ± 20 4 Cosottini 1.5 T 1000 31 ROI-visual CST 17 ± 13 5 Ellis 1.5 T 620 7 ROI-visual CST 27 ± 26 6 Filippini 3.0 T 1000 60 Tractography CST ∗ 49 ± 38 7 Foerster 3.0 T 800 15 Tractography CST ∗ 25 ± 15 8 Metwalli 3.0 T 1000 64 ROI-visual IC ∗ , † 26 ± 15 9 Pyra 1.5 T 1000 6 ROI-visual IC ∗ , † 25 ± 17 10 Roccatagliata 1.5 T 1000 51 ROI-visual IC ∗ 12 ± 6 11 Senda 3.0 T 700 6 ROI-tractography IC ∗ 20 ± 9 12 Wang 3.0 T 1000 12 ROI-tractography IC 20 ± 20
CST, average corticospinal tract; IC, internal capsule; MRI, magnetic resonance imaging; ROI, region of interest.
Get Radiology Tree app to read full this article<
Get Radiology Tree app to read full this article<
Get Radiology Tree app to read full this article<
Meta-Analysis of Sensitivity, Specificity, and AUC
Get Radiology Tree app to read full this article<
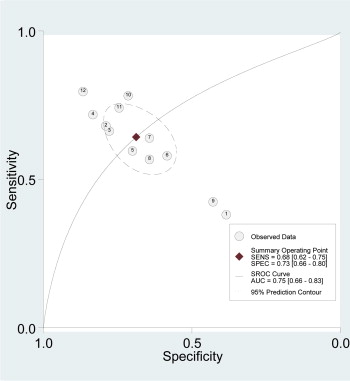
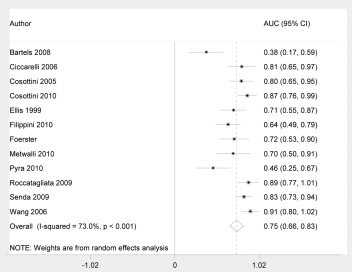
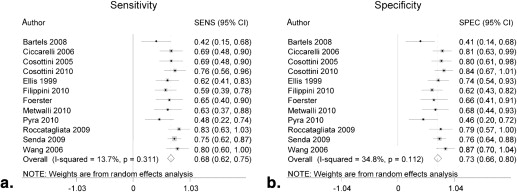
Get Radiology Tree app to read full this article<
AUC Meta-analysis Using Covariates
Get Radiology Tree app to read full this article<
Table 2
AUC Measures with Covariates
Age Gender ALSFRS-R Disease Duration Included study numbers ∗ 1, 2, 5–12 1, 2, 5–12 1–4, 6, 7, 9, 10, 12 1, 2, 4, 5, 7, 9, 10, 12 Nonadjusted AUC 0.58 (0.32–0.84) 0.58 (0.32–0.84) 0.65 (0.47–0.84) 0.61 (0.36–0.85) Adjusted AUC 0.58 (0.31–0.85) 0.58 (0.32–0.85) 0.58 (0.40–0.77) 0.61 (0.37–0.86)
ALSFRS-R, Revised Amyotrophic Functional Rating Scale; AUC, area under curve.
Get Radiology Tree app to read full this article<
Get Radiology Tree app to read full this article<
Predictive Values
Get Radiology Tree app to read full this article<
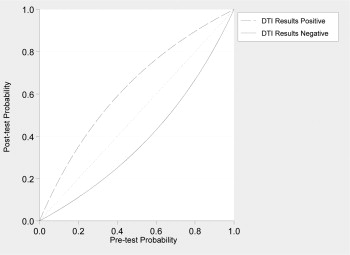
Get Radiology Tree app to read full this article<
Study Quality, Publication Bias, and Heterogeneity
Get Radiology Tree app to read full this article<
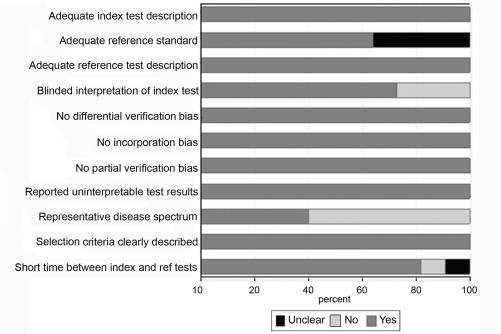

Get Radiology Tree app to read full this article<
Discussion
Get Radiology Tree app to read full this article<
Get Radiology Tree app to read full this article<
Get Radiology Tree app to read full this article<
Get Radiology Tree app to read full this article<
Get Radiology Tree app to read full this article<
Acknowledgments
Get Radiology Tree app to read full this article<
Appendix
Get Radiology Tree app to read full this article<
Table 1
MEDLINE Keyword Search (1966-April 2011)
[amyotrophic lateral sclerosis or Lou Gehrig’s disease to include all subheadings] and [magnetic resonance imaging to include all subheadings] or [diagnostic imaging to include all subheadings] or [diffusion magnetic resonance imaging to include all subheadings] or [diffusion tensor imaging to include all subheadings] or [fractional anisotropy to include all subheadings] or [anisotropy to include all subheadings]
Table 2
Additional Study Information
Study Author Journal Year Number of ALS Patients ALS Age, y (Mean ± SD) Number of HC Subjects HC Age, y (Mean ± SD) 1 Bartels Neuromuscul Disord 2008 12 M:10 F 61 ± 7 5 M:8 F 61 ± 8 2 Ciccarelli Brain 2006 12 M:1 F 54 ± 13 15 M:4 F 39 ± 11 3 Cosottini Radiology 2005 14 M:4 F 64 ± 7 4 M:8 F 65 ± 6 4 Cosottini J Comput Assist Tomogr 2010 14 M:4 F 61 ± 8 2 M:14 F 65 ± 6 5 Ellis Neurology 1999 13 M:7 F 51 ± 11 9 M:11 F 46 ± 13 6 Filippini Neurology 2010 16 M:8 F 59 ± 12 17 M:7 F 58 ± 12 7 Foerster 8 M:6 F 61 ± 9 8 M:6 F 58 ± 6 8 Metwalli Brain Res 2010 10 M:2 F 56 ± 11 11 M:8 F 50 ± 13 9 Pyra Amyotroph Lateral Scler 2010 6 M:8 F 54 ± 15 8 M:6 F 53 ± 12 10. Roccatagliata Amyotroph Lateral Scler 2009 8 M:6 F 63 ± 9 4 M:8 F 61 ± 10 11. Senda Amyotroph Lateral Scler 2009 26 M:20 F 62 ± 10 7 M:12 F 63 ± 9 12. Wang Radiology 2006 12 M:3 F 57 ± 7 5 M:5 F 49 ± 8
ALS, amyotrophic lateral sclerosis; F, female; HC, healthy control; M, male; SD, standard deviation.
Get Radiology Tree app to read full this article<
References
1. Zoccolella S., Beghi E., Palagano G., et. al.: Predictors of delay in the diagnosis and clinical trial entry of amyotrophic lateral sclerosis patients: a population-based study. J Neurol Sci 2006; 250: pp. 45-49.
2. Kraemer M., Buerger M., Berlit P.: Diagnostic problems and delay of diagnosis in amyotrophic lateral sclerosis. Clin Neurol Neurosurg 2010; 112: pp. 103-105.
3. Kaufmann P., Mitsumoto H.: Amyotrophic lateral sclerosis: objective upper motor neuron markers. Curr Neurol Neurosci Rep 2002; 2: pp. 55-60.
4. Cudkowicz M., Qureshi M., Shefner J.: Measures and markers in amyotrophic lateral sclerosis. NeuroRx 2004; 1: pp. 273-283.
5. Turner M.R., Kiernan M.C., Leigh P.N., et. al.: Biomarkers in amyotrophic lateral sclerosis. Lancet Neurol 2009; 8: pp. 94-109.
6. Turner M.R., Grosskreutz J., Kassubek J., et. al.: Towards a neuroimaging biomarker for amyotrophic lateral sclerosis. Lancet Neurol 2011; 10: pp. 400-403.
7. Cosottini M., Giannelli M., Vannozzi F., et. al.: Evaluation of corticospinal tract impairment in the brain of patients with amyotrophic lateral sclerosis by using diffusion tensor imaging acquisition schemes with different numbers of diffusion-weighting directions. J Comput Assist Tomogr 2010; 34: pp. 746-750.
8. Filippini N., Douaud G., Mackay C.E., et. al.: Corpus callosum involvement is a consistent feature of amyotrophic lateral sclerosis. Neurology 2010; 75: pp. 1645-1652.
9. Blain C.R., Brunton S., Williams V.C., et. al.: Differential corticospinal tract degeneration in homozygous ‘D90A’SOD-1 ALS and sporadic ALS. J Neurol Neurosurg Psychiatry 2011; 82: pp. 843-849.
10. Graham J.M., Papadakis N., Evans J., et. al.: Diffusion tensor imaging for the assessment of upper motor neuron integrity in ALS. Neurology 2004; 63: pp. 2111-2119.
11. Lombardo F., Frijia F., Bongioanni P., et. al.: Diffusion tensor MRI and MR spectroscopy in long lasting upper motor neuron involvement in amyotrophic lateral sclerosis. Arch Ital Biol 2009; 147: pp. 69-82.
12. Nelles M., Block W., Traber F., et. al.: Combined 3T diffusion tensor tractography and H-1-MR spectroscopy in motor neuron disease. Am J Neuroradiol 2008; 29: pp. 1708-1714.
13. Pyra T., Hui B., Hanstock C., et. al.: Combined structural and neurochemical evaluation of the corticospinal tract in amyotrophic lateral sclerosis. Amyotroph Lateral Scler 2010; 11: pp. 157-165.
14. Foerster B.R., Dwamena B.A., Petrou M., et. al.: Diagnostic accuracy using diffusion tensor imaging in the diagnosis of ALS: a meta-analysis. Acad Radiol 2012; 19: pp. 1075-1086.
15. Riley R.D., Dodd S.R., Craig J.V., et. al.: Meta-analysis of diagnostic test studies using individual patient data and aggregate data. Stat Med 2008; 27: pp. 6111-6136.
16. Broeze K.A., Opmeer B.C., Bachmann L.M., et. al.: Individual patient data meta-analysis of diagnostic and prognostic studies in obstetrics, gynaecology and reproductive medicine. BMC Med Res Methodol 2009; 9: pp. 22.
17. Whiting P., Rutjes A.W., Reitsma J.B., et. al.: The development of QUADAS: a tool for the quality assessment of studies of diagnostic accuracy included in systematic reviews. BMC Med Res Methodol 2003; 3: pp. 25.
18. Brooks B.R., Miller R.G., Swash M., et. al.: El Escorial revisited: revised criteria for the diagnosis of amyotrophic lateral sclerosis. Amyotroph Lateral Scler Other Motor Neuron Disord 2000; 1: pp. 293-299.
19. Cosottini M., Giannelli M., Siciliano G., et. al.: Diffusion-tensor MR imaging of corticospinal tract in amyotrophic lateral sclerosis and progressive muscular atrophy. Radiology 2005; 237: pp. 258-264.
20. Reitsma J.B., Glas A.S., Rutjes A.W., et. al.: Bivariate analysis of sensitivity and specificity produces informative summary measures in diagnostic reviews. J Clin Epidemiol 2005; 58: pp. 982-990.
21. Chu H., Guo H., Zhou Y.: Bivariate random effects meta-analysis of diagnostic studies using generalized linear mixed models. Med Decis Making 2010; 30: pp. 499-508.
22. Higgins J.P., Thompson S.G., Deeks J.J., et. al.: Measuring inconsistency in meta-analyses. BMJ 2003; 327: pp. 557-560.
23. Bartels C., Mertens N., Hofer S., et. al.: Callosal dysfunction in amyotrophic lateral sclerosis correlates with diffusion tensor imaging of the central motor system. Neuromuscul Disord 2008; 18: pp. 398-407.
24. Ciccarelli O., Behrens T.E., Altmann D.R., et. al.: Probabilistic diffusion tractography: a potential tool to assess the rate of disease progression in amyotrophic lateral sclerosis. Brain 2006; 129: pp. 1859-1871.
25. Ellis C.M., Simmons A., Jones D.K., et. al.: Diffusion tensor MRI assesses corticospinal tract damage in ALS. Neurology 1999; 53: pp. 1051-1058.
26. Metwalli N.S., Benatar M., Nair G., et. al.: Utility of axial and radial diffusivity from diffusion tensor MRI as markers of neurodegeneration in amyotrophic lateral sclerosis. Brain Res 2010; 1348: pp. 156-164.
27. Roccatagliata L., Bonzano L., Mancardi G., et. al.: Detection of motor cortex thinning and corticospinal tract involvement by quantitative MRI in amyotrophic lateral sclerosis. Amyotroph Lateral Scler 2009; 10: pp. 47-52.
28. Senda J., Ito M., Watanabe H., et. al.: Correlation between pyramidal tract degeneration and widespread white matter involvement in amyotrophic lateral sclerosis: a study with tractography and diffusion-tensor imaging. Amyotroph Lateral Scler 2009; 10: pp. 288-294.
29. Wang S., Poptani H., Woo J.H., et. al.: Amyotrophic lateral sclerosis: diffusion-tensor and chemical shift MR imaging at 3.0 T. Radiology 2006; 239: pp. 831-838.
30. Comi G., Rovaris M., Leocani L.: Review neuroimaging in amyotrophic lateral sclerosis. Eur J Neurol 1999; 6: pp. 629-637.
31. Chou M., Kao E., Mori S.: Effects of b-value and echo time on MR DTI-derived axial, radial, mean diffusivity, fractional anisotropy and principal eigenvector at 1.5T: a voxel-wise study. J Med Bio Eng 2012; http://dx.doi.org/10.54505/jmbe.51126
32. Douaud G., Filippini N., Knight S., et. al.: Integration of structural and functional magnetic resonance imaging in amyotrophic lateral sclerosis. Brain 2011; 134: pp. 3470-3479.
33. Reitsma J.B., Moons K.G., Bossuyt P.M., et. al.: Systematic reviews of studies quantifying the accuracy of diagnostic tests and markers. Clin Chem 2012; 58: pp. 1534-1545.
34. Lyman G.H., Kuderer N.M.: The strengths and limitations of meta-analyses based on aggregate data. BMC Med Res Methodol 2005; 5: pp. 14.
35. Jones D.K.: The effect of gradient sampling schemes on measures derived from diffusion tensor MRI: a Monte Carlo study. Magn Reson Med 2004; 51: pp. 807-815.