
Rationale and Objectives
This study aimed to determine whether uterine leiomyoma can be distinguished from uterine leiomyosarcoma on ultrasound (US), computed tomography (CT), and/or magnetic resonance imaging (MRI) without diffusion-weighted imaging.
Materials and Methods
Institutional review board approval was obtained and informed consent was waived for this Health Insurance Portability and Accountability Act–compliant retrospective case-control diagnostic accuracy study. All subjects with resected uterine leiomyosarcoma diagnosed over a 17-year period (1998–2014) at a single institution for whom pre-resection US ( n = 10), CT ( n = 11), or MRI ( n = 7) was available were matched by tumor size and imaging modality with 28 subjects with resected uterine leiomyoma. Six blinded radiologists (three attendings, three residents) assigned 5-point Likert scores for the following features: (1) margins, (2) necrosis, (3) hemorrhage, (4) vascularity, (5) calcifications, (6) heterogeneity, and (7) likelihood of malignancy (primary end point). Mean suspicion scores were calculated and receiver operating characteristic curves were generated. The ability of individual morphologic features to predict malignancy was assessed with logistic regression.
Results
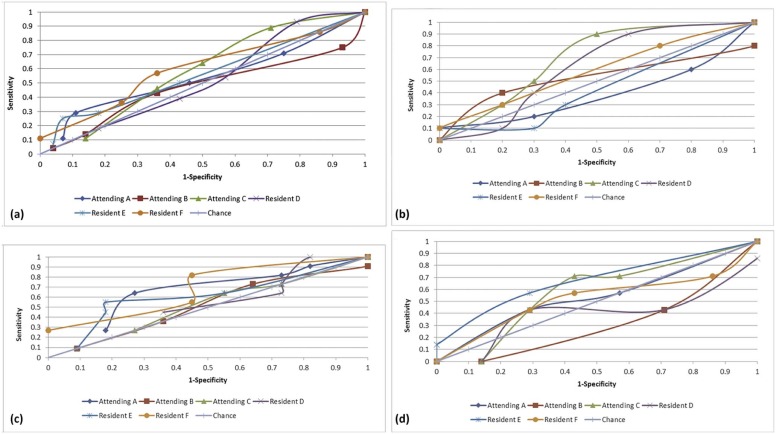
Mean suspicion scores were 2.5 ± 1.2 (attendings) and 2.4 ± 1.3 (residents) for leiomyoma, and 2.7 ± 1.3 (attendings) and 2.7 ± 1.4 (residents) for leiomyosarcoma. The areas under the receiver operating characteristic curves (range: 0.330–0.685) were not significantly different from chance, either overall ( P = .36–.88) or by any modality ( P = .28–.96), for any reader. Reader experience had no effect on diagnostic accuracy. No morphologic parameter was significantly predictive of malignancy ( P = .10–.97).
Conclusions
Uterine leiomyoma cannot be differentiated accurately from leiomyosarcoma on US, CT, or MRI without diffusion-weighted imaging.
Introduction
Uterine leiomyosarcoma is a malignant neoplasm of smooth muscle cells, comprising approximately 1% of all uterine malignancies . Prognosis is relatively poor; the National Cancer Institute reports 5-year survival ranges based on the extent of disease from 63% for patients with local disease to 36% for patients with regional disease to 14% for patients with distant disease . Clinical diagnosis is challenging, as symptoms can be indistinguishable from far more common uterine leiomyomas, and many leiomyosarcomas are only found at pathology after surgery to treat presumed leiomyomas . This can further complicate treatment, as morcellation of a leiomyosarcoma resulting in tumor spread has the potential to render a patient incurable , and infarction of leiomyosarcoma during uterine artery embolization can delay diagnosis and management.
Imaging of uterine leiomyosarcomas on ultrasound (US), computed tomography (CT), or magnetic resonance imaging (MRI) typically shows a heterogeneous mass distorting the uterine architecture , which can appear identical to degenerating or cellular leiomyomas. Some studies have examined imaging “markers” that might prospectively help distinguish leiomyosarcomas from leiomyomas, such as necrosis, hemorrhage , ill-defined or nodular margins , calcification , early/heterogeneous postcontrast enhancement , and impeded diffusion on diffusion-weighted imaging (DWI) on MRI . However, imaging characteristics highly predictive of a pathologic diagnosis of malignancy remain to be elucidated. It has been postulated that rapid growth of a uterine mass is suggestive of a diagnosis of leiomyosarcoma, but this remains controversial . Despite these efforts to clarify the imaging features that predict malignancy, there have been few studies in the literature that directly examine radiologists’ accuracy in assigning a diagnosis of either leiomyosarcoma or leiomyoma to a uterine mass, and most prior imaging studies have used small cohorts .
Get Radiology Tree app to read full this article<
Materials and Methods
Subjects
Get Radiology Tree app to read full this article<
Get Radiology Tree app to read full this article<
Get Radiology Tree app to read full this article<
TABLE 1
Study Population
Characteristic Leiomyomas Leiomyosarcomas Number 28 28 Mean age 47 ± 13 years 48 ± 9 years Race ( n ) African American 11%(3/28) 32%(9/28) Asian 4%(1/28) 7%(2/28) Caucasian 79%(22/28) 57%(16/28) Hispanic 0%(0/28) 4%(1/28) Unknown 7%(2/28) 0%(0/28) Mean gravidity 2.1 ± 1.5 2.6 ± 1.9 Mean parity 1.9 ± 1.3 2.0 ± 1.5 Prior uterine artery embolization 0%(0/28) 0%(0/28) Prior hormone therapy 36%(10/28) 18%(5/28) Imaging modality ( n ) CT ( n ) 43%(12/28) 43%(12/28) MRI ( n ) 25%(7/28) 25%(7/28) Ultrasound ( n ) 36%(10/28) 36%(10/28) Mean mass size 11 ± 7 cm 10 ± 5 cm
CT, computed tomography; MRI, magnetic resonance imaging.
Get Radiology Tree app to read full this article<
Reference Standard
Get Radiology Tree app to read full this article<
Imaging Details
Get Radiology Tree app to read full this article<
Get Radiology Tree app to read full this article<
Get Radiology Tree app to read full this article<
Get Radiology Tree app to read full this article<
Image Review
Get Radiology Tree app to read full this article<
Get Radiology Tree app to read full this article<
Get Radiology Tree app to read full this article<
Clinical Data
Get Radiology Tree app to read full this article<
Data Analysis
Get Radiology Tree app to read full this article<
Get Radiology Tree app to read full this article<
Results
Get Radiology Tree app to read full this article<
Get Radiology Tree app to read full this article<
TABLE 2
Areas Under the Receiver Operating Characteristic (ROC) Curves by Reader and Modality (Ultrasound [ n = 20], CT [ n = 22], MRI [ n = 14])
Reader All Examinations
( n = 56)P Ultrasound
( n = 20)P CT
( n = 22)P MRI
( n = 14)P Attending A 0.539 .72 0.405 .61 0.650 .39 0.540 .86 B 0.470 .79 0.520 .91 0.513 .96 0.330 .44 C 0.582 .45 0.685 .30 0.521 .91 0.579 .72 Resident D 0.517 .88 0.610 .55 0.541 .82 0.400 .65 E 0.562 .57 0.440 .75 0.618 .50 0.660 .47 F 0.600 .36 0.585 .65 0.685 .28 0.527 .90
CT, computed tomography; MRI, magnetic resonance imaging.

Get Radiology Tree app to read full this article<
Get Radiology Tree app to read full this article<
TABLE 3
Mean Attending Radiologist Imaging Characteristic Scores (Scale: 1–5) Stratified by Histology
Characteristic Leiomyoma Leiomyosarcoma_P_ Margins 2.2 ± 0.8 2.5 ± 0.9 .26 Necrosis 2.1 ± 1.1 2.2 ± 1.1 .79 Hemorrhage 1.6 ± 1.1 1.2 ± 0.5 .10 Vascularity 2.9 ± 0.9 2.9 ± 0.6 .74 Calcifications 1.3 ± 0.6 1.3 ± 0.7 .97 Heterogeneity 3.4 ± 0.9 3.3 ± 1.0 .96
P values refer to univariate logistic regression analyses evaluating mean characteristic scores relative to the probability of malignancy within a uterine mass. Higher numbers indicate more of the stated characteristic, with the exception of “margins,” for which a higher score indicates more ill-defined margins.
Get Radiology Tree app to read full this article<
Discussion
Get Radiology Tree app to read full this article<
Get Radiology Tree app to read full this article<
Get Radiology Tree app to read full this article<
Get Radiology Tree app to read full this article<
Get Radiology Tree app to read full this article<
Get Radiology Tree app to read full this article<
Get Radiology Tree app to read full this article<
Compliance with Ethical Standards
Get Radiology Tree app to read full this article<
References
1. Hendrickson M.R., Tavassoli F., Kempson R.L., et. al.: WHO Classification of tumors.Tavassoli F.Devilee P.Pathology and genetics of tumors of the breast and female genital organs.2003.IARC PressLyon:pp. 237-238.
2. Harlow B.L., Weiss N.S., Lofton S.: The epidemiology of sarcomas of the uterus. J Natl Cancer Inst 1986; 76: pp. 399-402.
3. American Cancer Society : Survival rates for uterine sarcoma, by stage. Available at: http://www.cancer.org/cancer/uterinesarcoma/detailedguide/uterine-sarcoma-survival-rates Accessed September 1, 2015
4. D’Angelo E., Prat J.: Uterine sarcomas: a review. Gynecol Oncol 2010; 116: pp. 131-139.
5. Ciszak T., Mittal P.K., Sullivan P., et. al.: Case report: MR imaging features of disseminated uterine leiomyosarcoma presenting after hysterectomy with morcellation. Abdom Imaging 2015; 40: pp. 2600-2605.
6. Seidman M.A., Oduyebo T., Muto M.G., et. al.: Peritoneal dissemination complicating morcellation of uterine mesenchymal neoplasms. PLoS ONE 2012; 7: e50058
7. Tirumani S.H., Ojili V., Shanbhogue A.K., et. al.: Current concepts in the imaging of uterine sarcoma. Abdom Imaging 2013; 38: pp. 397-411.
8. Tanaka Y.O., Nishida M., Tsunoda H., et. al.: Smooth muscle tumors of uncertain malignant potential and leiomyosarcomas of the uterus: MR findings. J Magn Reson Imaging 2004; 20: pp. 998-1007.
9. Cornfeld D., Israel G., Martel M., et. al.: MRI appearance of mesenchymal tumors of the uterus. Eur J Radiol 2010; 74: pp. 241-249.
10. Santos P., Cunha T.M.: Uterine sarcomas: clinical presentation and MRI features. Diagn Interv Radiol 2015; 21: pp. 4-9.
11. Schwartz L.B., Zawin M., Carcangiu M.L., et. al.: Does pelvic magnetic resonance imaging differentiate among the histologic subtypes of uterine leiomyomata?. Fertil Steril 1998; 70: pp. 580-587.
12. Sala E., Rockall A.G., Freeman S.J., et. al.: The added role of MR imaging in treatment stratification of patients with gynecologic malignancies: what the radiologist needs to know. Radiology 2013; 266: pp. 717-740.
13. Shah S.H., Jagannathan J.P., Krajewski K., et. al.: Uterine sarcomas: then and now. AJR Am J Roentgenol 2012; 199: pp. 213-223.
14. Wu T.I., Yen T.C., Lai C.H.: Clinical presentation and diagnosis of uterine sarcoma, including imaging. Best Pract Res Clin Obstet Gynaecol 2011; 25: pp. 681-689.
15. Namimoto T., Yamashita Y., Awai K., et. al.: Combined use of T2-weighted and diffusion-weighted 3-T MR imaging for differentiating uterine sarcomas from benign leiomyomas. Eur Radiol 2009; 19: pp. 2756-2764.
16. Sato K., Yuasa N., Fujita M., et. al.: Clinical application of diffusion-weighted imaging for preoperative differentiation between uterine leiomyoma and leiomyosarcoma. Am J Obstet Gynecol 2014; 210: pp. e361-e368.
17. Tamai K., Koyama T., Saga T., et. al.: The utility of diffusion-weighted MR imaging for differentiating uterine sarcomas from benign leiomyomas. Eur Radiol 2008; 18: pp. 723-730.
18. Tasaki A., Asatani M.O., Umezu H., et. al.: Differential diagnosis of uterine smooth muscle tumors using diffusion-weighted imaging: correlations with the apparent diffusion coefficient and cell density. Abdom Imaging 2015; 40: pp. 1742-1752.
19. Aviram R., Ochshorn Y., Markovitch O., et. al.: Uterine sarcomas versus leiomyomas: gray-scale and Doppler sonographic findings. J Clin Ultrasound 2005; 33: pp. 10-13.
20. Exacoustos C., Romanini M.E., Amadio A., et. al.: Can gray-scale and color Doppler sonography differentiate between uterine leiomyosarcoma and leiomyoma?. J Clin Ultrasound 2007; 35: pp. 449-457.
21. Parker W.H., Fu Y.S., Berek J.S.: Uterine sarcoma in patients operated on for presumed leiomyoma and rapidly growing leiomyoma. Obstet Gynecol 1994; 83: pp. 414-418.