
Rationale and Objectives
The combination of functional magnetic resonance imaging (fMRI) of the brain with multivariate pattern analysis (MVPA) has been proposed as a possible diagnostic tool. Goal of this investigation was to identify potential functional connectivity (FC) differences in the salience network (SN) and default mode network (DMN) between fibromyalgia syndrome (FMS), rheumatoid arthritis (RA), and controls (HC) and to evaluate the diagnostic applicability of derived pattern classification approaches.
Materials and Methods
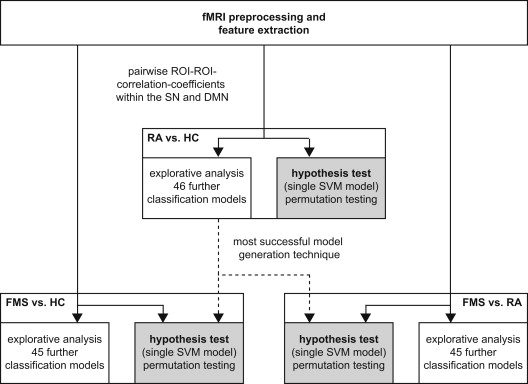
The resting period during an fMRI examination was retrospectively analyzed in women with FMS ( n = 17), RA ( n = 16), and HC ( n = 17). FC was calculated for SN and DMN subregions. Classification accuracies of discriminative MVPA models were evaluated with cross-validation: (1) inferential test of a single method, (2) explorative model optimization.
Results
No inferentially tested model was able to classify subjects with statistically significant accuracy. However, the diagnostic ability for the differential diagnostic problem exhibited a trend to significance (accuracy: 69.7%, P = .086). Optimized models in the explorative analysis reached accuracies up to 73.5% (FMS vs. HC), 78.8% (RA vs. HC), and 78.8% (FMS vs. RA) whereas other models performed at or below chance level. Comparable support vector machine approaches performed above average for all three problems.
Conclusions
Observed accuracies are not sufficient to reliably differentiate between FMS and RA for diagnostic purposes. However, some indirect evidence in support of the feasibility of this approach is provided. This exploratory analysis constitutes a fundamental model optimization effort to be based on in further investigations.
Blood oxygen level–dependent functional magnetic resonance imaging (fMRI) has an enormous impact on basic research in the field of cognitive neurosciences and has been applied in numerous group studies with the aim to clarify disease mechanisms e.g. . However, the applicability of fMRI to single subjects in clinical radiology has been limited to a few indications, such as surgery planning . Recently, there have been promising attempts to adopt measures of functional connectivity (FC) at rest, obtained by inherently noisy fMRI of the brain, for diagnostic purposes in hypothetically systemic brain disease (including mental disorders). These novel approaches are based on multivariate pattern classification techniques from the field of machine learning and are often termed “multivariate pattern analysis” (MVPA) in this context . Chronic pain is a frequent symptom with a major impact on well-being, direct healthcare costs, and further indirect costs. It is not a uniform condition but associated with several disease entities and different assumed degrees or modes of central pain sensitization. For this reason, there are endeavors to identify potential biomarkers to guide treatment of chronic pain . In this study, we evaluated the applicability of FC-based fMRI-MVPA methods in the diagnostics in two chronic pain disorders.
Conventional univariate analyses of fMRI data based on single voxels or regions of interest (ROI) are highly prone to variability representing true biological effects and image noise . Therefore, they usually do not facilitate clinical decision making in systemic alterations of brain functions. Recent MVPA applications are based on automatically generating decision rules based on multiple features extracted from training data. These rules or “classifiers” are then used to assign individual new data sets to predefined categories. Depending on the actual classification method, it can be beneficial to identify to what extent individual features contribute to the diagnostic decision preceding actual classifier training. Narrowing down the choice of important features contributing to classification (feature selection or feature weighting) is intended to improve diagnostic accuracies, particularly in methods that cannot deal with a high data dimensionality. Other methods of dimensionality reduction are not primarily based on eliminating or weighting features but restructure the information to a smaller set of features such as in principal component analyses (PCA). Although testing a classifier in an independent data set is favorable, there is a common practice that allows a valid estimation of classification accuracies even in small data sets: cross-validation (CV). For CV, feature selection and classifier training are repeated several times. Each time a different range of data sets, exactly one in the case of leave-one-out CV (LOOCV), is excluded and used as a test set. Diagnostic accuracy is estimated by aggregating diagnostic decisions in a CV setting . There is a wide variety of classification algorithms . Exemplarily, support vector machines (SVM) are especially common in recent fMRI-based diagnostic approaches . Here, the classification problem is operationalized as defining a hyperplane which best distinguishes between groups of subjects. The classifier is trained using a kernel by maximizing the margin of separation between two groups based on the examples closest to the separating hyperplane. In soft margin SVMs, a penalty term is used (“C” in the SVM implementation used here) to adjust the amount of misclassification allowed during classifier training to avoid overfitting. A high value of C means only a small amount of misclassification is permitted .
Get Radiology Tree app to read full this article<
Get Radiology Tree app to read full this article<
Get Radiology Tree app to read full this article<
Get Radiology Tree app to read full this article<
Materials and methods
Subjects and Data Acquisition
Get Radiology Tree app to read full this article<
Get Radiology Tree app to read full this article<
fMRI Feature Extraction
Get Radiology Tree app to read full this article<
Table 1
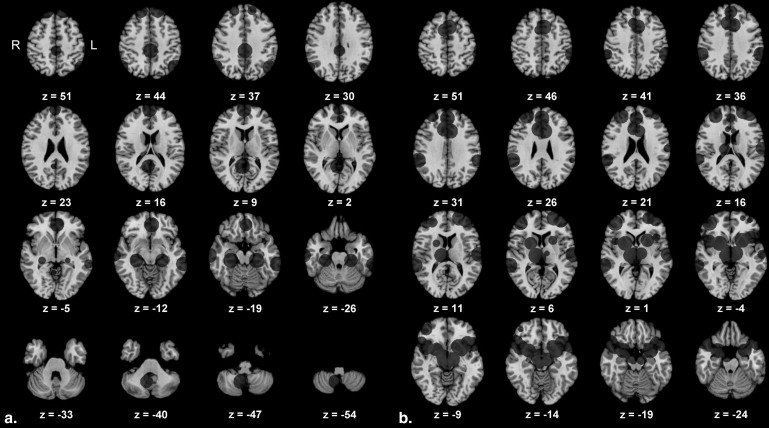
Region of Interest Center Coordinates Used in the Functional Connectivity Analysis, Coordinates in MNI Space, SN Derived From Seeley et al., and DMN Converted From Fox et al.
Anatomical Label in the Original Study x y z Default mode network (DMN) 1 Posterior cingulate cortex 0 −33 40 2 Retrosplenial cortex 5 −52 9 3 Left lateral parietal cortex −49 −66 43 4 Right lateral parietal cortex 59 −66 41 5 Left medial prefrontal cortex −2 43 −11 6 Right medial prefrontal cortex 2 61 13 7 Left superior frontal gyrus −14 47 49 8 Right superior frontal gyrus 20 46 49 9 Left inferior temporal gyrus −65 −35 −17 10 Right inferior temporal gyrus 71 −18 −21 11 Left parahippocampal gyrus −23 −28 −19 12 Right parahippocampal gyrus 28 −28 −18 13 Right cerebellar tonsil 8 −58 −48 Salience network (SN) 14 Right orbital frontoinsula 42 10 −12 15 Left orbital frontoinsula −40 18 −12 16 Right temporal pole 52 20 −18 17 Left temporal pole −52 16 −14 18 Paracingulate 0 44 28 19 Right dorsal anterior cingulate cortex 6 22 30 20 Left dorsal anterior cingulate cortex −6 18 30 21 Right (pre) supplementary motor area 6 8 58 22 Left (pre) supplementary motor area −4 14 48 23 Right superior temporal gyrus 64 −38 6 24 Left superior temporal gyrus −62 −16 8 25 Right parietal operculum 58 −40 30 26 Left parietal operculum −60 −40 40 27 Left frontal pole −24 56 10 28 Right ventrolateral prefrontal cortex 42 46 0 29 Right dorsolateral prefrontal cortex 30 48 22 30 Left dorsolateral prefrontal cortex −38 52 10 31 Right ventral striatopallidum 22 6 −2 32 Left ventral striatopallidum −22 12 −6 33 Right thalamus, dorsomedial 12 −18 6 34 Right hypothalamus 6 −16 −6 35 Left hypothalamus −10 −14 −8 36 Right sublenticular extended amygdala/paraolfactory 26 4 −20 37 Left sublenticular extended amygdala/paraolfactory −28 4 −18 38 Left periaquaeductal gray −4 −24 −2 39 Right substantia nigra, ventral tegmental area 8 −8 −14
Get Radiology Tree app to read full this article<
Get Radiology Tree app to read full this article<
Univariate Analyses
Get Radiology Tree app to read full this article<
Multivariate Classification
Get Radiology Tree app to read full this article<
Get Radiology Tree app to read full this article<
Get Radiology Tree app to read full this article<
Get Radiology Tree app to read full this article<
Get Radiology Tree app to read full this article<
Results
Pain Ratings
Get Radiology Tree app to read full this article<
Rheumatoid Arthritis versus Controls
Get Radiology Tree app to read full this article<
Table 2
Classification Accuracy of All Tested Multivariate Classification Models
PCA FW RA versus HC (%) FMS versus HC (%) RA versus FMS (%) Reference (assigning all samples to the larger group) 51.5 50.0 51.5 C-SVC, lin, C = 100 + 57.6 ∗ — — C-SVC, lin, C = 0.001 + 30.3 0.0 36.4 C-SVC, lin, C = 0.001 27.3 0.0 36.4 C-SVC, lin, C = 1 + 57.6 61.8 48.5 C-SVC, lin, C = 1 63.6 64.7 54.6 C-SVC, lin, C = 1000 + 57.6 61.8 54.6 C-SVC, lin, C = 1000 63.6 64.7 54.6 C-SVC, rbf, C = 0.001 + 33.3 0.0 36.4 C-SVC, rbf, C = 0.001 36.4 0.0 36.4 C-SVC, rbf, C = 1 + 51.5 17.7 48.5 C-SVC, rbf, C = 1 45.5 8.8 54.6 C-SVC, rbf, C = 1000 + 63.6 61.8 54.6 C-SVC, rbf, C = 1000 63.6 58.8 54.6 C-SVC, lin, C = 0.001 + + 27.3 0.0 27.3 C-SVC, lin, C = 0.001 + 33.3 0.0 33.3 C-SVC, lin, C = 1 + + 78.8 61.8 ∗ 69.7 ∗ C-SVC, lin, C = 1 + 66.7 73.5 66.7 C-SVC, lin, C = 1000 + + 75.8 50.0 72.7 C-SVC, lin, C = 1000 + 66.7 73.5 66.7 C-SVC, rbf, C = 0.001 + + 30.3 0.0 27.3 C-SVC, rbf, C = 0.001 + 33.3 0.0 33.3 C-SVC, rbf, C = 1 + + 60.6 50.0 48.5 C-SVC, rbf, C = 1 + 33.3 0.0 33.3 C-SVC, rbf, C = 1000 + + 69.7 47.1 69.7 C-SVC, rbf, C = 1000 + 66.7 73.5 66.7 decision trees + 18.2 50.0 33.3 decision trees 33.3 38.2 21.2 random forests + 63.6 44.1 45.5 random forests 36.6 55.9 51.5 decision trees + + 21.2 50.0 33.3 decision trees + 33.3 38.2 21.2 random forests + + 39.4 38.2 39.4 random forests + 54.6 44.1 39.4 k-NN + 54.6 61.8 63.6 k-NN 60.6 52.9 66.7 k-NN + + 36.4 61.8 57.6 k-NN + 54.6 47.1 78.8 Naive Bayes + 48.5 58.8 66.7 Naive Bayes 57.6 44.1 54.6 Naive Bayes + + 45.5 55.9 63.6 Naive Bayes + 57.6 47.1 54.6 LDA + 54.6 58.8 48.5 LDA 42.4 47.1 33.3 LDA + + 51.5 58.8 48.5 LDA + 72.7 67.7 57.6 Multilayer perceptron + 51.5 52.9 57.6 Multilayer perceptron + + 45.5 52.9 54.6
FMS, fibromyalgia syndrome; FW, feature weighting; HC, healthy controls; LDA, linear discriminant analysis; lin, linear kernel; NN, nearest neighbor; PCA, principal component analysis; RA, rheumatoid arthritis; rbf, radial basis functions kernel; SVC, support vector classification.
Get Radiology Tree app to read full this article<
Get Radiology Tree app to read full this article<
Fibromyalgia versus Controls
Get Radiology Tree app to read full this article<
Fibromyalgia versus Rheumatoid Athritis
Get Radiology Tree app to read full this article<
Discussion
Get Radiology Tree app to read full this article<
Get Radiology Tree app to read full this article<
Get Radiology Tree app to read full this article<
Get Radiology Tree app to read full this article<
Acknowledgments
Get Radiology Tree app to read full this article<
Get Radiology Tree app to read full this article<
References
1. Huettel S.A., Song A.W., McCarthy G.: Functional magnetic resonance imaging.2009.Sinauer AssociatesSunderland
2. Zhang D., Raichle M.E.: Disease and the brain’s dark energy. Nat Rev Neurol 2010; 6: pp. 15-28.
3. Chen C.H., Suckling J., Lennox B.R., et. al.: A quantitative meta-analysis of fMRI studies in bipolar disorder. Bipolar Disord 2011; 13: pp. 1-15.
4. Bartsch A.J., Homola G., Biller A., et. al.: Diagnostic functional MRI: illustrated clinical applications and decision-making. J Magn Reson Imaging 2006; 23: pp. 921-932.
5. Pillai J.J.: The evolution of clinical functional imaging during the past 2 decades and its current impact on neurosurgical planning. AJNR Am J Neuroradiol 2010; 31: pp. 219-225.
6. Sundermann B, Herr D, Schwindt W, et al. Multivariate classification of blood oxygen level-dependent fMRI data with diagnostic intention: a clinical perspective. AJNR Am J Neuroradiol 2013; epub ahead of print (DOI: 10.3174/ajnr.A3713).
7. Klöppel S., Abdulkadir A., Jack C.R., et. al.: Diagnostic neuroimaging across diseases. Neuroimage 2012; 61: pp. 457-463.
8. Orrù G., Pettersson-Yeo W., Marquand A.F., et. al.: Using Support Vector Machine to identify imaging biomarkers of neurological and psychiatric disease: a critical review. Neurosci Biobehav Rev 2012; 36: pp. 1140-1152.
9. Karst M., Jasper S., Bernateck M., et. al.: Clinical diagnostics and therapy of chronic pain syndromes. Psychother Psychosom Med Psychol 2012; 62: pp. 320-330.
10. Raemaekers M., du Plessis S., Ramsey N.F., et. al.: Test-retest variability underlying fMRI measurements. Neuroimage 2012; 60: pp. 717-727.
11. Shehzad Z., Kelly A.M., Reiss P.T., et. al.: The resting brain: unconstrained yet reliable. Cereb Cortex 2009; 19: pp. 2209-2229.
12. Mueller S., Wang D., Fox M.D., et. al.: Individual variability in functional connectivity architecture of the human brain. Neuron 2013; 77: pp. 586-595.
13. Pereira F., Mitchell T., Botvinick M.: Machine learning classifiers and fMRI: a tutorial overview. Neuroimage 2009; 45: pp. S199-S209.
14. Alpaydin E.: Introduction to machine learning.2010.The MIT PressCambridge, MA
15. Vapnik V.N.: The nature of statistical learning theory.2nd ed.2000.Springer-VerlagNew York
16. Jones A.K., Huneke N.T., Lloyd D.M., et. al.: Role of functional brain imaging in understanding rheumatic pain. Curr Rheumatol Rep 2012; 14: pp. 557-567.
17. Schmidt-Wilcke T., Clauw D.J.: Fibromyalgia: from pathophysiology to therapy. Nat Rev Rheumatol 2011; 7: pp. 518-527.
18. Lee Y.C., Nassikas N.J., Clauw D.J.: The role of the central nervous system in the generation and maintenance of chronic pain in rheumatoid arthritis, osteoarthritis and fibromyalgia. Arthritis Res Ther 2011; 13: pp. 211.
19. Mouraux A., Diukova A., Lee M.C., et. al.: A multisensory investigation of the functional significance of the “pain matrix”. Neuroimage 2011; 54: pp. 2237-2249.
20. Seeley W.W., Menon V., Schatzberg A.F., et. al.: Dissociable intrinsic connectivity networks for salience processing and executive control. J Neurosci 2007; 27: pp. 2349-2356.
21. Smith S.M., Fox P.T., Miller K.L., et. al.: Correspondence of the brain’s functional architecture during activation and rest. Proc Natl Acad Sci U S A 2009; 106: pp. 13040-13045.
22. Kim J.Y., Kim S.H., Seo J., et. al.: Increased power spectral density in resting-state pain-related brain networks in fibromyalgia. Pain 2013; 154: pp. 1792-1797.
23. Cifre I., Sitges C., Fraiman D., et. al.: Disrupted functional connectivity of the pain network in fibromyalgia. Psychosom Med 2012; 74: pp. 55-62.
24. Kornelsen J., Sboto-Frankenstein U., McIver T., et. al.: Default mode network functional connectivity altered in failed back surgery syndrome. J Pain 2013; 14: pp. 483-491.
25. Otti A., Guendel H., Wohlschlager A., et. al.: Frequency shifts in the anterior default mode network and the salience network in chronic pain disorder. BMC Psychiatry 2013; 13: pp. 84.
26. Baliki M.N., Geha P.Y., Apkarian A.V., et. al.: Beyond feeling: chronic pain hurts the brain, disrupting the default-mode network dynamics. J Neurosci 2008; 28: pp. 1398-1403.
27. Baliki M.N., Baria A.T., Apkarian A.V.: The cortical rhythms of chronic back pain. J Neurosci 2011; 31: pp. 13981-13990.
28. Tagliazucchi E., Balenzuela P., Fraiman D., et. al.: Brain resting state is disrupted in chronic back pain patients. Neurosci Lett 2010; 485: pp. 26-31.
29. Napadow V., Kim J., Clauw D.J., et. al.: Decreased intrinsic brain connectivity is associated with reduced clinical pain in fibromyalgia. Arthritis Rheum 2012; 64: pp. 2398-2403.
30. Jensen K.B., Loitoile R., Kosek E., et. al.: Patients with fibromyalgia display less functional connectivity in the brain’s pain inhibitory network. Mol Pain 2012; 8: pp. 32.
31. Fox M.D., Snyder A.Z., Vincent J.L., et. al.: The human brain is intrinsically organized into dynamic, anticorrelated functional networks. Proc Natl Acad Sci U S A 2005; 102: pp. 9673-9678.
32. Raichle M.E., Snyder A.Z.: A default mode of brain function: a brief history of an evolving idea. Neuroimage 2007; 37: pp. 1083-1090.
33. Kanda M., Nagamine T., Ikeda A., et. al.: Primary somatosensory cortex is actively involved in pain processing in human. Brain Res 2000; 853: pp. 282-289.
34. Frot M., Magnin M., Mauguiere F., et. al.: Cortical representation of pain in primary sensory-motor areas (S1/M1)–a study using intracortical recordings in humans. Hum Brain Mapp 2013; 34: pp. 2655-2668.
35. Napadow V., LaCount L., Park K., et. al.: Intrinsic brain connectivity in fibromyalgia is associated with chronic pain intensity. Arthritis Rheum 2010; 62: pp. 2545-2555.
36. Jones A.K., Derbyshire S.W.: Reduced cortical responses to noxious heat in patients with rheumatoid arthritis. Ann Rheum Dis 1997; 56: pp. 601-607.
37. Burgmer M., Pogatzki-Zahn E., Gaubitz M., et. al.: Fibromyalgia unique temporal brain activation during experimental pain: a controlled fMRI Study. J Neural Transm 2010; 117: pp. 123-131.
38. Burgmer M., Pogatzki-Zahn E., Gaubitz M., Wessoleck E., Heuft G., Pfleiderer B.: Altered brain activity during pain processing in fibromyalgia. Neuroimage 2009; 44: pp. 502-508.
39. Pogatzki-Zahn E.M., Wagner C., Meinhardt-Renner A., et. al.: Coding of incisional pain in the brain: a functional magnetic resonance imaging study in human volunteers. Anesthesiology 2010; 112: pp. 406-417.
40. Burgmer M., Pfleiderer B., Maihofner C., et. al.: Cerebral mechanisms of experimental hyperalgesia in fibromyalgia. Eur J Pain 2012; 16: pp. 636-647.
41. Burgmer M., Petzke F., Giesecke T., Gaubitz M., Heuft G., Pfleiderer B.: Cerebral activation and catastrophizing during pain anticipation in patients with fibromyalgia. Psychosom Med 2011; 73: pp. 751-759.
42. Wolfe F., Smythe H.A., Yunus M.B., et. al.: The American College of Rheumatology 1990 criteria for the classification of fibromyalgia. Report of the Multicenter Criteria Committee. Arthritis Rheum 1990; 33: pp. 160-172.
43. Arnett F.C., Edworthy S.M., Bloch D.A., et. al.: The American Rheumatism Association 1987 revised criteria for the classification of rheumatoid arthritis. Arthritis Rheum 1988; 31: pp. 315-324.
44. Tait R.C., Pollard C.A., Margolis R.B., et. al.: The Pain Disability Index: psychometric and validity data. Arch Phys Med Rehabil 1987; 68: pp. 438-441.
45. Friston K.J., Frith C.D., Liddle P.F., et. al.: Functional connectivity: the principal-component analysis of large (PET) data sets. J Cereb Blood Flow Metab 1993; 13: pp. 5-14.
46. Talairach J.: Co-planar stereotaxic atlas of the human brain.1988.Thieme Medical PublishersNew York
47. Lancaster J.L., Tordesillas-Gutierrez D., Martinez M., et. al.: Bias between MNI and Talairach coordinates analyzed using the ICBM-152 brain template. Hum Brain Mapp 2007; 28: pp. 1194-1205.
48. Van Dijk K.R., Hedden T., Venkataraman A., et. al.: Intrinsic functional connectivity as a tool for human connectomics: theory, properties, and optimization. J Neurophysiol 2010; 103: pp. 297-321.
49. Sundermann B., Pfleiderer B.: Functional connectivity profile of the human inferior frontal junction: involvement in a cognitive control network. BMC Neurosci 2012; 13: pp. 119.
50. Song X.W., Dong Z.Y., Long X.Y., et. al.: REST: a toolkit for resting-state functional magnetic resonance imaging data processing. PLoS One 2011; 6: pp. e25031.
51. Chao-Gan Y., Yu-Feng Z.: DPARSF: a MATLAB toolbox for “Pipeline” data analysis of resting-state fMRI. Front Syst Neurosci 2010; 4: pp. 13.
52. Mierswa I, Wurst M, Klinkenberg R, et al. YALE: rapid prototyping for complex data mining tasks. Proceedings of the 12th ACM SIGKDD International Conference on Knowledge Discovery and Data Mining 2006:935–940.
53. Chang C., Lin C.: LIBSVM: a library for support vector machines. ACM Trans.Intell.Syst.Technol 2011; 2: pp. 1-27.
54. Golland P., Fischl B.: Taylor C.Noble J.A.Permutation tests for classification: towards statistical significance in image-based studies.2003.SpringerBerlin Heidelberg:pp. 330-341.
55. Hall M., Eibe F., Holmes G., et. al.: The WEKA data mining software: an update. SIGKDD Explorations 2009; pp. 11.
56. Etzel JA, Braver TS. MVPA permutation schemes. Permutation testing in the land of cross-validation. 3rd International Workshop on Pattern Recognition in Neuroimaging Philadelphia 2013, (DOI: 10.1109/PRNI.2013.44).
57. American Psychiatric Association, American Psychiatric Association Task Force on DSM-IV: Diagnostic and statistical manual of mental disorders: DSM-IV-TR.2000.American Psychiatric AssociationWashington, DC
58. Stewart D.E., Yuen T.: A systematic review of resilience in the physically ill. Psychosomatics 2011; 52: pp. 199-209.
59. Hess A., Axmann R., Rech J., et. al.: Blockade of TNF-alpha rapidly inhibits pain responses in the central nervous system. Proc Natl Acad Sci U S A 2011; 108: pp. 3731-3736.
60. De Havas J.A., Parimal S., Soon C.S., et. al.: Sleep deprivation reduces default mode network connectivity and anti-correlation during rest and task performance. Neuroimage 2012; 59: pp. 1745-1751.
61. Fan J., Xu P., Van Dam N.T., et. al.: Spontaneous brain activity relates to autonomic arousal. J Neurosci 2012; 32: pp. 11176-11186.
62. Anderson J.S., Ferguson M.A., Lopez-Larson M., et. al.: Reproducibility of single-subject functional connectivity measurements. AJNR Am J Neuroradiol 2011; 32: pp. 548-555.
63. van den Heuvel M.P., Hulshoff Pol H.E.: Exploring the brain network: a review on resting-state fMRI functional connectivity. Eur Neuropsychopharmacol 2010; 20: pp. 519-534.
64. Fox M.D., Zhang D., Snyder A.Z., et. al.: The global signal and observed anticorrelated resting state brain networks. J Neurophysiol 2009; 101: pp. 3270-3283.